Macquarie University STAT1250 Week 2 Practical: Excel and Data

Verified

Added on  2021/10/13

|6
|2421
|282
Practical Assignment
AI Summary
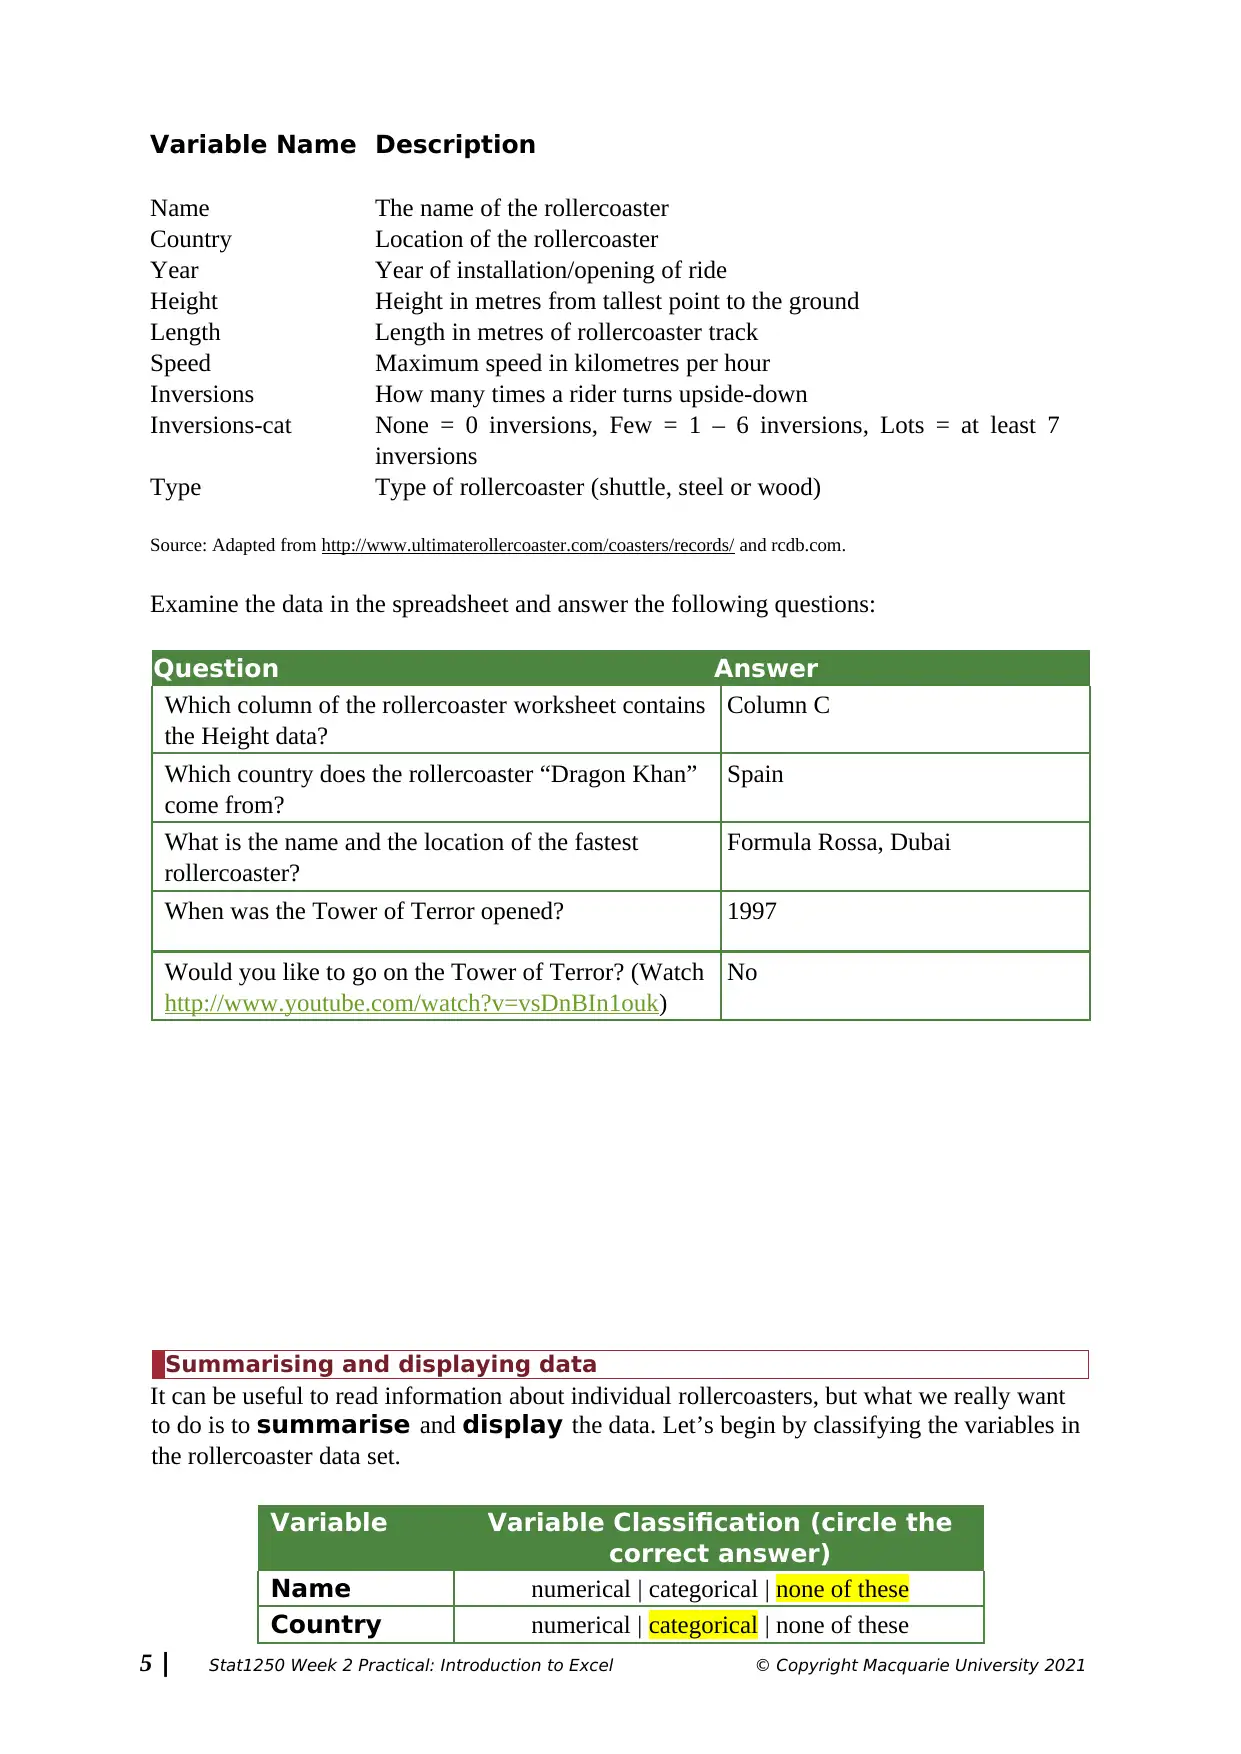
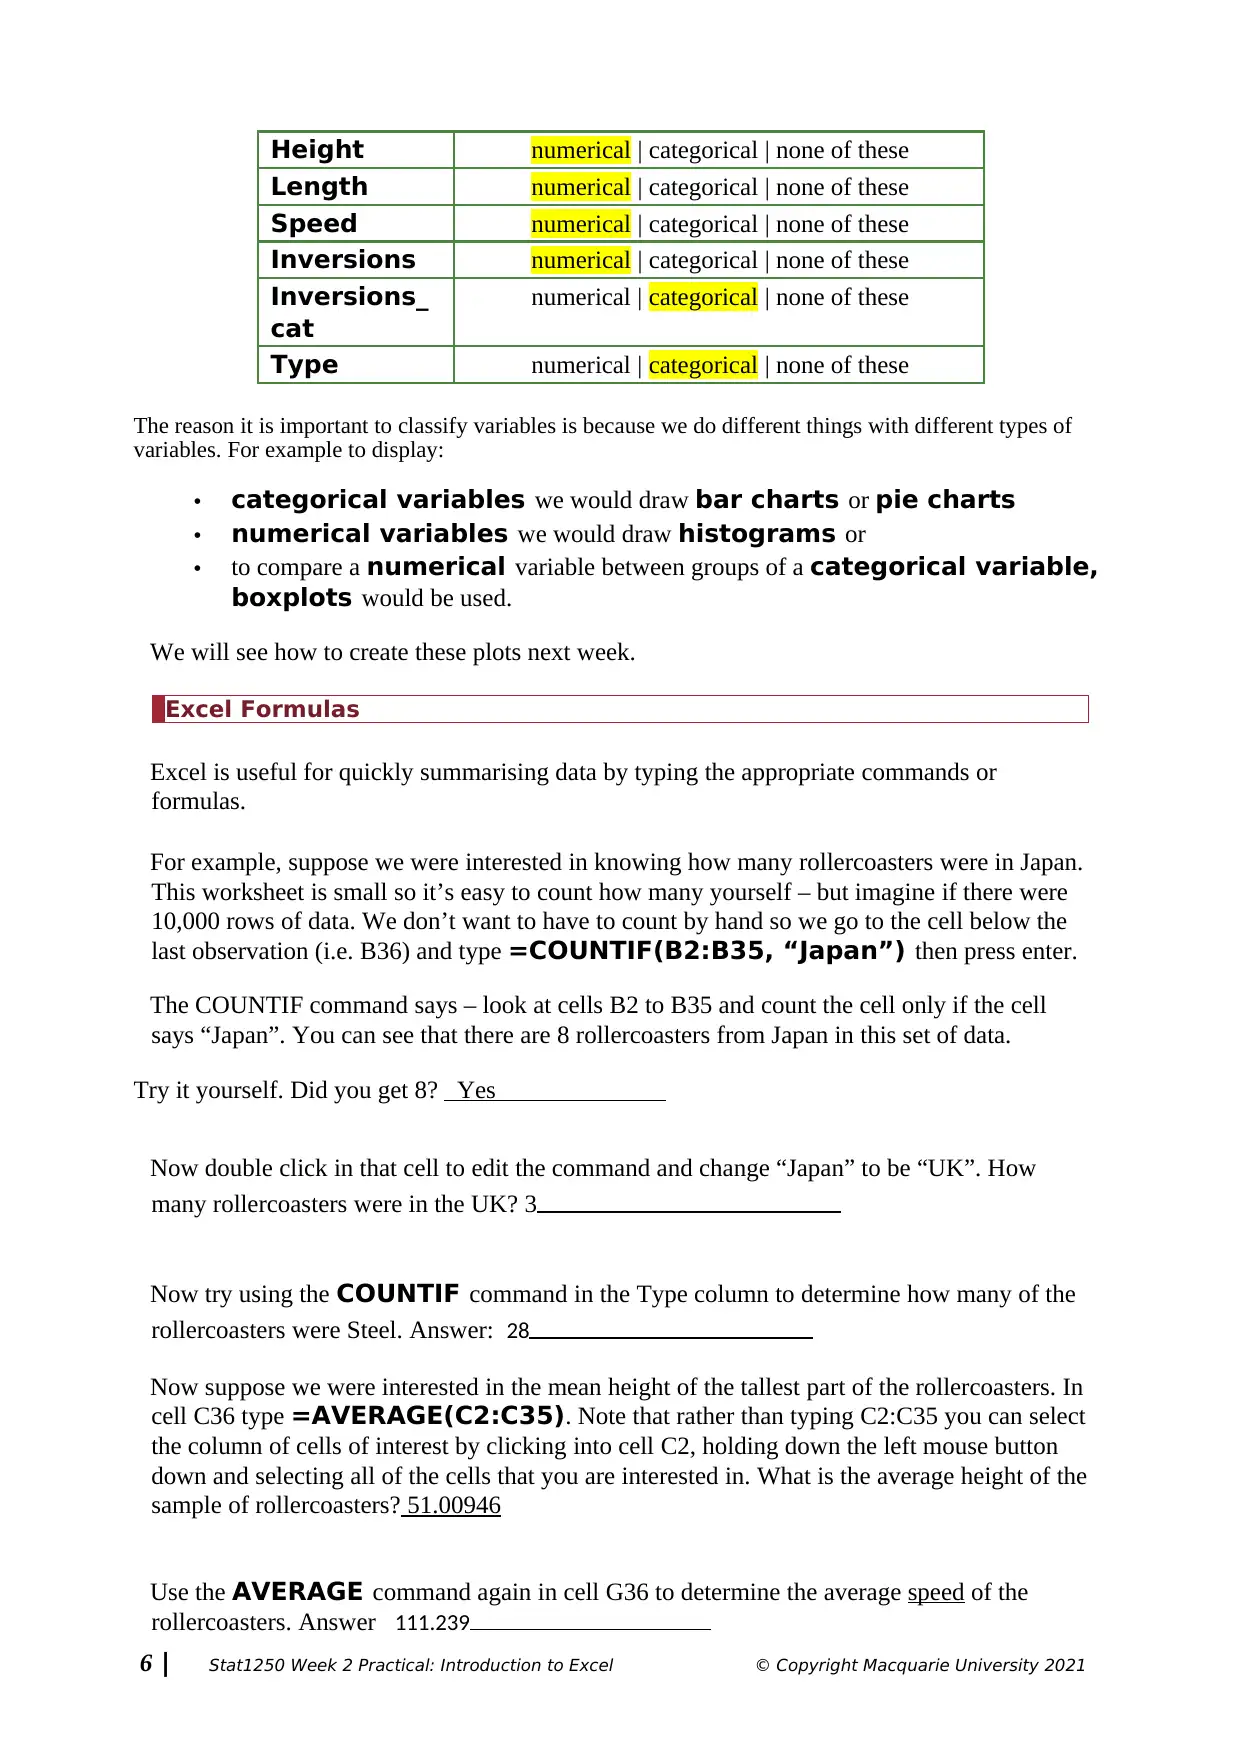
This practical assignment for STAT1250 introduces students to the use of Microsoft Excel for data analysis. The assignment covers fundamental Excel skills such as opening and editing data files, using Excel as a calculator, and applying basic formulas like SUM, COUNTIF, AVERAGE, MIN, and MAX. Students learn to import data from external files, classify variables, and sort data. The assignment uses a real-world dataset of rollercoasters to demonstrate these concepts, including answering questions about the data and classifying variables as numerical or categorical. The practical also includes a hurdle quiz and emphasizes the importance of completing the practical sessions. The assignment aims to equip students with the necessary skills to perform basic data manipulation and summarization using Excel.
tabler-icon-diamond-filled.svg

Contribute Materials

Your contribution can guide someone’s learning journey. Share your documents today.
Document Page
Week 2 Practical
Introduction
Welcome to STAT1250 Practical classes! These classes complement and extend the concepts
you learn in lectures. Today you will begin to learn about how to use the computer package
Excel.
Practical participation is compulsory (it is a Hurdle requirement)
and participation will be recorded during your class time. You must
attend at least 10 of the 12 practicals or you will receive a fail in the unit. You must attend
the practical that you are registered in according to e-student. It is your responsibility to
complete the participation quiz during your practical.
Each practical class will contain:
revision of material covered in lectures and tutorials
problem solving using Excel
The data files that are used in these practicals will be made available on iLearn in the
Data Sets section.
When completing the practicals having your lecture notes with you is useful for reminding
you of definitions and concepts.
What will we cover today?
Today we will complete:
Hurdle Quiz 1 opening a data file and editing
data in Excel how to save the work you have
completed using Excel cutting and pasting from
Excel to Word
If you are not familiar with Excel at all there are many, many sites and YouTube videos that
can help you. Type something like ‘Excel beginners’ in a browser then select from the
options available.
1 | Stat1250 Week 2 Practical: Introduction to Excel © Copyright Macquarie University 2021
tabler-icon-diamond-filled.svg

Secure Best Marks with AI Grader

Need help grading? Try our AI Grader for instant feedback on your assignments.
Document Page
Recommended textbooks have resources for Excel. For example recommended text book by
Black et al (published by Wiley) has how to videos that you might benefit from watching.
The recommended textbook 3 comes with a key to MyStatLab. If you log into MyStatLab,
you can view a video in the Week 0 or Week 1 area on the basics of Excel 2013 and the
Excel data analysis add-in that you will need. The add-in will usually be available on Lab
computers already.
You need Excel with data analysis Tool to successfully complete
STAT1250 (see iLearn for how to obtain a free copy for your
computer/laptop from MQ).
Remember: If you have difficulty with any parts of the Practicals
ask your practical demonstrator for help during your class.
Opening Excel
Practicals can be completed on a lab computer or on your own computer/laptop, but not on
tablets such as iPad, and certainly not on your smart phone.
After you have logged onto the lab computer, find Excel and open it.
Excel should appear with a blank worksheet as in the picture below.
Excel stores data in columns labelled A,B,C, ........... and in rows numbered 1,2,3,……
Data are stored in cells that are referenced by their column label and row number. For
example, the cell that is located in column C and in row 9 is referred to as cell C9.
2 | Stat1250 Week 2 Practical: Introduction to Excel © Copyright Macquarie University 2021
Document Page
The Excel menus
At the top of an Excel spreadsheet are menus including
Home – which is generally used to format cells
Insert – which is used, for example, to add charts
Formulas – which is used to add appropriate formulas to the worksheet and so on.
Some of these menus will be used in later Practicals. You are expected to be able to use Excel
with data analysis and to be able to do your own analysis and interpret the Excel output that
is presented in lectures, in the class tests and in the final examination.
Excel as a calculator
Excel most basic use is as a calculator. For example in cell A1 type =123*456 and then
press enter. The “=” specifies that we are using a function in this cell that we want an answer
for.
Did you get 56088? yes
Excel can be used to add/subtract/multiply/divide (and many other functions) two or more
columns together. Type the data in the image below into the same columns of your
spreadsheet.
3 | Stat1250 Week 2 Practical: Introduction to Excel © Copyright Macquarie University 2021
Document Page
In cell C1 type =SUM(A1:B1). The SUM(A1:B1)
command says add the cells specified (A1 and B1)
together.
Now we want to use the same function for cells C2 to
C10. The easiest way to do this is to click in cell C1. At
the bottom right hand corner of the cell you can see a
little square. Hover over that square until the Excel curser
becomes a thin +, using the left hand mouse button click
and hold on the + and drag the curser down to C10. The
formula should copy to cells C2 through C10 and give
you the remaining row sums.
Ask your demonstrator if you have any problems during your class
time! You can also watch the pre-recorded Practical Video if you
missed your class and submit your solution(s).
Now we are going to import some data into Excel.
Open an internet browser such as Google Chrome and log into iLearn (ilearn.mq.edu.au).
Scroll down to the Data Sets section and you will see the names of the data sets that we
will use this semester. Excel data files have the extension .xlsx or .xls.
Double click on Rollercoaster.xlsx to download the file. Using Google Chrome, a link
to the data file should appear in the lower left hand side of the browser window.
The variables in the Rollercoaster worksheet are described below.
4 | Stat1250 Week 2 Practical: Introduction to Excel © Copyright Macquarie University 2021
Download the data from iLearn
Opening an Excel data
fileTo open the file you can either
Click on the link at the bottom of the Chrome webpage to open the fileO
RSave the file to a directory, go to that directory and double click on the file nameO
RHaving saved the file to a directory, from within Excel go to the menus at the top of
the screen and clickFile >
Open
. Then navigate to the file location in the window that
pops up, click on the file name and it will open.
The Rollercoaster data
tabler-icon-diamond-filled.svg

Secure Best Marks with AI Grader

Need help grading? Try our AI Grader for instant feedback on your assignments.
Document Page
Variable Name Description
Name The name of the rollercoaster
Country Location of the rollercoaster
Year Year of installation/opening of ride
Height Height in metres from tallest point to the ground
Length Length in metres of rollercoaster track
Speed Maximum speed in kilometres per hour
Inversions How many times a rider turns upside-down
Inversions-cat None = 0 inversions, Few = 1 – 6 inversions, Lots = at least 7
inversions
Type Type of rollercoaster (shuttle, steel or wood)
Source: Adapted from http://www.ultimaterollercoaster.com/coasters/records/ and rcdb.com.
Examine the data in the spreadsheet and answer the following questions:
Question Answer
Which column of the rollercoaster worksheet contains
the Height data?
Column C
Which country does the rollercoaster “Dragon Khan”
come from?
Spain
What is the name and the location of the fastest
rollercoaster?
Formula Rossa, Dubai
When was the Tower of Terror opened? 1997
Would you like to go on the Tower of Terror? (Watch
http://www.youtube.com/watch?v=vsDnBIn1ouk)
No
Summarising and displaying data
It can be useful to read information about individual rollercoasters, but what we really want
to do is to summarise and display the data. Let’s begin by classifying the variables in
the rollercoaster data set.
Variable Variable Classification (circle the
correct answer)
Name numerical | categorical | none of these
Country numerical | categorical | none of these
5 | Stat1250 Week 2 Practical: Introduction to Excel © Copyright Macquarie University 2021
Document Page
Height numerical | categorical | none of these
Length numerical | categorical | none of these
Speed numerical | categorical | none of these
Inversions numerical | categorical | none of these
Inversions_
cat
numerical | categorical | none of these
Type numerical | categorical | none of these
The reason it is important to classify variables is because we do different things with different types of
variables. For example to display:
categorical variables we would draw bar charts or pie charts
numerical variables we would draw histograms or
to compare a numerical variable between groups of a categorical variable,
boxplots would be used.
We will see how to create these plots next week.
Excel Formulas
Excel is useful for quickly summarising data by typing the appropriate commands or
formulas.
For example, suppose we were interested in knowing how many rollercoasters were in Japan.
This worksheet is small so it’s easy to count how many yourself – but imagine if there were
10,000 rows of data. We don’t want to have to count by hand so we go to the cell below the
last observation (i.e. B36) and type =COUNTIF(B2:B35, “Japan”) then press enter.
The COUNTIF command says – look at cells B2 to B35 and count the cell only if the cell
says “Japan”. You can see that there are 8 rollercoasters from Japan in this set of data.
Try it yourself. Did you get 8? Yes
Now double click in that cell to edit the command and change “Japan” to be “UK”. How
many rollercoasters were in the UK? 3
Now try using the COUNTIF command in the Type column to determine how many of the
rollercoasters were Steel. Answer: 28
Now suppose we were interested in the mean height of the tallest part of the rollercoasters. In
cell C36 type =AVERAGE(C2:C35). Note that rather than typing C2:C35 you can select
the column of cells of interest by clicking into cell C2, holding down the left mouse button
down and selecting all of the cells that you are interested in. What is the average height of the
sample of rollercoasters? 51.00946
Use the AVERAGE command again in cell G36 to determine the average speed of the
rollercoasters. Answer 111.239
6 | Stat1250 Week 2 Practical: Introduction to Excel © Copyright Macquarie University 2021
chevron_up_icon
1 out of 6
circle_padding
hide_on_mobile
zoom_out_icon
logo.png

Your All-in-One AI-Powered Toolkit for Academic Success.

Available 24*7 on WhatsApp / Email

[object Object]