STAT6000: Statistics for Public Health - Research Article Review
VerifiedAdded on 2023/05/31
|14
|2518
|377
Homework Assignment
AI Summary
This assignment provides a detailed analysis of two research articles, focusing on statistical methods used in public health. The first paper examines alcohol and drug use among school leavers, covering hypothesis formulation, sampling methods, demographic characteristics, inferential statistics, and odds ratios. The second paper investigates the prevalence of self-reported diabetes in Hong Kong, analyzing demographic characteristics, inferential statistics, age-adjusted prevalence rates, and odds ratios for diabetes diagnosis. The assignment also addresses the limitations of the studies and their impact on the reliability of the results. Desklib offers a wealth of similar solved assignments and study resources for students.
Statistics Paper
Statistics Paper
Student’s Name
Institution Affiliation
Statistics Paper
Student’s Name
Institution Affiliation
Paraphrase This Document
Need a fresh take? Get an instant paraphrase of this document with our AI Paraphraser
Statistics Paper
Paper 1
Lam et. al. (2014) research article
Question One: stating the hypotheses and Describing their Independent and dependent variables
1. Has consumption of alcohol at school leavers’ celebration changed from last social
event?
a. Null hypothesis
The use of alcohol at leaver’s celebration has not changed compared to last social event.
b. Alternative hypothesis
The use of Alcohol at leaver’s celebration has increase from last social event.
Variables:
Independent
These are predictor variables that are manipulated in an experiment or study to predict / observe
the behaviors or effects of dependent variable. From the Lam et. al. (2014) research article,
variable for the hypotheses are listed below:
Use of alcohol among males
Use of alcohol among Females
Males’ Average School leavers’ event day
Female’ Average School leavers’ event day
Statistics Paper
Dependent
These are outcome variables, that are rely on the value of the independent variables. From the
Lam et. al. (2014) research article, variable for the hypotheses are listed below:
Allover use of Alcohol
Average School leavers’ event day
2. Has the use of other drugs like amphetamine, caffeine, cannabis and ecstasy changed
in school leavers’ celebration
a. Null hypothesis
There’s no significant change in the use of other drugs apart from alcohol in leaver’s
celebration
b. Alternative hypothesis
Is there significant change in the use of other drugs apart from alcohol in leaver’s
celebration?
Variables:
Independent
These are predictor variables that are manipulated in an experiment or study to predict / observe
the behaviors or effects of dependent variable. From the Lam et. al. (2014) research article,
variable for the hypotheses are listed below:
Use of other drugs other than alcohol among males
Use of other drugs other than alcohol among females
⊘ This is a preview!⊘
Do you want full access?
Subscribe today to unlock all pages.
Trusted by 1+ million students worldwide
Statistics Paper
Use of drugs in leavers’ day 1, day 2, day3
Dependent
These are outcome variables, that are rely on the value of the independent variables. From the
Lam et. al. (2014) research article, variable for the hypotheses are listed below:
Use of other drugs in school other than alcohol leavers’ celebration
Average daily use of other drugs
Question Two: Sampling method used in Lam et. al. (2014) research article, its
advantages and Disadvantages
The sampling method used in this research is stratified sampling. The sample was drawn from
a population that contained two strata, female and male, 56% and 44% respectively of the
sample.
Advantages of stratified sampling
Stratified sample gives more prominent exactness compared to simple random sample
of the similar
Due to fact that it provide precision, a stratified sample requires smaller sample,
which saves research budget.
Can ensure that specific groups are represented, even proportionally, in the sample for
instance by gender, by selecting individuals from strata list
With this sample, one is bale to ensure that he/she obtain sufficient sample points
to support a separate analysis of subgroup in the sample.
Paraphrase This Document
Need a fresh take? Get an instant paraphrase of this document with our AI Paraphraser
Statistics Paper
Disadvantages of stratified sampling
Comparing it to a simple random sample, stratified sampling requires more
administrative effort than simple random sample.
Most of the analyses are computational more than in a simple random sample.
Question Three: Demographic characteristics of the people in the sample
Most of the persons are young of aged 17 years and the others are 18 years olds
The sample is 56% female and 44% male.
The samples comprised of persons leaving the school or have left the school some time
back and have participated in leavers celebration.
Question Four: inferential statistics that were used and the reason for their use
Inferential statistics used in the study are:
Spring break estimation of Average alcohol dinks taken daily; 18 drinks and 10 drinks for male
and female respectively
Estimates of alcohol use in Victoria Queensland, 69 and 76% consume 5 drinks or more on a
typical school day.
Inferential statistics are meant to compare with the results of the study to determine their
statistical significance and reliability. They also help to determine whether the results are in line
with reports and results of the recently done studies.
Statistics Paper
Question Five: Odd ratio for engaging in unprotected sex
The odds ratio for engaging in unprotected sex is 10. 92 and its confidence interval are (1.14,
104.25). This shows that there’s a significant association between engaging in unprotected sex
and safety strategy. This also implies that those who safety strategy was 10.92 times more likely
to engage in unprotected sex.
Question Six: how representative sample is?
The Sample is representative as it has taken into use of alcohol and other drugs across gender
from different national school in Australia. Results of the study concur with the results of the
past studies, that there’s increased use of alcohol and other drugs in leavers’ celebrations.
⊘ This is a preview!⊘
Do you want full access?
Subscribe today to unlock all pages.
Trusted by 1+ million students worldwide
Statistics Paper
Paper 2
Read the Wong et. al. (2014)
Question one: Aim of the study
The study aims at evaluating the prevalence of self-reported diabetes and examine factors that
are independent associated with diabetes.
Question two: Demographic Characteristics of the people in the sample?
The sample composed of adults aged between 15 years and above
The average age of persons was 38.2 years
Sample populous is heterogeneous, it comprises of males and female adults from Hong
Kong population
Averagely, most people are higher income earned due to their advanced age
Question Three: Inferential statistics used to analyze data in this study
Inferential statistics used in this study are
The result of Chinese study of 2001 by the International Collaborative Study of Cardiovascular
Disease in Asia They reported diabetes prevalence rate of 1.3%.
This was meant to determine whether the study conducted in Hong Kong are significantly
differently from what has already been revealed the recent study. This also helps in
understanding the reliability of the study results.
Paraphrase This Document
Need a fresh take? Get an instant paraphrase of this document with our AI Paraphraser
Statistics Paper
Question Four: findings of the Researchers when they adjusted the prevalence rates of
diabetes for age
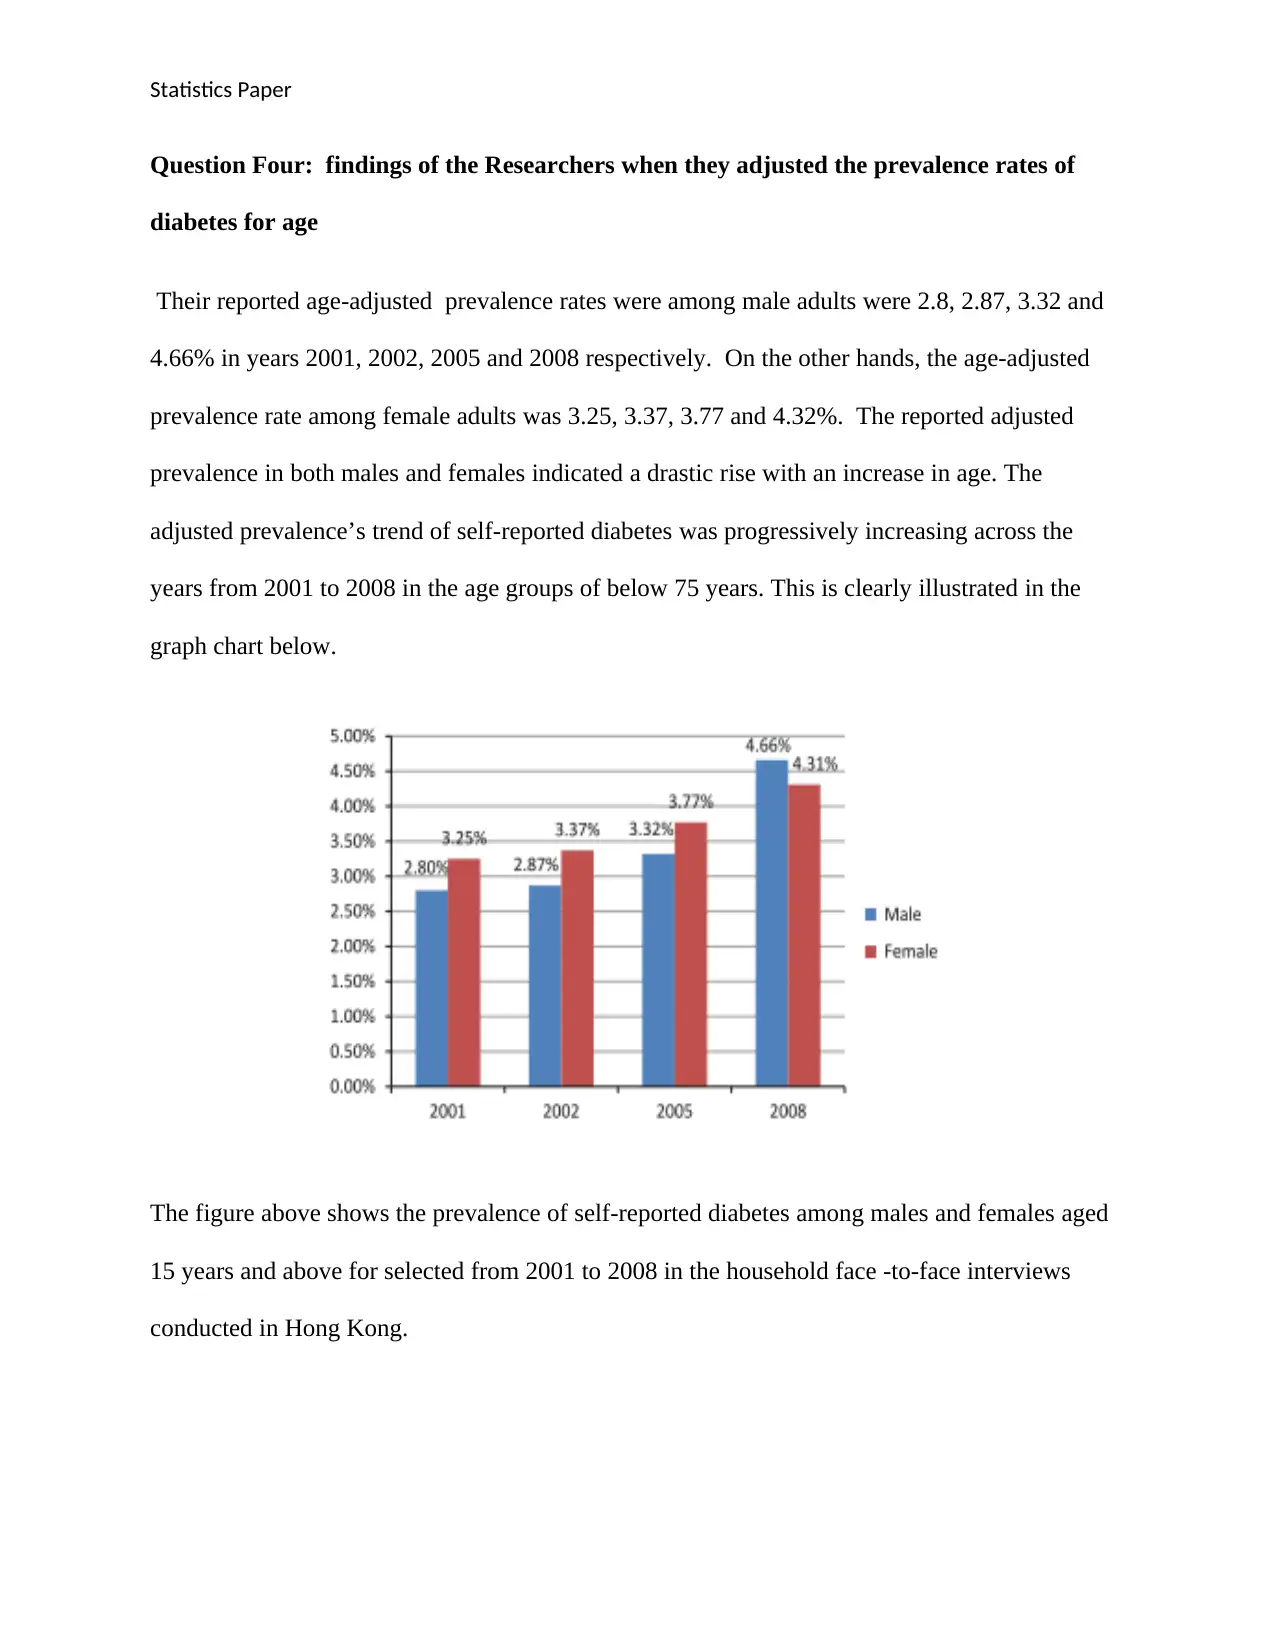
Their reported age-adjusted prevalence rates were among male adults were 2.8, 2.87, 3.32 and
4.66% in years 2001, 2002, 2005 and 2008 respectively. On the other hands, the age-adjusted
prevalence rate among female adults was 3.25, 3.37, 3.77 and 4.32%. The reported adjusted
prevalence in both males and females indicated a drastic rise with an increase in age. The
adjusted prevalence’s trend of self-reported diabetes was progressively increasing across the
years from 2001 to 2008 in the age groups of below 75 years. This is clearly illustrated in the
graph chart below.
The figure above shows the prevalence of self-reported diabetes among males and females aged
15 years and above for selected from 2001 to 2008 in the household face -to-face interviews
conducted in Hong Kong.
Question Four: findings of the Researchers when they adjusted the prevalence rates of
diabetes for age
Their reported age-adjusted prevalence rates were among male adults were 2.8, 2.87, 3.32 and
4.66% in years 2001, 2002, 2005 and 2008 respectively. On the other hands, the age-adjusted
prevalence rate among female adults was 3.25, 3.37, 3.77 and 4.32%. The reported adjusted
prevalence in both males and females indicated a drastic rise with an increase in age. The
adjusted prevalence’s trend of self-reported diabetes was progressively increasing across the
years from 2001 to 2008 in the age groups of below 75 years. This is clearly illustrated in the
graph chart below.
The figure above shows the prevalence of self-reported diabetes among males and females aged
15 years and above for selected from 2001 to 2008 in the household face -to-face interviews
conducted in Hong Kong.
Statistics Paper
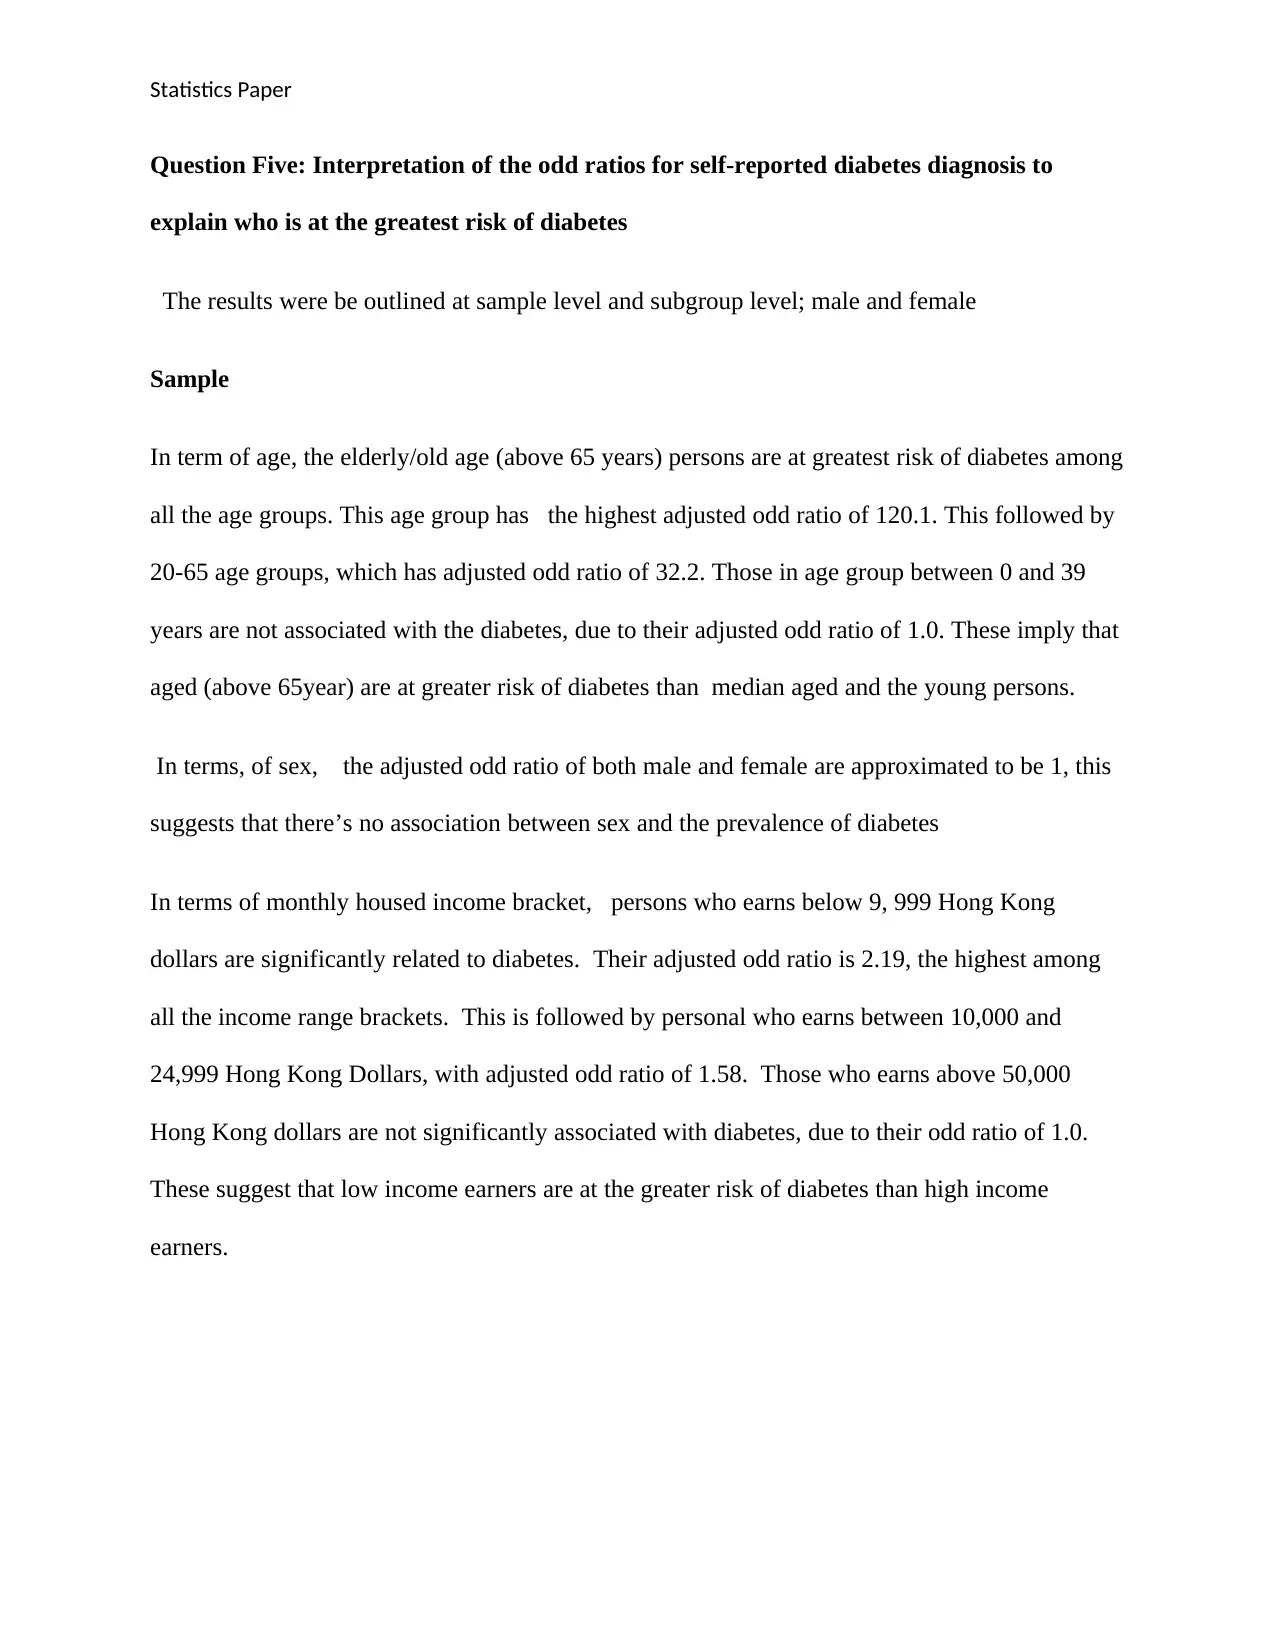
Question Five: Interpretation of the odd ratios for self-reported diabetes diagnosis to
explain who is at the greatest risk of diabetes
The results were be outlined at sample level and subgroup level; male and female
Sample
In term of age, the elderly/old age (above 65 years) persons are at greatest risk of diabetes among
all the age groups. This age group has the highest adjusted odd ratio of 120.1. This followed by
20-65 age groups, which has adjusted odd ratio of 32.2. Those in age group between 0 and 39
years are not associated with the diabetes, due to their adjusted odd ratio of 1.0. These imply that
aged (above 65year) are at greater risk of diabetes than median aged and the young persons.
In terms, of sex, the adjusted odd ratio of both male and female are approximated to be 1, this
suggests that there’s no association between sex and the prevalence of diabetes
In terms of monthly housed income bracket, persons who earns below 9, 999 Hong Kong
dollars are significantly related to diabetes. Their adjusted odd ratio is 2.19, the highest among
all the income range brackets. This is followed by personal who earns between 10,000 and
24,999 Hong Kong Dollars, with adjusted odd ratio of 1.58. Those who earns above 50,000
Hong Kong dollars are not significantly associated with diabetes, due to their odd ratio of 1.0.
These suggest that low income earners are at the greater risk of diabetes than high income
earners.
⊘ This is a preview!⊘
Do you want full access?
Subscribe today to unlock all pages.
Trusted by 1+ million students worldwide
Statistics Paper
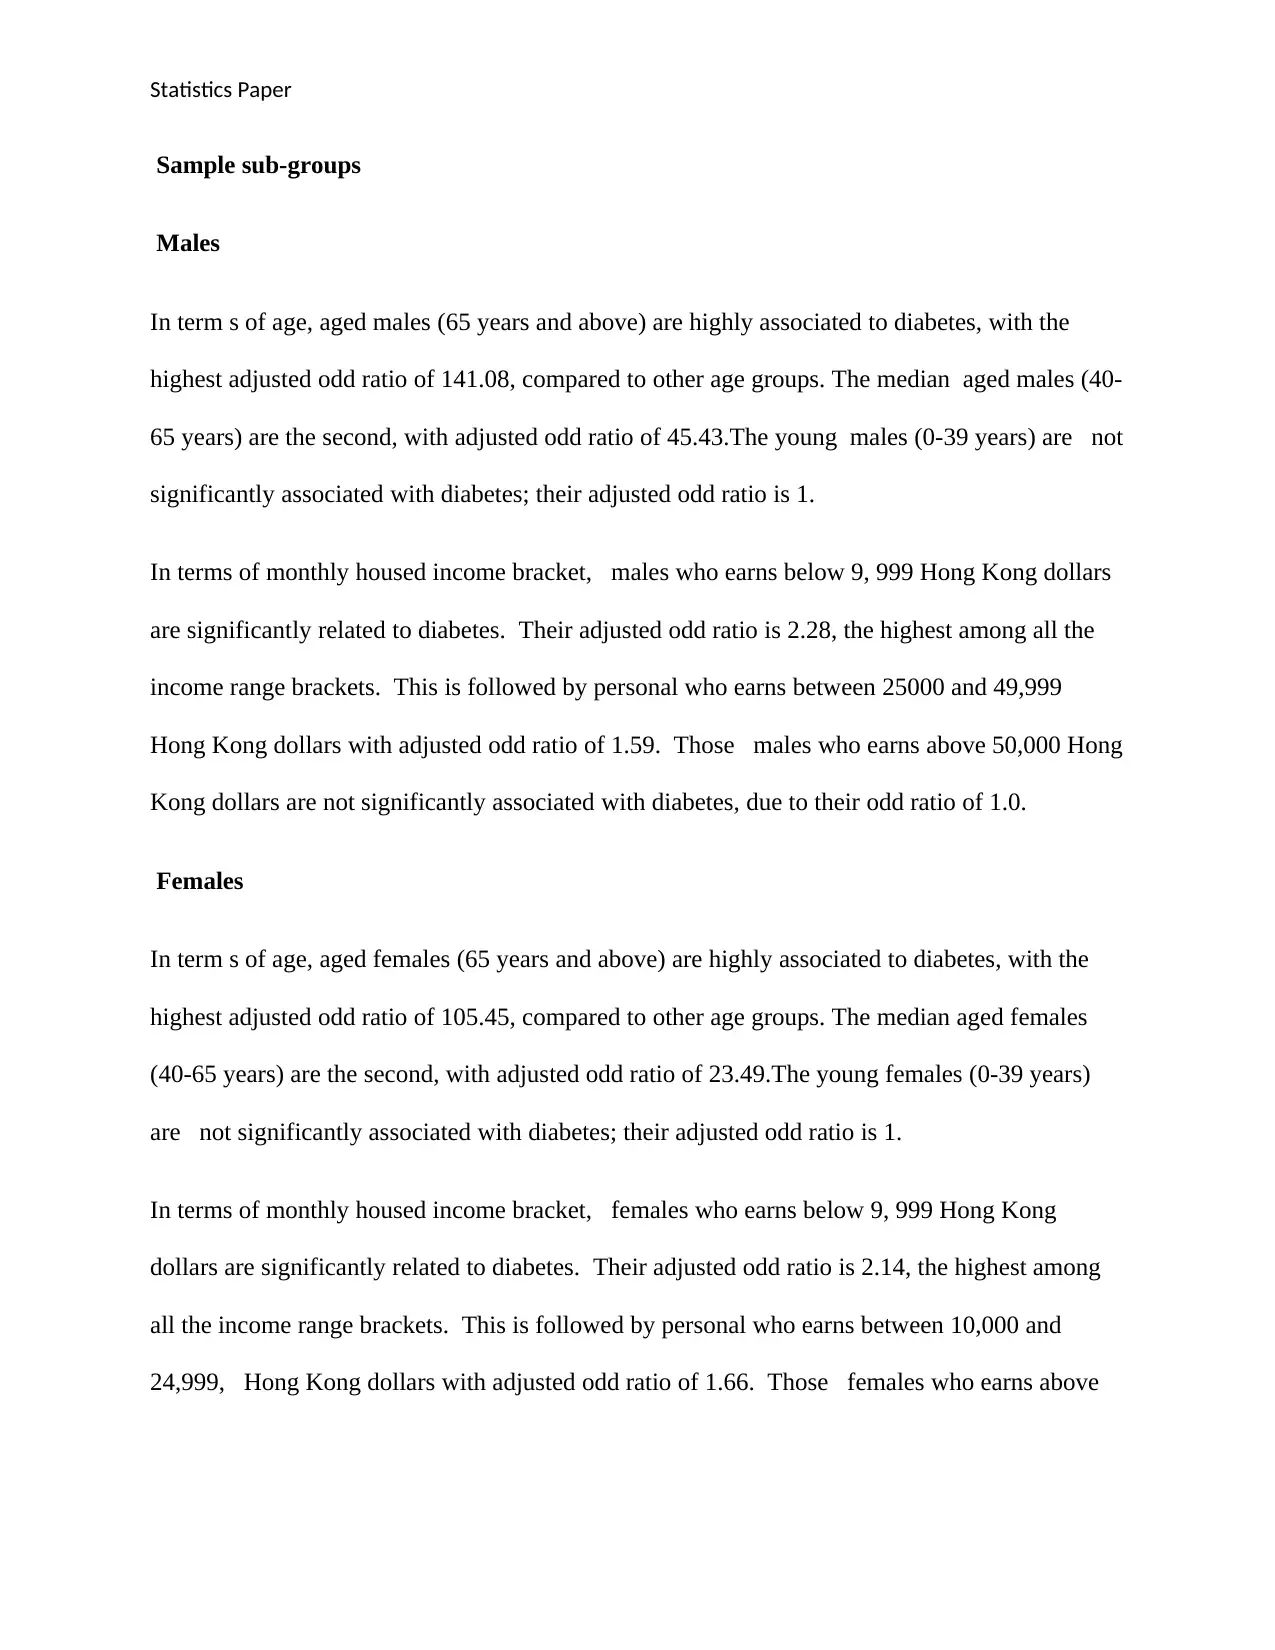
Sample sub-groups
Males
In term s of age, aged males (65 years and above) are highly associated to diabetes, with the
highest adjusted odd ratio of 141.08, compared to other age groups. The median aged males (40-
65 years) are the second, with adjusted odd ratio of 45.43.The young males (0-39 years) are not
significantly associated with diabetes; their adjusted odd ratio is 1.
In terms of monthly housed income bracket, males who earns below 9, 999 Hong Kong dollars
are significantly related to diabetes. Their adjusted odd ratio is 2.28, the highest among all the
income range brackets. This is followed by personal who earns between 25000 and 49,999
Hong Kong dollars with adjusted odd ratio of 1.59. Those males who earns above 50,000 Hong
Kong dollars are not significantly associated with diabetes, due to their odd ratio of 1.0.
Females
In term s of age, aged females (65 years and above) are highly associated to diabetes, with the
highest adjusted odd ratio of 105.45, compared to other age groups. The median aged females
(40-65 years) are the second, with adjusted odd ratio of 23.49.The young females (0-39 years)
are not significantly associated with diabetes; their adjusted odd ratio is 1.
In terms of monthly housed income bracket, females who earns below 9, 999 Hong Kong
dollars are significantly related to diabetes. Their adjusted odd ratio is 2.14, the highest among
all the income range brackets. This is followed by personal who earns between 10,000 and
24,999, Hong Kong dollars with adjusted odd ratio of 1.66. Those females who earns above
Paraphrase This Document
Need a fresh take? Get an instant paraphrase of this document with our AI Paraphraser
Statistics Paper
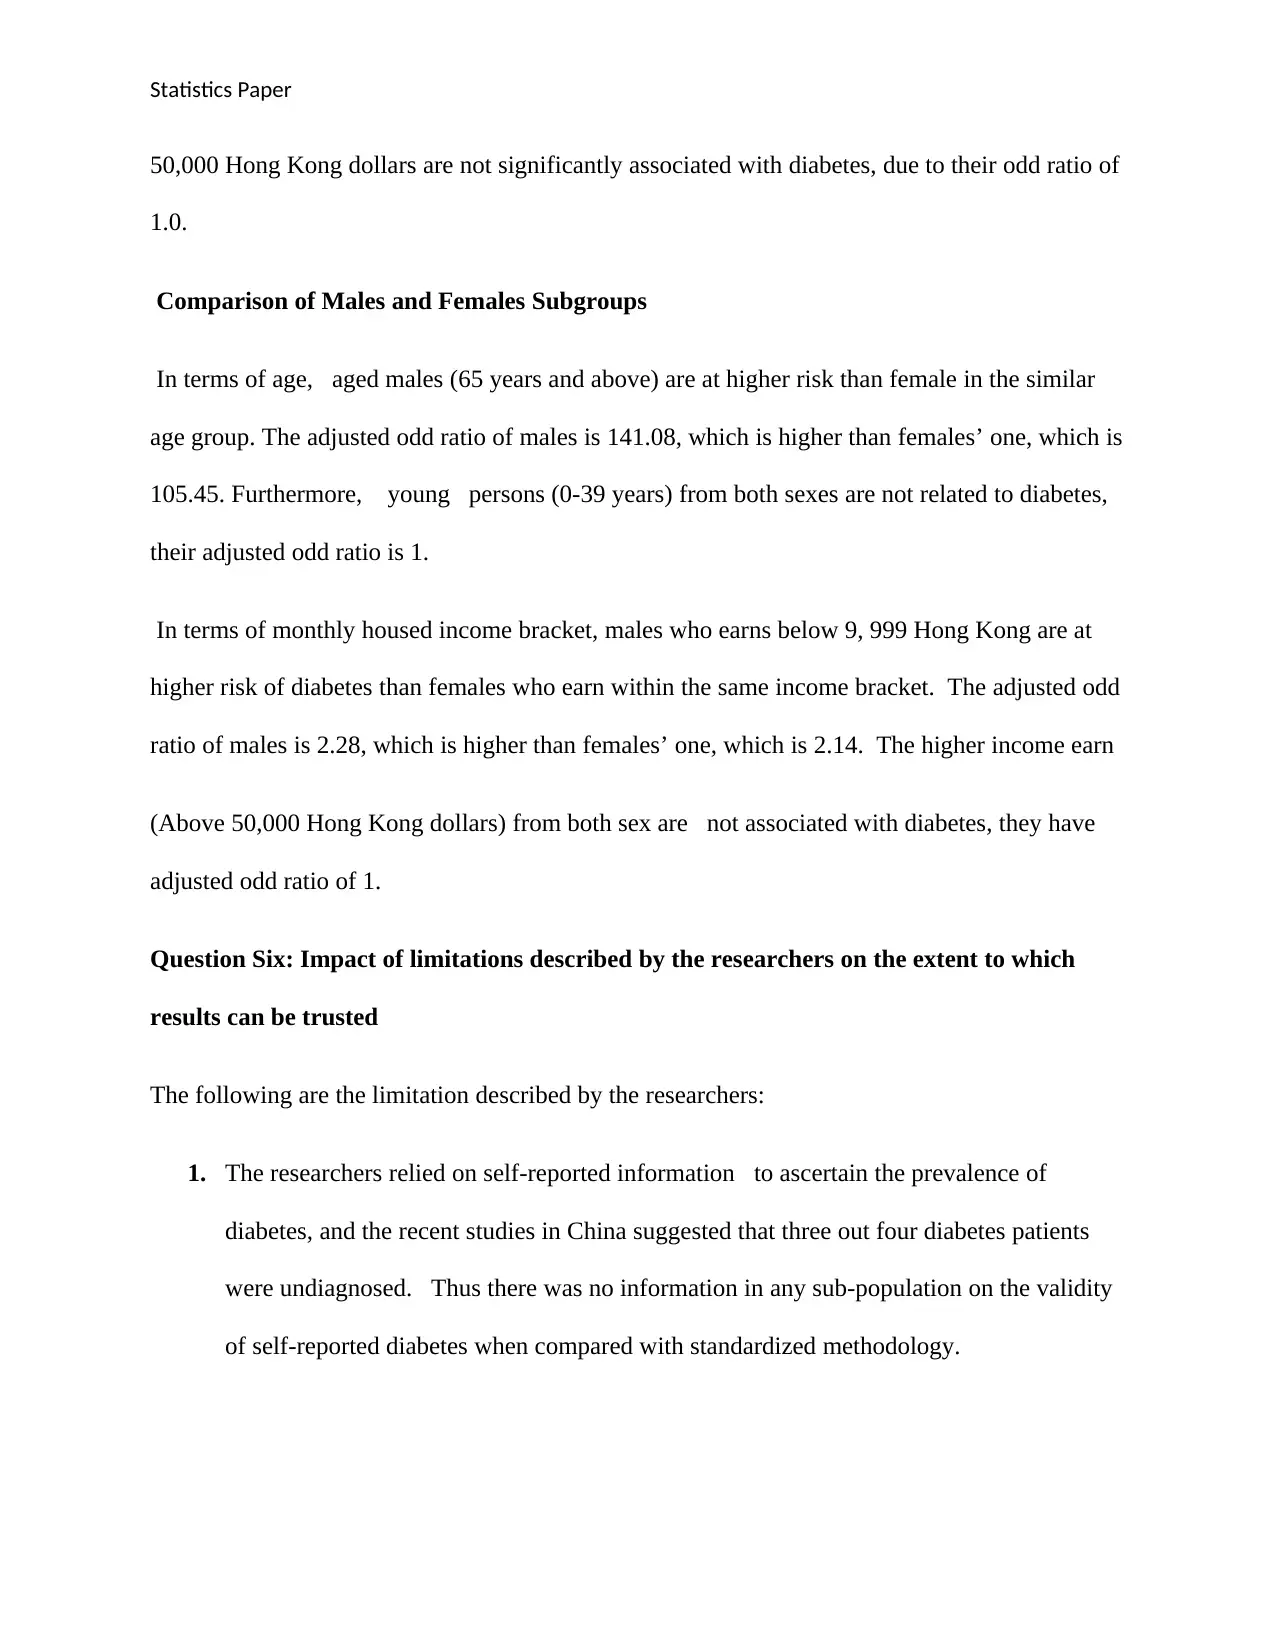
50,000 Hong Kong dollars are not significantly associated with diabetes, due to their odd ratio of
1.0.
Comparison of Males and Females Subgroups
In terms of age, aged males (65 years and above) are at higher risk than female in the similar
age group. The adjusted odd ratio of males is 141.08, which is higher than females’ one, which is
105.45. Furthermore, young persons (0-39 years) from both sexes are not related to diabetes,
their adjusted odd ratio is 1.
In terms of monthly housed income bracket, males who earns below 9, 999 Hong Kong are at
higher risk of diabetes than females who earn within the same income bracket. The adjusted odd
ratio of males is 2.28, which is higher than females’ one, which is 2.14. The higher income earn
(Above 50,000 Hong Kong dollars) from both sex are not associated with diabetes, they have
adjusted odd ratio of 1.
Question Six: Impact of limitations described by the researchers on the extent to which
results can be trusted
The following are the limitation described by the researchers:
1. The researchers relied on self-reported information to ascertain the prevalence of
diabetes, and the recent studies in China suggested that three out four diabetes patients
were undiagnosed. Thus there was no information in any sub-population on the validity
of self-reported diabetes when compared with standardized methodology.
Statistics Paper
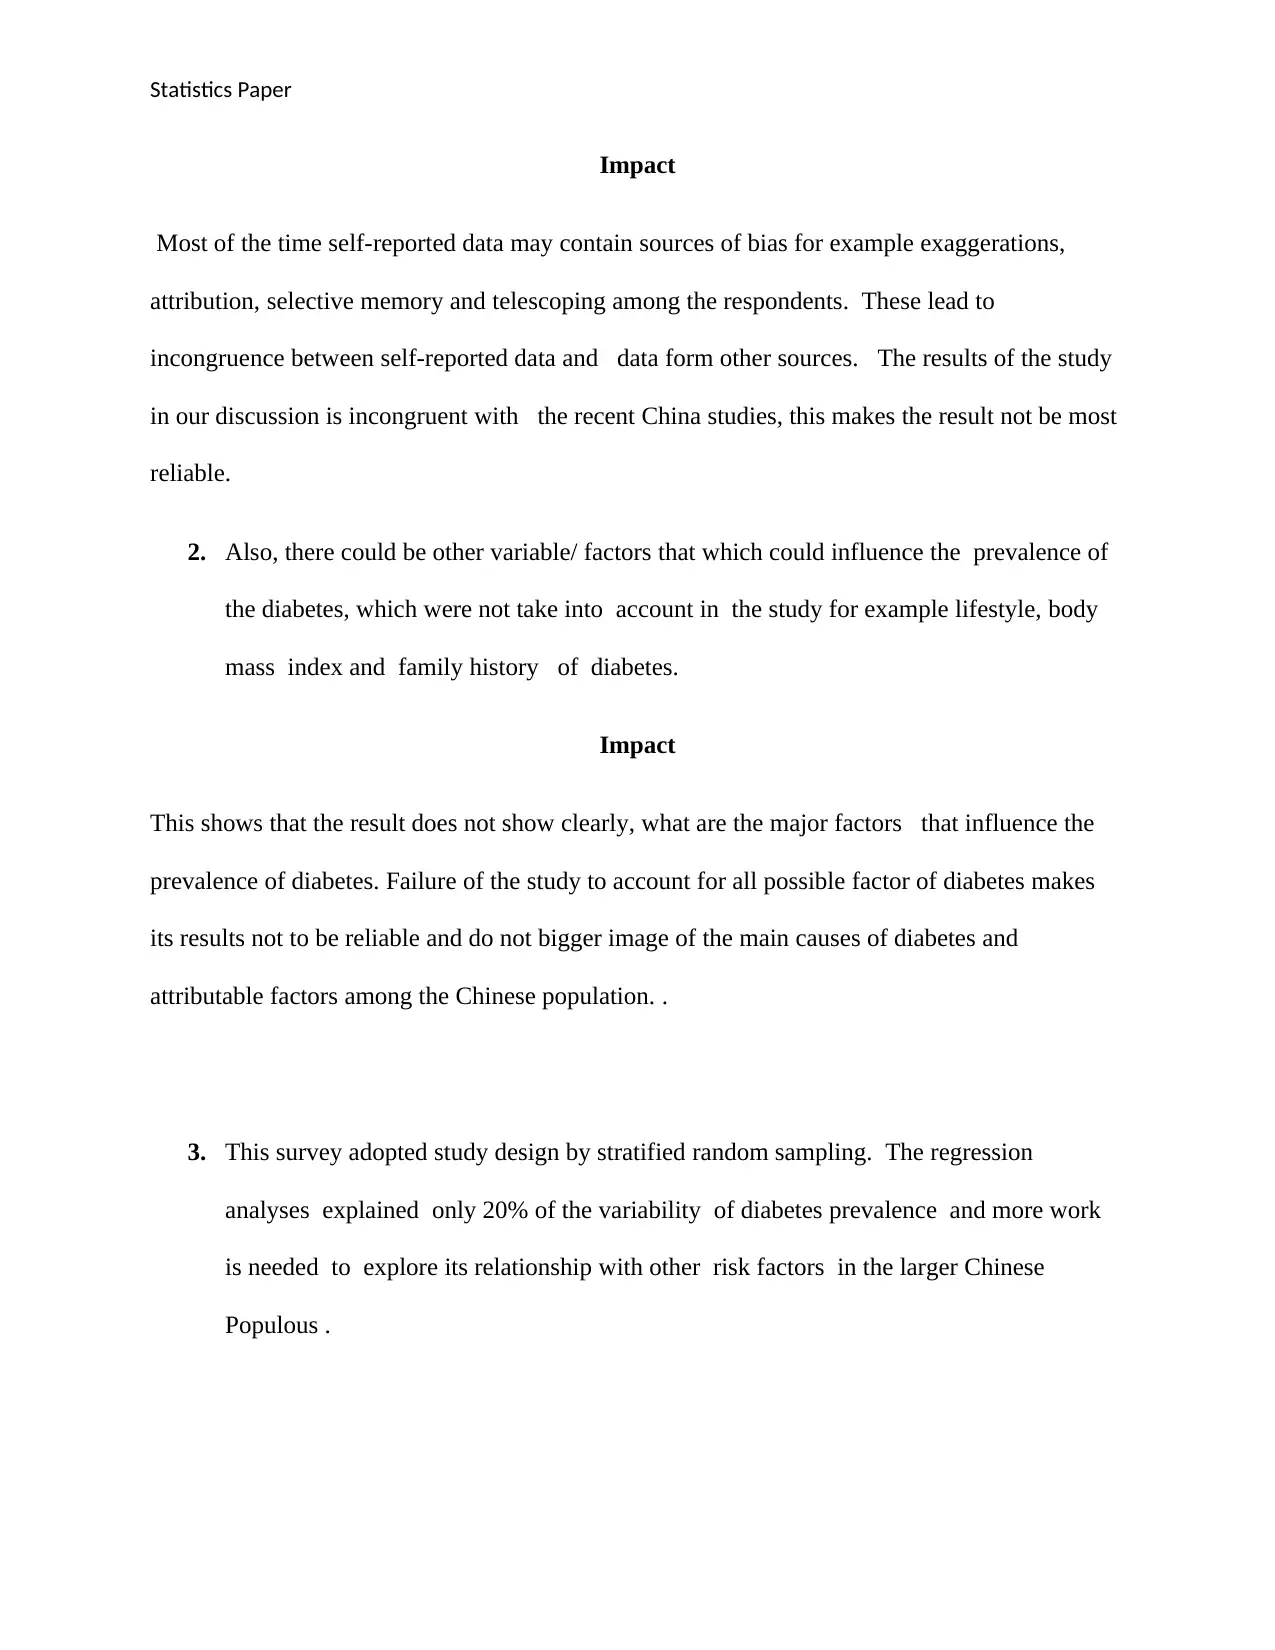
Impact
Most of the time self-reported data may contain sources of bias for example exaggerations,
attribution, selective memory and telescoping among the respondents. These lead to
incongruence between self-reported data and data form other sources. The results of the study
in our discussion is incongruent with the recent China studies, this makes the result not be most
reliable.
2. Also, there could be other variable/ factors that which could influence the prevalence of
the diabetes, which were not take into account in the study for example lifestyle, body
mass index and family history of diabetes.
Impact
This shows that the result does not show clearly, what are the major factors that influence the
prevalence of diabetes. Failure of the study to account for all possible factor of diabetes makes
its results not to be reliable and do not bigger image of the main causes of diabetes and
attributable factors among the Chinese population. .
3. This survey adopted study design by stratified random sampling. The regression
analyses explained only 20% of the variability of diabetes prevalence and more work
is needed to explore its relationship with other risk factors in the larger Chinese
Populous .
Impact
Most of the time self-reported data may contain sources of bias for example exaggerations,
attribution, selective memory and telescoping among the respondents. These lead to
incongruence between self-reported data and data form other sources. The results of the study
in our discussion is incongruent with the recent China studies, this makes the result not be most
reliable.
2. Also, there could be other variable/ factors that which could influence the prevalence of
the diabetes, which were not take into account in the study for example lifestyle, body
mass index and family history of diabetes.
Impact
This shows that the result does not show clearly, what are the major factors that influence the
prevalence of diabetes. Failure of the study to account for all possible factor of diabetes makes
its results not to be reliable and do not bigger image of the main causes of diabetes and
attributable factors among the Chinese population. .
3. This survey adopted study design by stratified random sampling. The regression
analyses explained only 20% of the variability of diabetes prevalence and more work
is needed to explore its relationship with other risk factors in the larger Chinese
Populous .
⊘ This is a preview!⊘
Do you want full access?
Subscribe today to unlock all pages.
Trusted by 1+ million students worldwide
1 out of 14
Related Documents


Your All-in-One AI-Powered Toolkit for Academic Success.
+13062052269
info@desklib.com
Available 24*7 on WhatsApp / Email
![[object Object]](/_next/static/media/star-bottom.7253800d.svg)
Unlock your academic potential
Copyright © 2020–2026 A2Z Services. All Rights Reserved. Developed and managed by ZUCOL.