Public Health Statistics Assignment Analysis: STAT6000 Report
VerifiedAdded on 2022/09/15
|11
|1488
|23
Homework Assignment
AI Summary
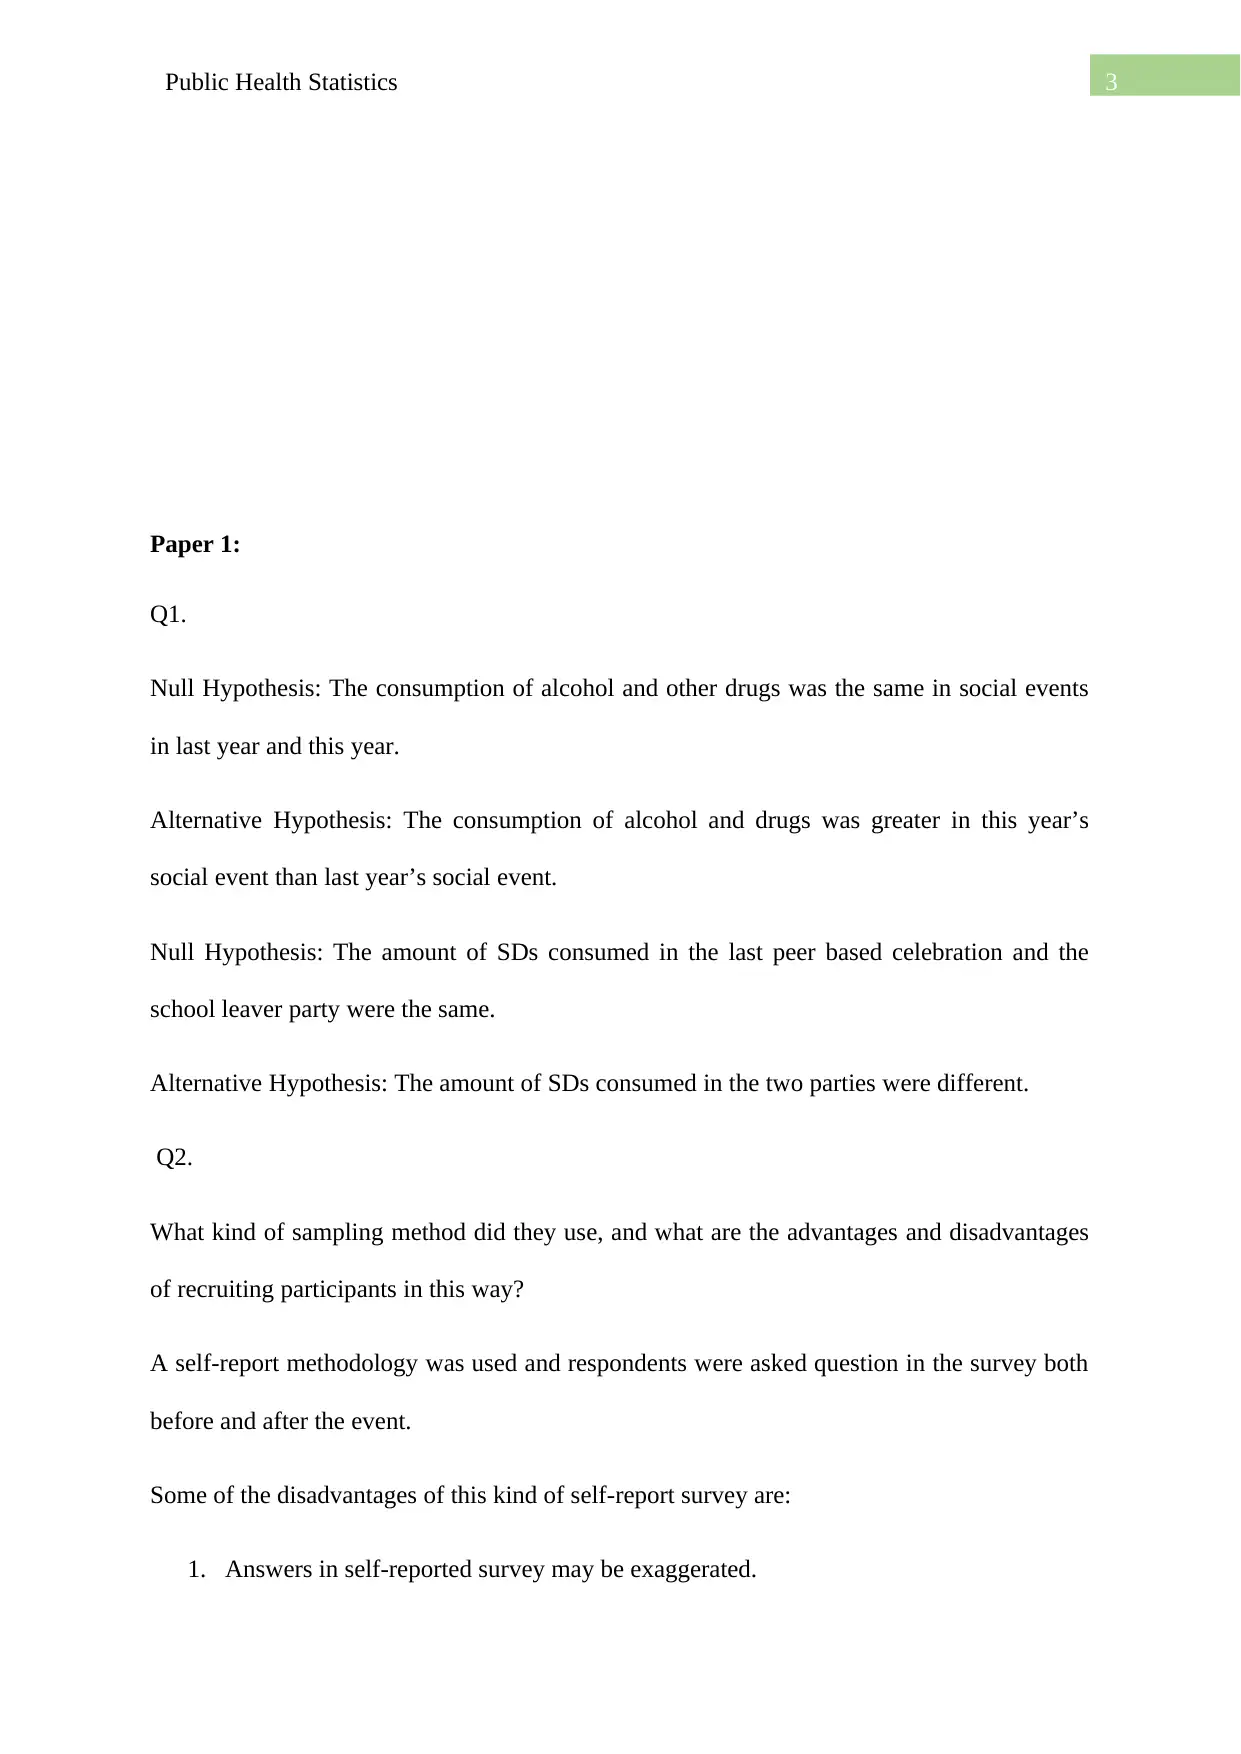
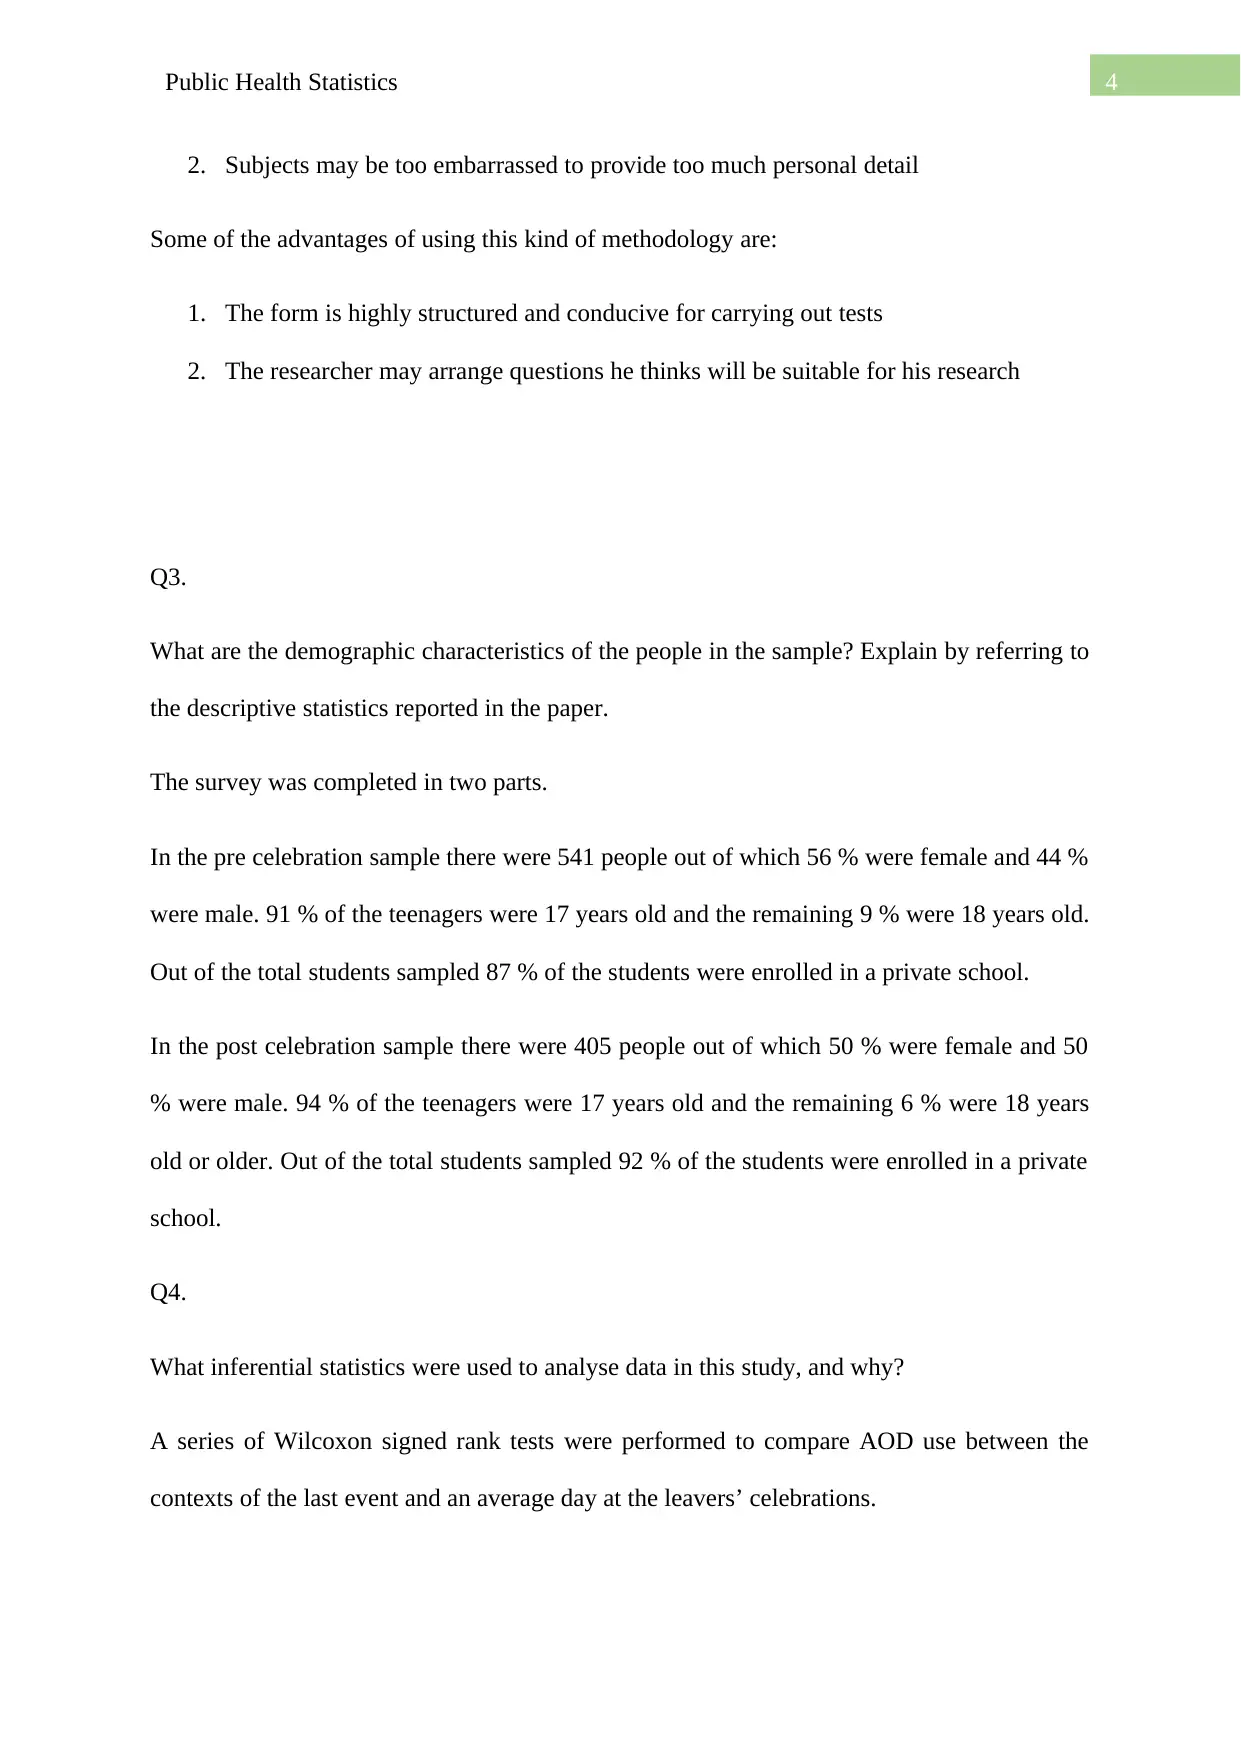
This assignment analyzes two research articles related to public health. The first article, examines alcohol and drug use at school leavers' celebrations, employing self-report surveys and statistical tests like the Wilcoxon signed rank test to compare substance use patterns. The study investigates demographic characteristics, sampling methods, and the odds ratio for unprotected sex, discussing the representativeness of the sample. The second article investigates the prevalence of self-reported diabetes mellitus in a Chinese population, utilizing household surveys and logistic regression analysis to evaluate factors associated with diabetes. The analysis covers demographic characteristics, inferential statistics, and the impact of age, sex, and income on diabetes prevalence, including the interpretation of odds ratios and the limitations of the study. The assignment addresses key statistical concepts, interpretation of results, and critical evaluation of research methodologies.

Running head: Public Health Statistics
Public Health Statistics
Name of the Student
Name of the University
Public Health Statistics
Name of the Student
Name of the University
Paraphrase This Document
Need a fresh take? Get an instant paraphrase of this document with our AI Paraphraser

2Public Health Statistics
Table of Contents
Paper 1:.......................................................................................................................................3
Paper 2........................................................................................................................................6
References:...............................................................................................................................10

3Public Health Statistics
Paper 1:
Q1.
Null Hypothesis: The consumption of alcohol and other drugs was the same in social events
in last year and this year.
Alternative Hypothesis: The consumption of alcohol and drugs was greater in this year’s
social event than last year’s social event.
Null Hypothesis: The amount of SDs consumed in the last peer based celebration and the
school leaver party were the same.
Alternative Hypothesis: The amount of SDs consumed in the two parties were different.
Q2.
What kind of sampling method did they use, and what are the advantages and disadvantages
of recruiting participants in this way?
A self-report methodology was used and respondents were asked question in the survey both
before and after the event.
Some of the disadvantages of this kind of self-report survey are:
1. Answers in self-reported survey may be exaggerated.
⊘ This is a preview!⊘
Do you want full access?
Subscribe today to unlock all pages.

Trusted by 1+ million students worldwide

4Public Health Statistics
2. Subjects may be too embarrassed to provide too much personal detail
Some of the advantages of using this kind of methodology are:
1. The form is highly structured and conducive for carrying out tests
2. The researcher may arrange questions he thinks will be suitable for his research
Q3.
What are the demographic characteristics of the people in the sample? Explain by referring to
the descriptive statistics reported in the paper.
The survey was completed in two parts.
In the pre celebration sample there were 541 people out of which 56 % were female and 44 %
were male. 91 % of the teenagers were 17 years old and the remaining 9 % were 18 years old.
Out of the total students sampled 87 % of the students were enrolled in a private school.
In the post celebration sample there were 405 people out of which 50 % were female and 50
% were male. 94 % of the teenagers were 17 years old and the remaining 6 % were 18 years
old or older. Out of the total students sampled 92 % of the students were enrolled in a private
school.
Q4.
What inferential statistics were used to analyse data in this study, and why?
A series of Wilcoxon signed rank tests were performed to compare AOD use between the
contexts of the last event and an average day at the leavers’ celebrations.
Paraphrase This Document
Need a fresh take? Get an instant paraphrase of this document with our AI Paraphraser

5Public Health Statistics
As the data collected had ratings on a likert scale and the other data collected had no
guarantee of being from a normal distribution, the non-parametric Wilcoxon signed test was
used to test the different hypothetical questions.
Q5.
What is the odds ratio for engaging in unprotected sex (compared with those who engaged in
safety strategies with the greatest frequency)? Interpret this by explaining what the odds ratio
is telling us, including any variables that were controlled for in the model.
Controlling for other factors in the model and comparing with a group that practiced safety
strategies with the highest frequency, it was found that the respondents were 10.92 times
more likely to have unprotected sex.
The variable that was controlled was the group that had the highest frequency in taking
precaution and odds ratio indicates that not taking safety strategies increases the chance of
having unprotected sex by 10.92 times.
Q6.
How representative do you think the sample is of the national population of schoolies?
Explain why.
The tests done may provide an estimate of the general picture of parties for high school
leavers but there are several limitations which must be considered to get where the estimates

6Public Health Statistics
might contain errors. Firstly self-reported surveys contains errors as it is vulnerable to the
whims of the respondent. Then recall effects might lead to the reports of past behaviour
incomplete. Lastly the study used a convenience sampling method and cannot be said to be
representative of the celebrations.
Paper 2.
Q1.
The aim of the study is to evaluate the extent of self -reported diabetes by region wise
household surveys representative of the whole hong-kong area and examine the main factors
associated with diabetes.
Q2.
What are the demographic characteristics of the people in the sample? Explain by referring to
the descriptive statistics reported in the paper?
A total of 121,895 people were sampled for the survey and out of them 103,367 were adults
with age higher than 15 year old.
Among the respondents, the age ranged between 15 to 75 with the following frequency:
Age
<15 18,528 15.2%
15-24 16,834 13.8%
25-34 17,751 14.6%
35-44 22,206 18.2%
45-54 20,033 16.4%
55-64 11,179 9.2%
⊘ This is a preview!⊘
Do you want full access?
Subscribe today to unlock all pages.

Trusted by 1+ million students worldwide

7Public Health Statistics
65-74 9,139 7.5%
>= 75 6,225 5.1%
49.8% (60,064) were females whereas 50.2 % (61,831) were males.
The population was also categorized by income:
HK Dollars
>=50k 12,452 10.43%
25,000-
49,999
32,748 27.42%
10,000-
24,999
50,648 42.41%
=< 9999 23,578 19.74%
Q3.
What inferential statistics were used to analyse data in this paper, and why?
Some of the inferential statistics used in the paper are mentioned below:
For testing the hypothesis that respondents age was higher in the recent survey than in the
previous years which was found to be true ( p value < 0.001 ).
For testing the hypothesis that the average monthly income had increased over the years
which was found to be true ( p value < 0.001 )
Q4.
What did the researchers find when they adjusted the prevalence rates of diabetes for age and
sex?
When adjusted for age, the prevalence of diabetes in male adults was 2.8, 2.87, 3.32 and 4.66
% in years 2001, 2002, 2005 and 2008 respectively. Among female adults, the prevalence
rate was 3.25, 3.37, 3.77 and 4.31 % respectively. In both sex groups it was seen that there
was a sharp rise in diabetes with increasing age. For age > 75 years there was a progressive
increase in self-reported diabetes for the years 2001 to 2008.
Paraphrase This Document
Need a fresh take? Get an instant paraphrase of this document with our AI Paraphraser

8Public Health Statistics
From logistic regression analysis using year 2001 as a reference controlling for age, the
relative rates of increase in prevalence were lower in female adults ( 69.3 % ) than the male
counterparts (47.9%).
Also age and sex adjusted, the prevalence increased sharply in the two low income groups
among both the male and female respondents.
5.
Interpret the odds ratios for self-reported diabetes diagnosis to explain who is at the greatest
risk of diabetes.
When adjusted for odds ratio, the following statistic were found:
AGE
Older age [adjusted odds ratio (AOR) 32.2, 95% CI 20.6–50.4, p < 0.001 for 40–65 years;
AOR 120.1, 95% CI 76.6–188.3, p < 0.001 for older than 65 years

9Public Health Statistics
INCOME
Lower income (AOR 2.19, 95% CI 1.66–2.88,
P <0.001 for monthly household income < HK$9,999 or
US$1,287)
Both of the parameters were significantly associated with increase in diabetes.
However it was found that sex of the respondent had no association with the prevalence of
diabetes.
6.
What impact do the limitations described by the researchers have on the extent to which the
results can be trusted, and why?
Some of the strengths of the study are
1. Extensive data collection
2. Standardized method used with the proper interviewer training
3. Keeping the method same over the years with few changes
4. The population based random sampling done makes generalization possible.
5. Adjustments made keeping in mind the demographic change over the years made
results more accurate
Some of the limitations of the study are:
1. Self-reported survey collection may contain errors
2. Not enough testing done may lead to not considering all the cases
3. Not all factors resulting in diabetes were taken into account in the study
⊘ This is a preview!⊘
Do you want full access?
Subscribe today to unlock all pages.

Trusted by 1+ million students worldwide

10Public Health Statistics
4. Stratified random sampling naturally contains error when generalized to the whole
population
5. Regression analysis done has yet to explore the relationship of other risk factors with
diabetes.
References:
Chan, Y. H. (2003). Biostatistics 102: quantitative data–parametric & non-parametric tests.
Blood Press, 140(24.08), 79.
Hoskin, T. (2012). Parametric and nonparametric: Demystifying the terms. In Mayo Clinic
(pp. 1-5).
Paraphrase This Document
Need a fresh take? Get an instant paraphrase of this document with our AI Paraphraser

11Public Health Statistics
1 out of 11
Related Documents

Your All-in-One AI-Powered Toolkit for Academic Success.
+13062052269
info@desklib.com
Available 24*7 on WhatsApp / Email
Unlock your academic potential
Copyright © 2020–2025 A2Z Services. All Rights Reserved. Developed and managed by ZUCOL.