Assessment 1: Survey Design for Community Health - STAT6000

Verified

Added on  2022/08/22

|5
|738
|33
Homework Assignment
AI Summary
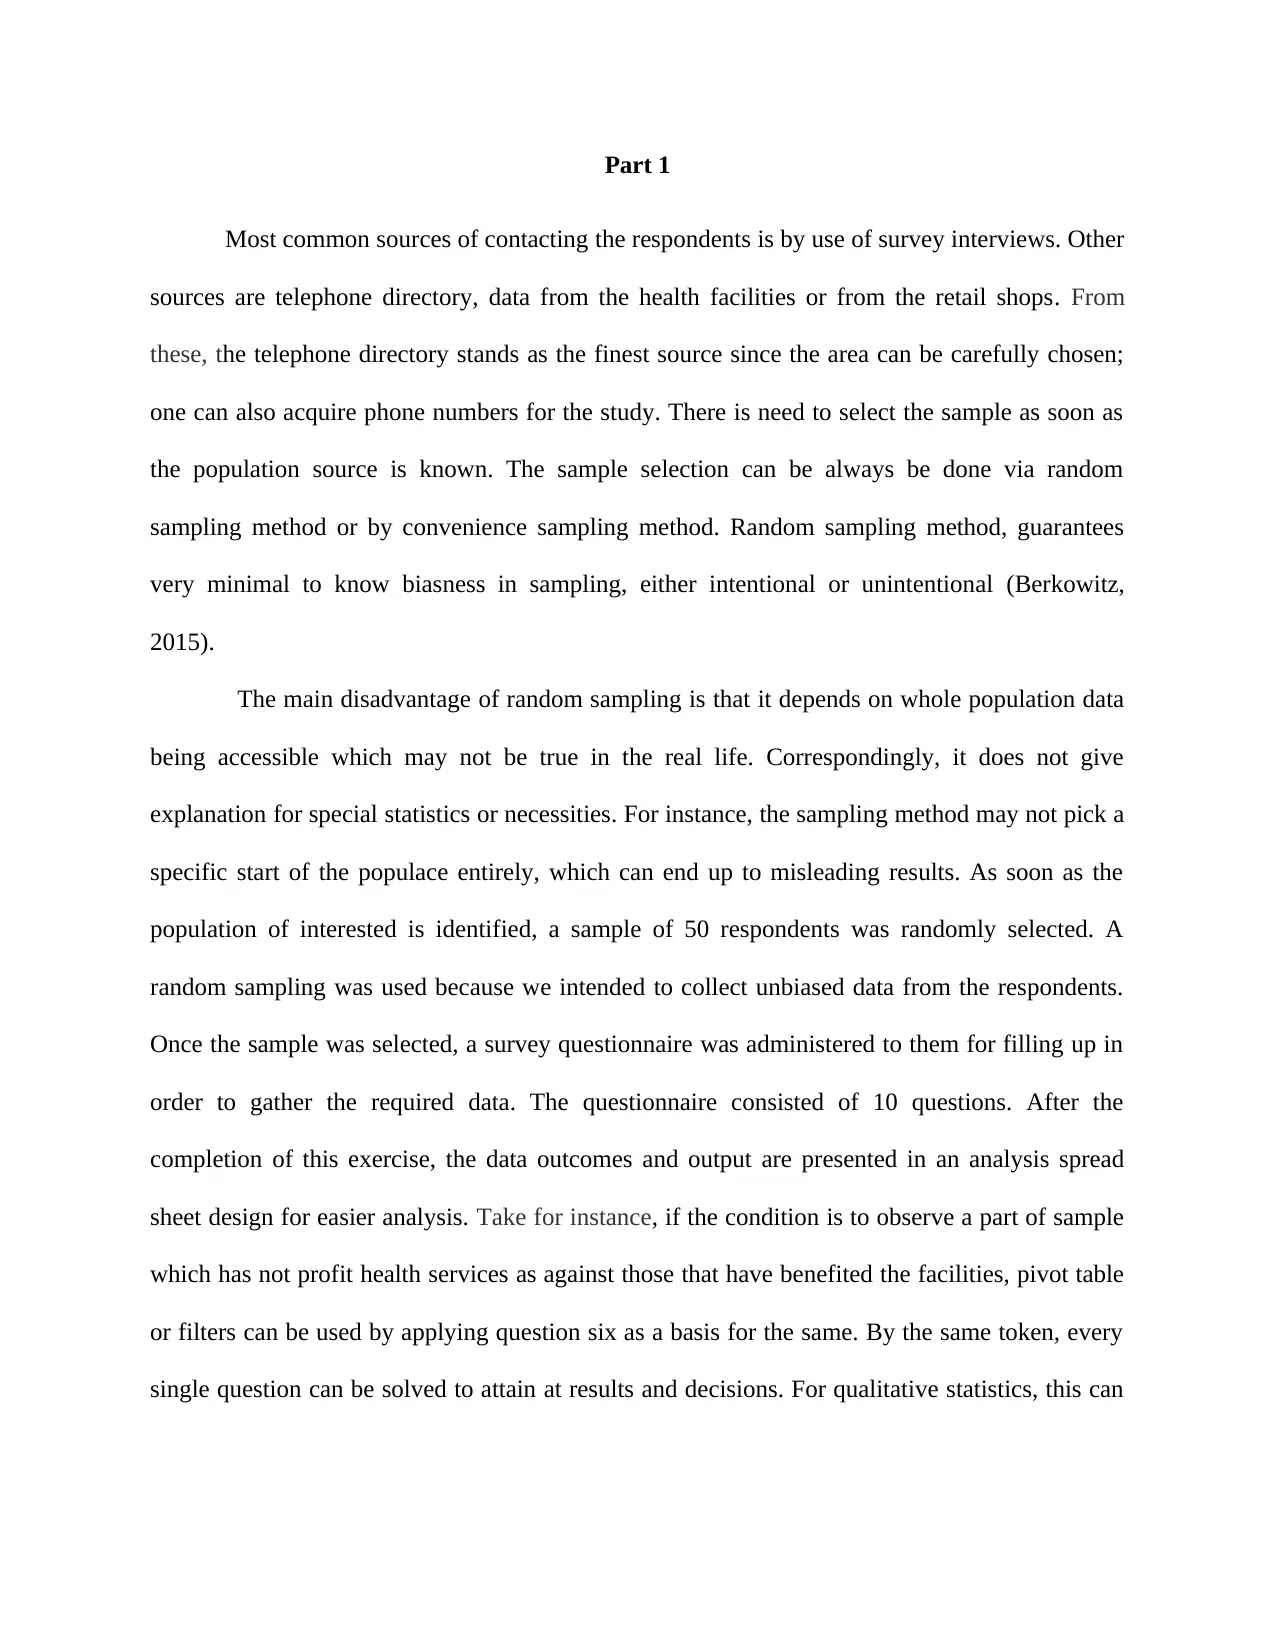
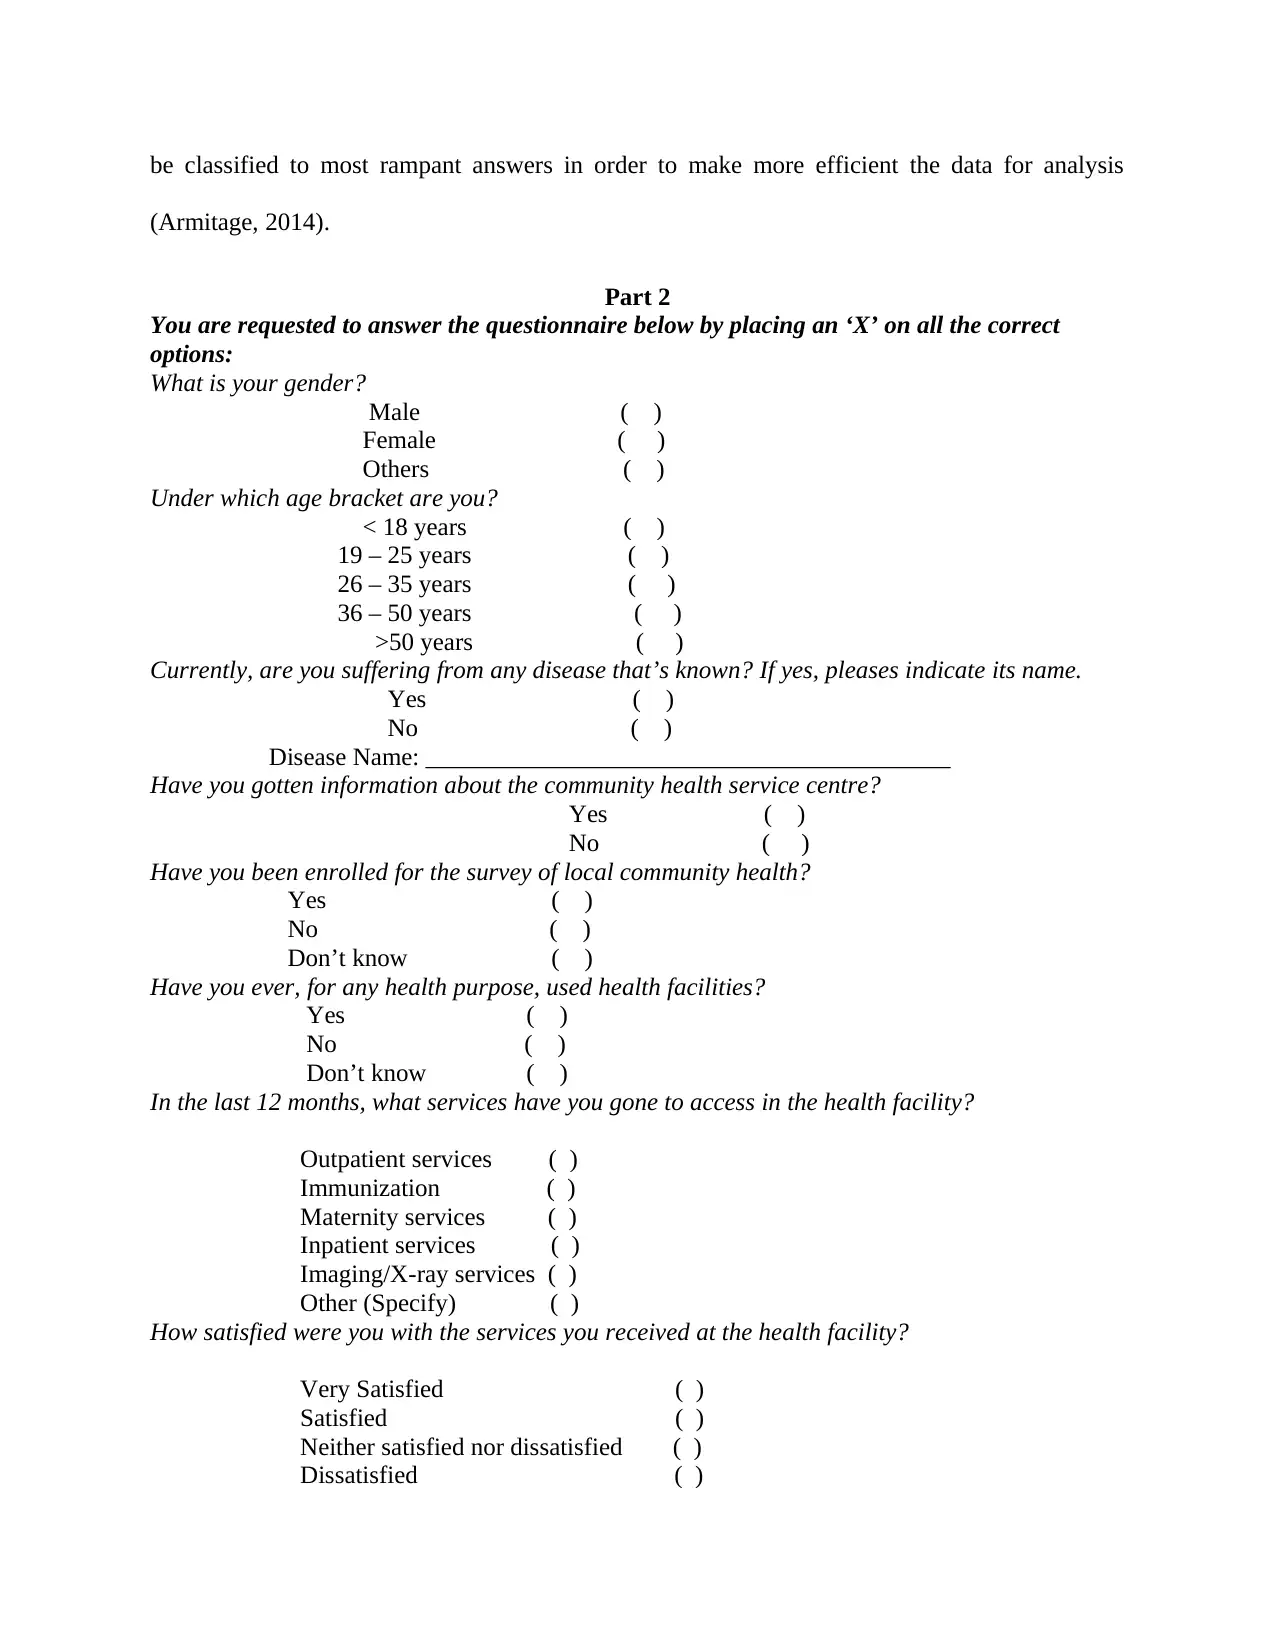
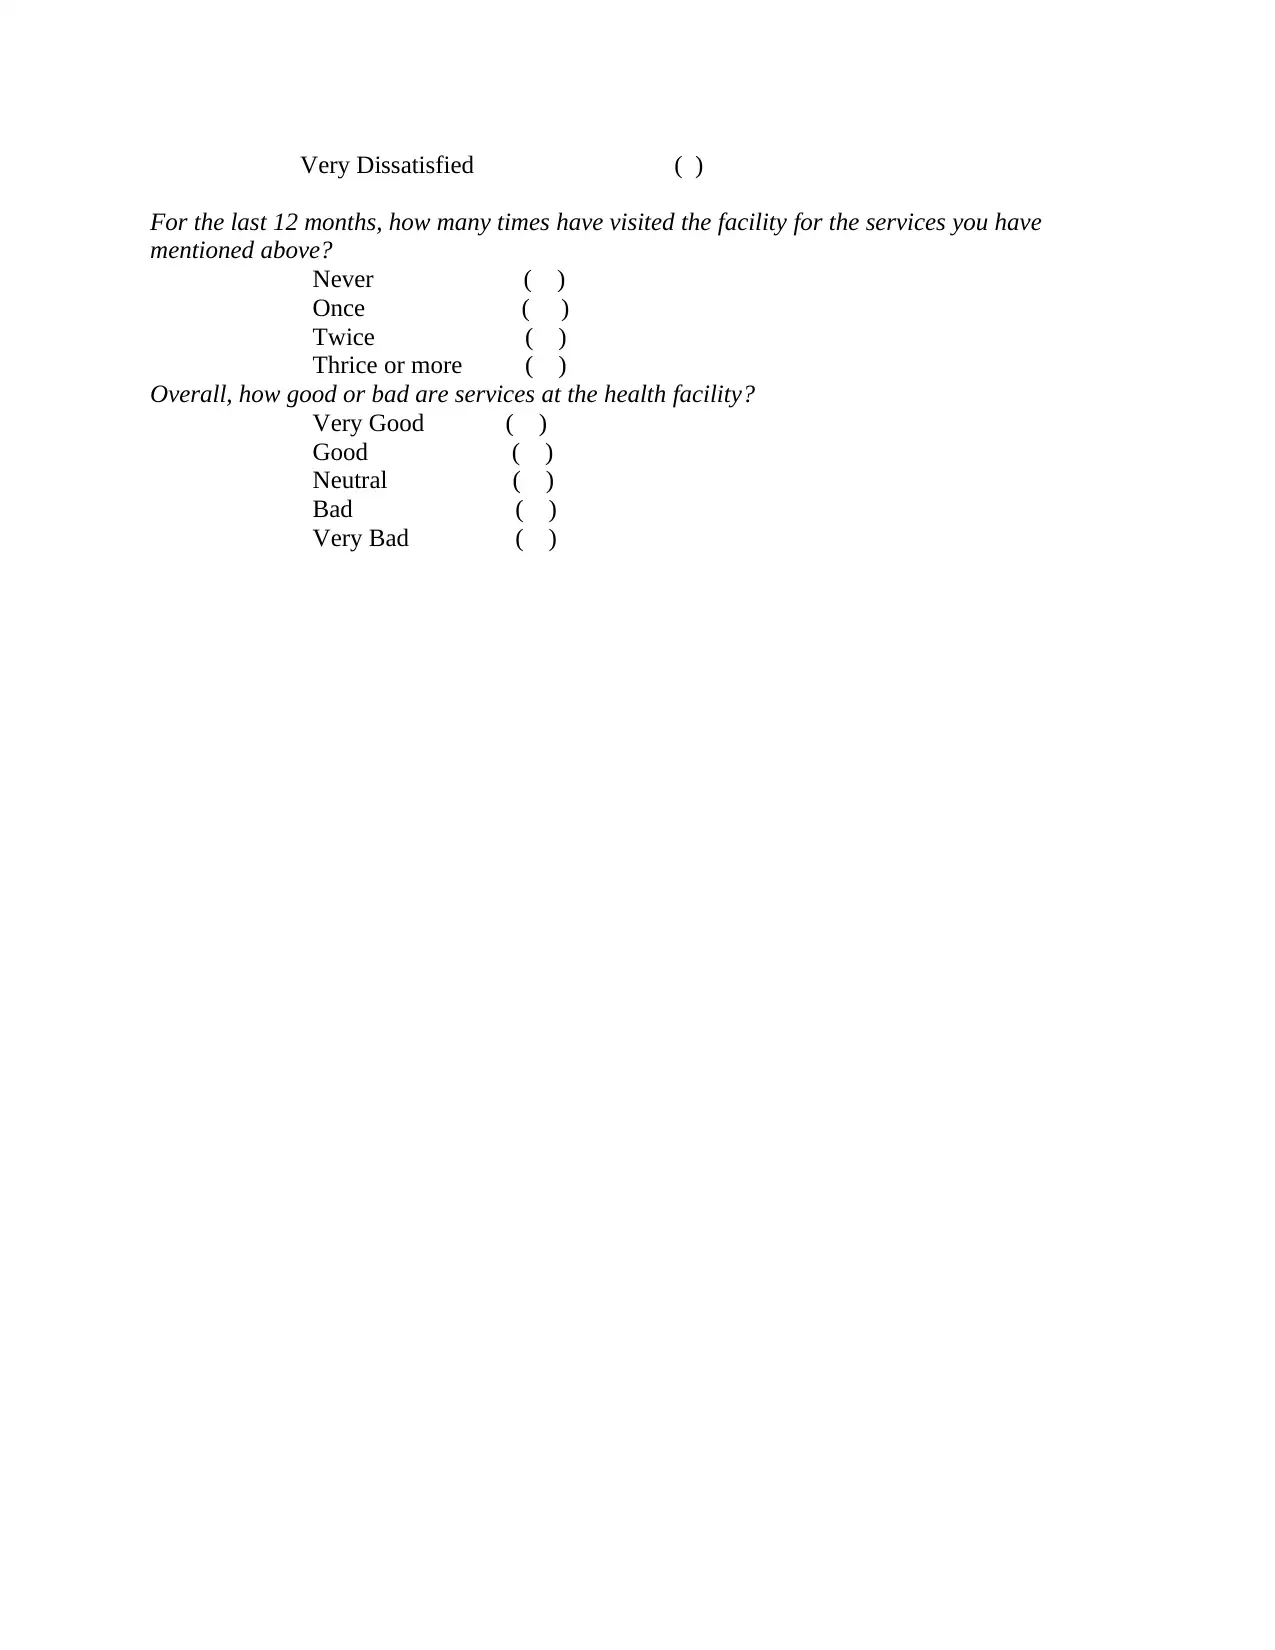
This assignment addresses the design of a short telephone survey to understand the demographic characteristics of individuals within the catchment area of a local community health service, distinguishing between users and non-users. Part 1 of the assignment discusses potential sources of population data, such as telephone directories and health facility records, outlining the advantages and disadvantages of each for participant selection. It also details the sampling method used (random sampling) and the process of recruiting participants. The assignment includes a description of the questionnaire with 10 questions and how the collected data is presented and analyzed using tools like pivot tables and filters. Part 2 provides the survey questionnaire itself, covering demographics, health status, awareness and use of community health services, and satisfaction levels. The assignment aims to collect unbiased data and analyze it for insights into community health service utilization.
Document Page
Statistics for Public Health
Name:
Lecturer:
Course:
Date:
tabler-icon-diamond-filled.svg

Paraphrase This Document

Need a fresh take? Get an instant paraphrase of this document with our AI Paraphraser
Document Page
Part 1
Most common sources of contacting the respondents is by use of survey interviews. Other
sources are telephone directory, data from the health facilities or from the retail shops. From
these, the telephone directory stands as the finest source since the area can be carefully chosen;
one can also acquire phone numbers for the study. There is need to select the sample as soon as
the population source is known. The sample selection can be always be done via random
sampling method or by convenience sampling method. Random sampling method, guarantees
very minimal to know biasness in sampling, either intentional or unintentional (Berkowitz,
2015).
The main disadvantage of random sampling is that it depends on whole population data
being accessible which may not be true in the real life. Correspondingly, it does not give
explanation for special statistics or necessities. For instance, the sampling method may not pick a
specific start of the populace entirely, which can end up to misleading results. As soon as the
population of interested is identified, a sample of 50 respondents was randomly selected. A
random sampling was used because we intended to collect unbiased data from the respondents.
Once the sample was selected, a survey questionnaire was administered to them for filling up in
order to gather the required data. The questionnaire consisted of 10 questions. After the
completion of this exercise, the data outcomes and output are presented in an analysis spread
sheet design for easier analysis. Take for instance, if the condition is to observe a part of sample
which has not profit health services as against those that have benefited the facilities, pivot table
or filters can be used by applying question six as a basis for the same. By the same token, every
single question can be solved to attain at results and decisions. For qualitative statistics, this can
Document Page
be classified to most rampant answers in order to make more efficient the data for analysis
(Armitage, 2014).
Part 2
You are requested to answer the questionnaire below by placing an ‘X’ on all the correct
options:
What is your gender?
Male ( )
Female ( )
Others ( )
Under which age bracket are you?
< 18 years ( )
19 – 25 years ( )
26 – 35 years ( )
36 – 50 years ( )
>50 years ( )
Currently, are you suffering from any disease that’s known? If yes, pleases indicate its name.
Yes ( )
No ( )
Disease Name: __________________________________________
Have you gotten information about the community health service centre?
Yes ( )
No ( )
Have you been enrolled for the survey of local community health?
Yes ( )
No ( )
Don’t know ( )
Have you ever, for any health purpose, used health facilities?
Yes ( )
No ( )
Don’t know ( )
In the last 12 months, what services have you gone to access in the health facility?
Outpatient services ( )
Immunization ( )
Maternity services ( )
Inpatient services ( )
Imaging/X-ray services ( )
Other (Specify) ( )
How satisfied were you with the services you received at the health facility?
Very Satisfied ( )
Satisfied ( )
Neither satisfied nor dissatisfied ( )
Dissatisfied ( )
Document Page
Very Dissatisfied ( )
For the last 12 months, how many times have visited the facility for the services you have
mentioned above?
Never ( )
Once ( )
Twice ( )
Thrice or more ( )
Overall, how good or bad are services at the health facility?
Very Good ( )
Good ( )
Neutral ( )
Bad ( )
Very Bad ( )
tabler-icon-diamond-filled.svg

Paraphrase This Document

Need a fresh take? Get an instant paraphrase of this document with our AI Paraphraser
Document Page
Works Cited
Armitage, K. (2014). Statistical method in medical research. Journal of Health Sciences, 12-17.
Berkowitz, B. (2015). Community Impact of healthcare services: Creating grassroot change in
hard times. Journal of Health Sciences, 1-12.
chevron_up_icon
1 out of 5
circle_padding
hide_on_mobile
zoom_out_icon
[object Object]