STAT6003: Financial Statistics Report on House Price Index
VerifiedAdded on 2023/06/10
|8
|1570
|106
Report
AI Summary
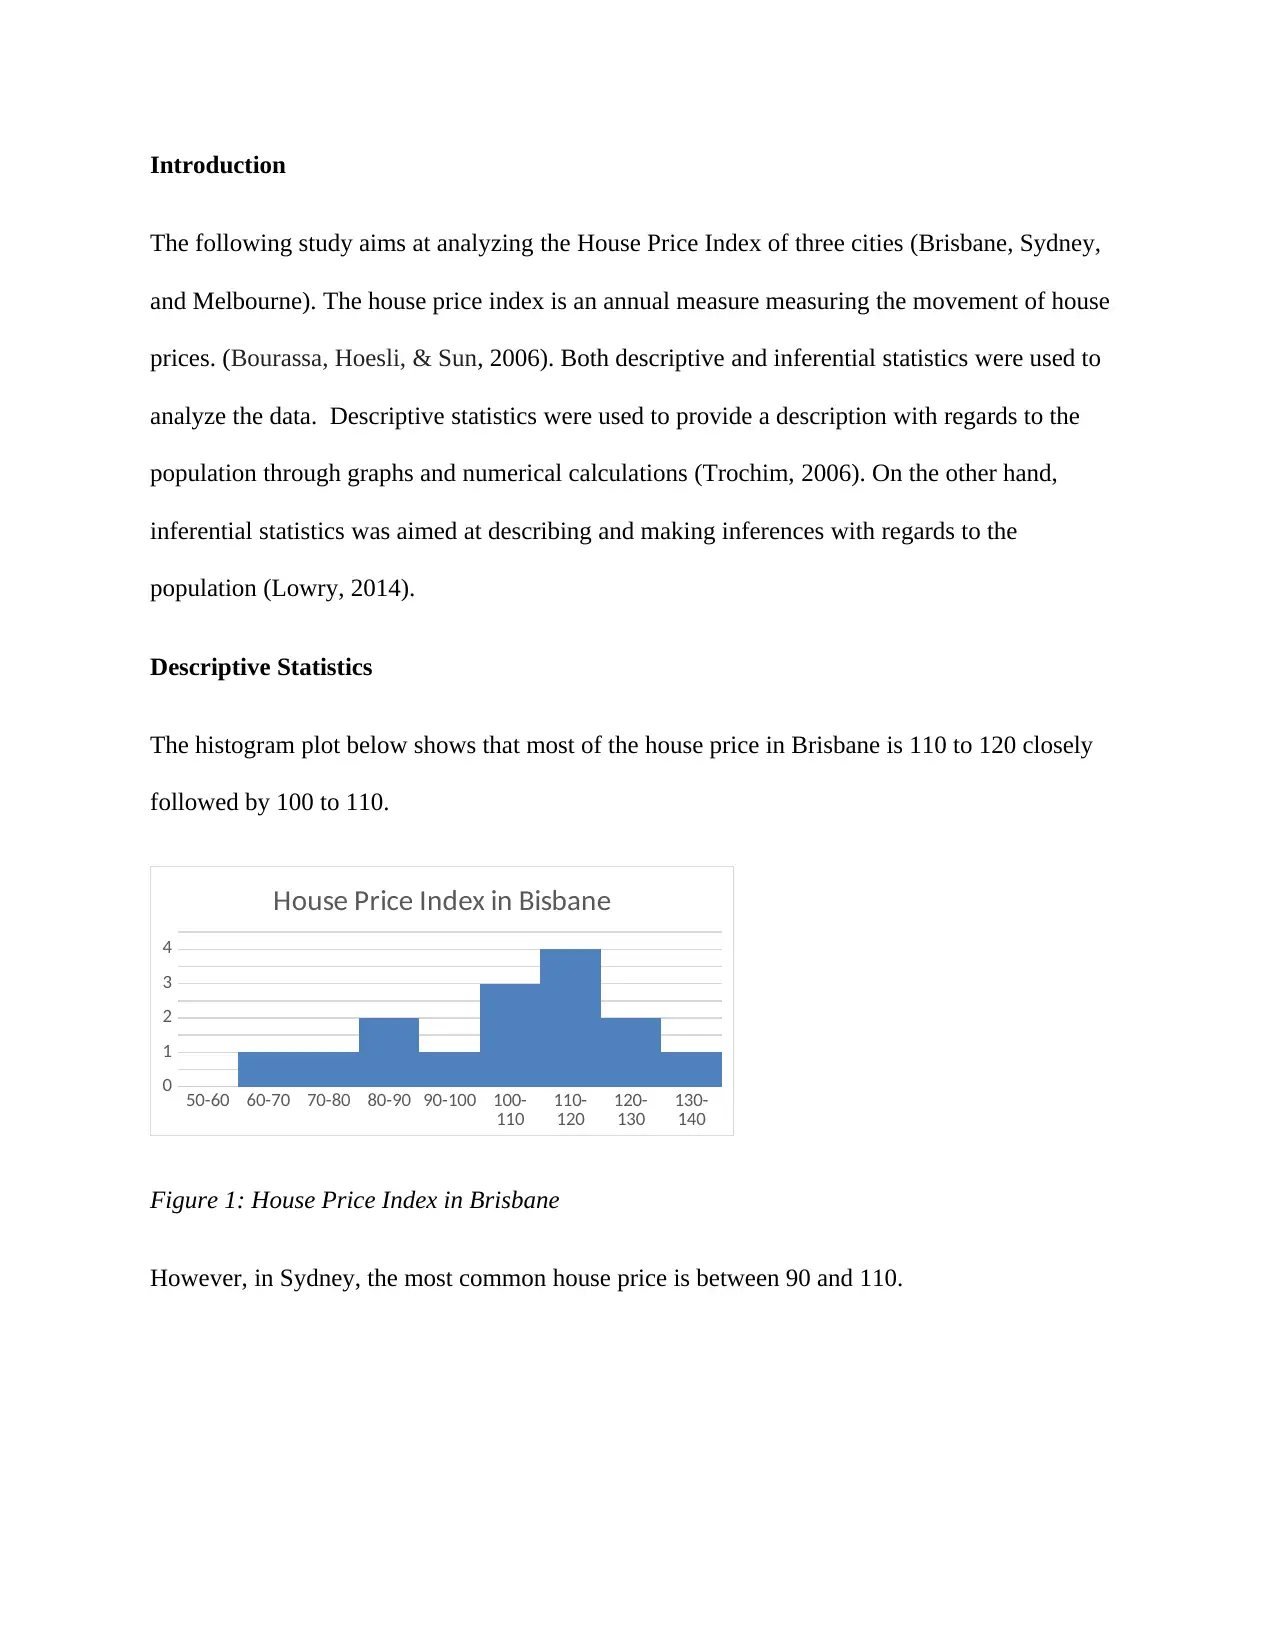
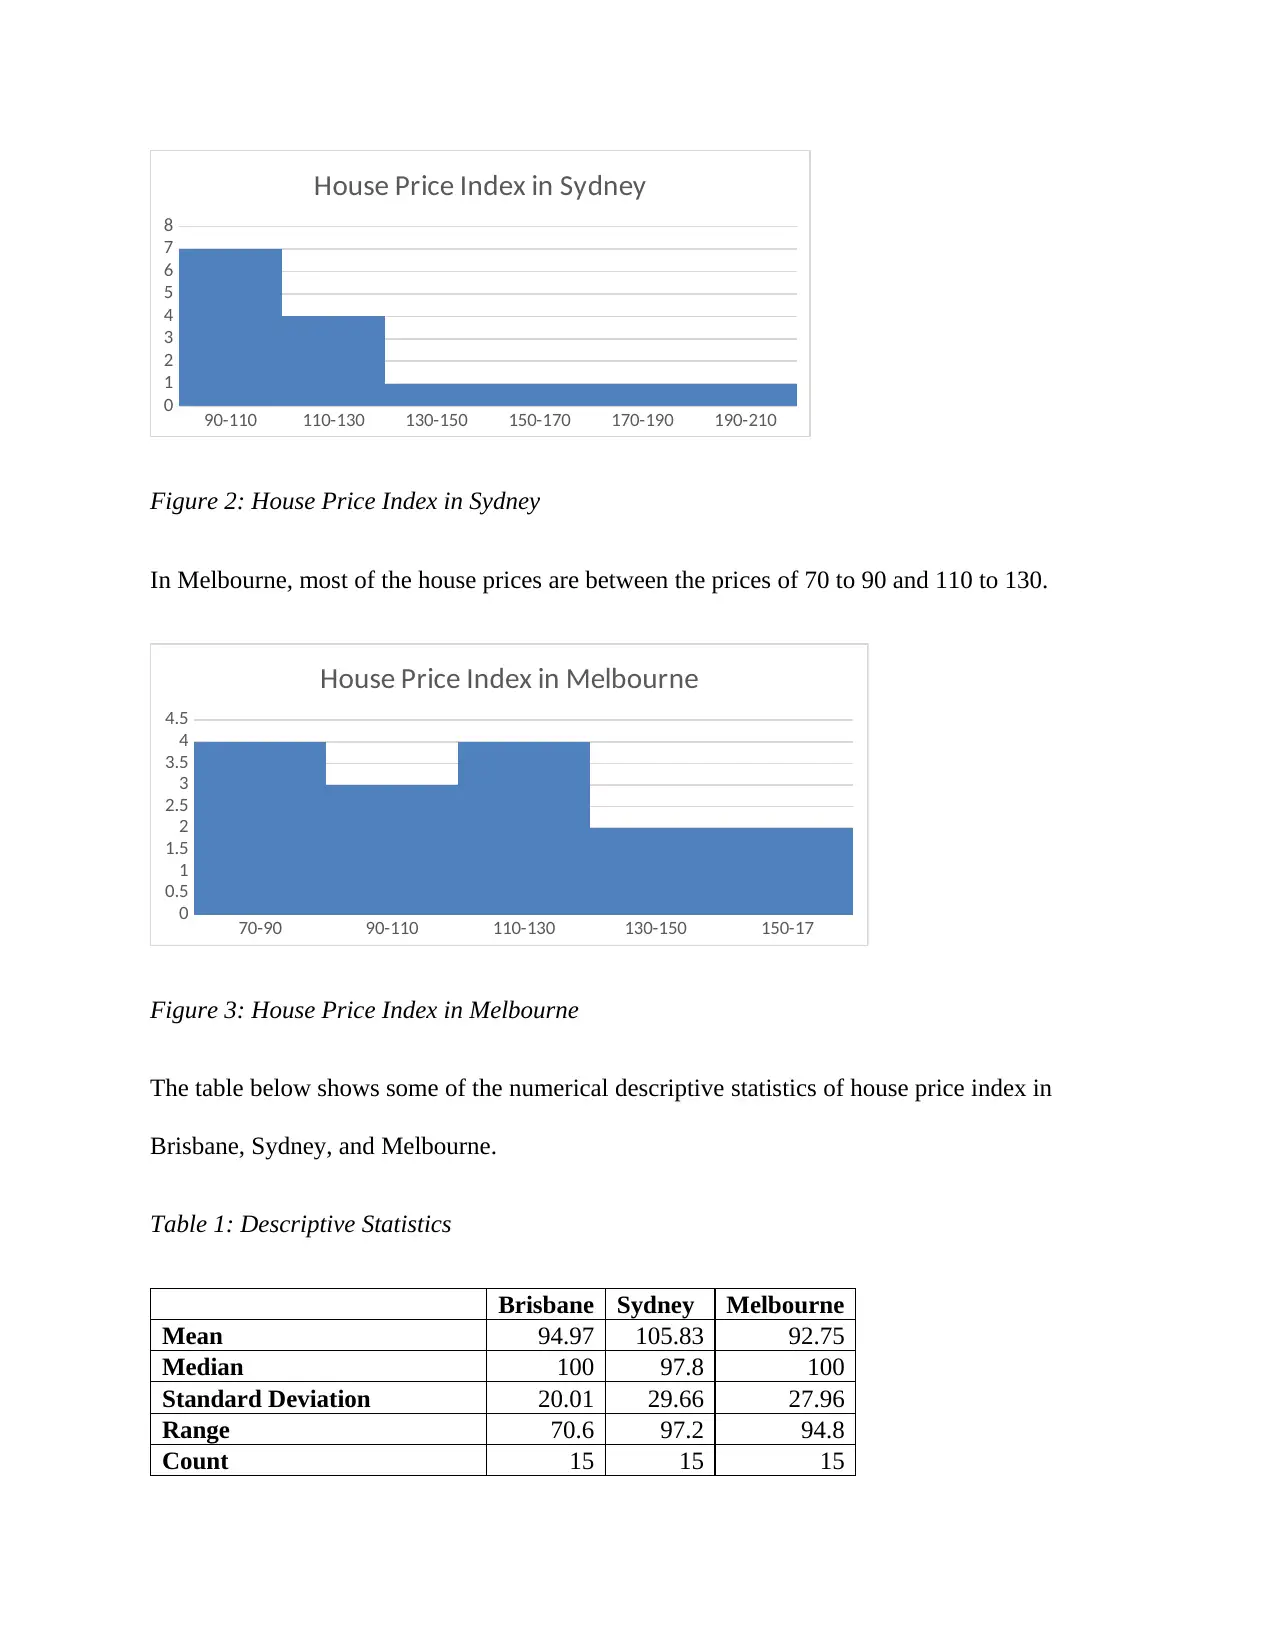
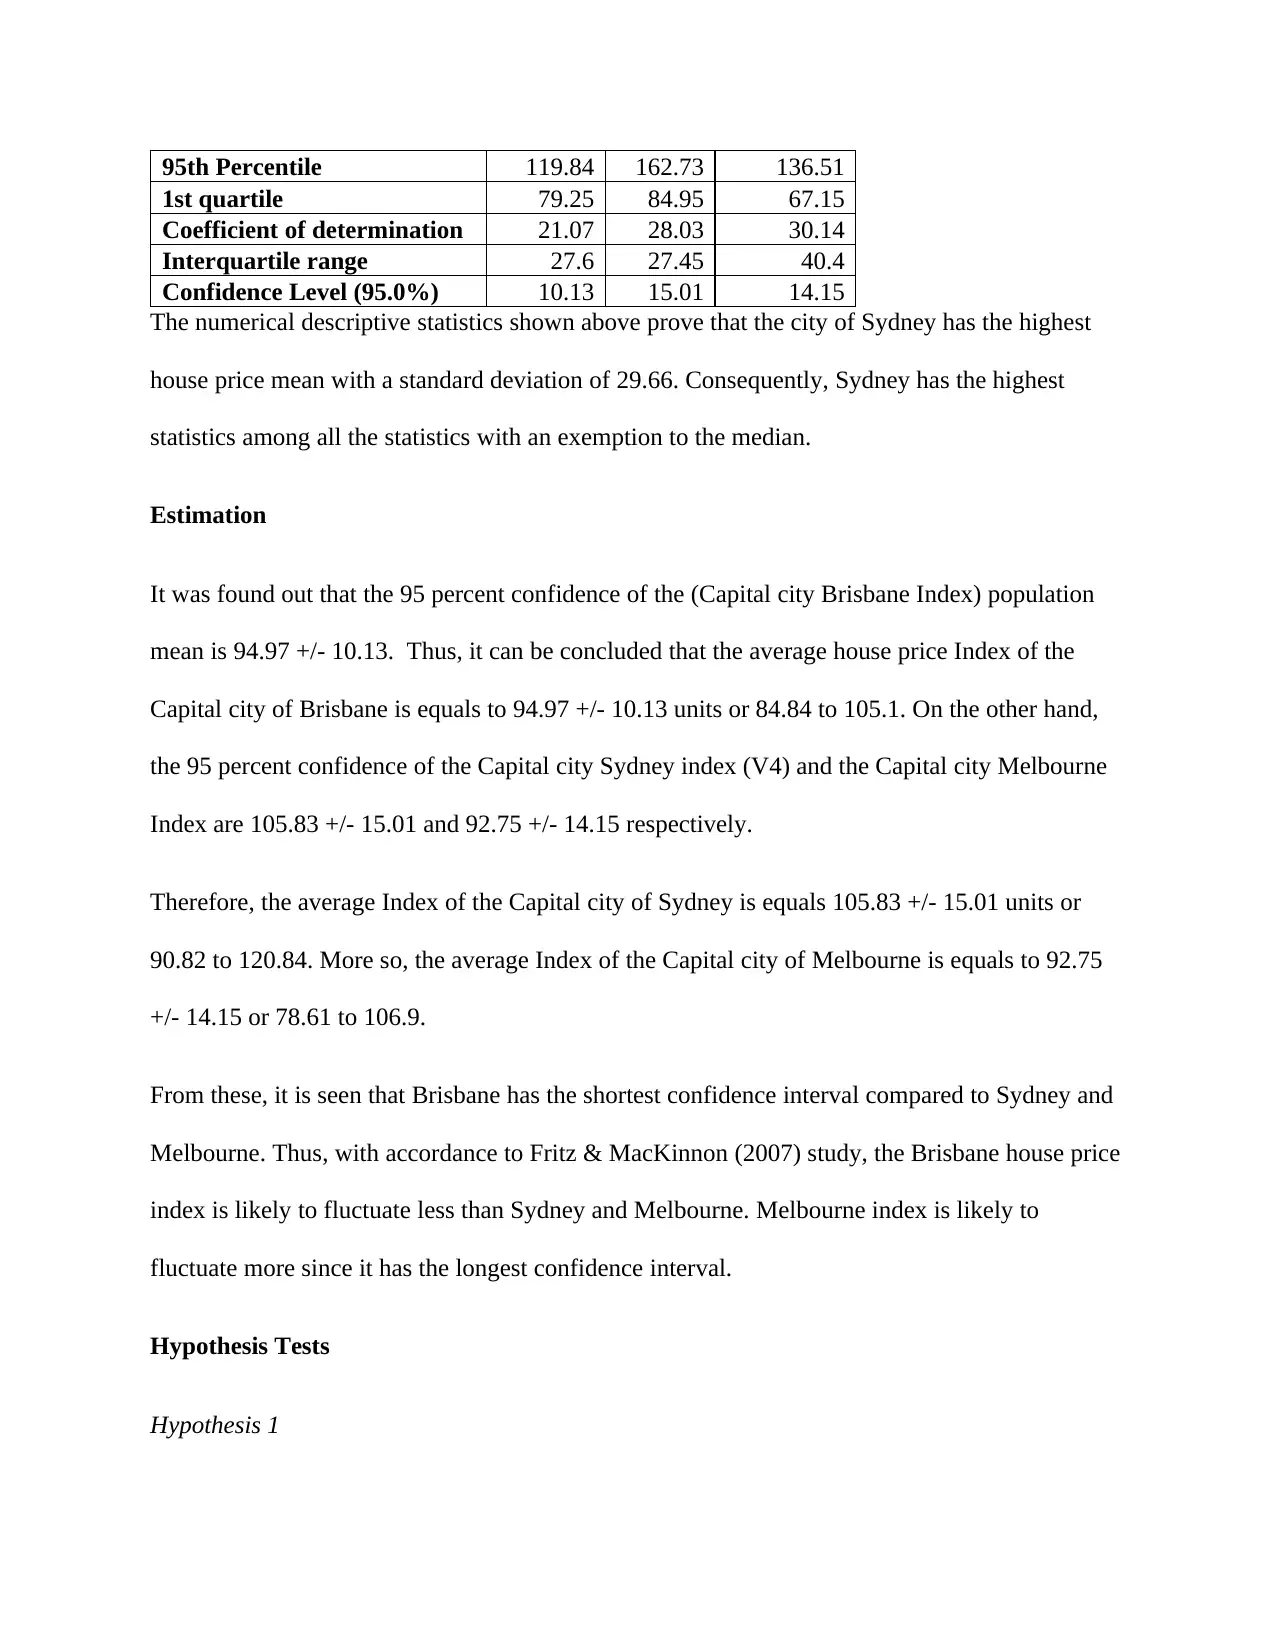
This report presents a statistical analysis of the House Price Index (HPI) for Brisbane, Sydney, and Melbourne. Descriptive statistics, including histograms and numerical summaries, are used to illustrate the distribution of house prices in each city. Sydney exhibits the highest mean HPI, while Brisbane has the shortest confidence interval, suggesting less fluctuation. Hypothesis tests are conducted to compare the average HPI across the cities, revealing significant differences between Brisbane and Melbourne, but similarities between Sydney and the other two cities. The findings align with previous research indicating Sydney's leading position in housing prices. Desklib offers a variety of resources, including past papers and solved assignments, to aid students in their studies.

RUNNING HEADER: PROPERTY ASSESSMENT 1
Property Assessment
Student’s name:
Student’s ID:
Institution:
Property Assessment
Student’s name:
Student’s ID:
Institution:
Paraphrase This Document
Need a fresh take? Get an instant paraphrase of this document with our AI Paraphraser

Introduction
The following study aims at analyzing the House Price Index of three cities (Brisbane, Sydney,
and Melbourne). The house price index is an annual measure measuring the movement of house
prices. (Bourassa, Hoesli, & Sun, 2006). Both descriptive and inferential statistics were used to
analyze the data. Descriptive statistics were used to provide a description with regards to the
population through graphs and numerical calculations (Trochim, 2006). On the other hand,
inferential statistics was aimed at describing and making inferences with regards to the
population (Lowry, 2014).
Descriptive Statistics
The histogram plot below shows that most of the house price in Brisbane is 110 to 120 closely
followed by 100 to 110.
50-60 60-70 70-80 80-90 90-100 100-
110 110-
120 120-
130 130-
140
0
1
2
3
4
House Price Index in Bisbane
Figure 1: House Price Index in Brisbane
However, in Sydney, the most common house price is between 90 and 110.

90-110 110-130 130-150 150-170 170-190 190-210
0
1
2
3
4
5
6
7
8
House Price Index in Sydney
Figure 2: House Price Index in Sydney
In Melbourne, most of the house prices are between the prices of 70 to 90 and 110 to 130.
70-90 90-110 110-130 130-150 150-17
0
0.5
1
1.5
2
2.5
3
3.5
4
4.5
House Price Index in Melbourne
Figure 3: House Price Index in Melbourne
The table below shows some of the numerical descriptive statistics of house price index in
Brisbane, Sydney, and Melbourne.
Table 1: Descriptive Statistics
Brisbane Sydney Melbourne
Mean 94.97 105.83 92.75
Median 100 97.8 100
Standard Deviation 20.01 29.66 27.96
Range 70.6 97.2 94.8
Count 15 15 15
0
1
2
3
4
5
6
7
8
House Price Index in Sydney
Figure 2: House Price Index in Sydney
In Melbourne, most of the house prices are between the prices of 70 to 90 and 110 to 130.
70-90 90-110 110-130 130-150 150-17
0
0.5
1
1.5
2
2.5
3
3.5
4
4.5
House Price Index in Melbourne
Figure 3: House Price Index in Melbourne
The table below shows some of the numerical descriptive statistics of house price index in
Brisbane, Sydney, and Melbourne.
Table 1: Descriptive Statistics
Brisbane Sydney Melbourne
Mean 94.97 105.83 92.75
Median 100 97.8 100
Standard Deviation 20.01 29.66 27.96
Range 70.6 97.2 94.8
Count 15 15 15
⊘ This is a preview!⊘
Do you want full access?
Subscribe today to unlock all pages.

Trusted by 1+ million students worldwide

95th Percentile 119.84 162.73 136.51
1st quartile 79.25 84.95 67.15
Coefficient of determination 21.07 28.03 30.14
Interquartile range 27.6 27.45 40.4
Confidence Level (95.0%) 10.13 15.01 14.15
The numerical descriptive statistics shown above prove that the city of Sydney has the highest
house price mean with a standard deviation of 29.66. Consequently, Sydney has the highest
statistics among all the statistics with an exemption to the median.
Estimation
It was found out that the 95 percent confidence of the (Capital city Brisbane Index) population
mean is 94.97 +/- 10.13. Thus, it can be concluded that the average house price Index of the
Capital city of Brisbane is equals to 94.97 +/- 10.13 units or 84.84 to 105.1. On the other hand,
the 95 percent confidence of the Capital city Sydney index (V4) and the Capital city Melbourne
Index are 105.83 +/- 15.01 and 92.75 +/- 14.15 respectively.
Therefore, the average Index of the Capital city of Sydney is equals 105.83 +/- 15.01 units or
90.82 to 120.84. More so, the average Index of the Capital city of Melbourne is equals to 92.75
+/- 14.15 or 78.61 to 106.9.
From these, it is seen that Brisbane has the shortest confidence interval compared to Sydney and
Melbourne. Thus, with accordance to Fritz & MacKinnon (2007) study, the Brisbane house price
index is likely to fluctuate less than Sydney and Melbourne. Melbourne index is likely to
fluctuate more since it has the longest confidence interval.
Hypothesis Tests
Hypothesis 1
Paraphrase This Document
Need a fresh take? Get an instant paraphrase of this document with our AI Paraphraser

H0: The population’s average house Price for Brisbane is equal to 100
H1: The population’s average house Price for Brisbane is different to 100
A one-sample t-test was appropriate to test the hypothesis since it compares the mean of a single
sample to a predetermined mean (De Winter, 2013).
The t-value is -0.947 with a p-value of 0.17 and 0.34 at one-tail and two-tail respectively. Since
the result is not significant at p<0.05, we choose to not accept the null hypothesis (Labovitz,
2006). Therefore, the population’s average house Price index for Brisbane is different from 100.
Hypothesis 2
H0: The population’s average house Price for Sydney is equal to 100
H1: The population’s average house Price for Sydney is different to 100
The result of the one-sample t-test used to test the above hypothesis is as shown:
The t-value is 0.76 with a p-value of 0.23 and 0.46 at one-tail and two-tail respectively. Since the
result is not significant at p<0.05, we choose to not accept the null hypothesis. Therefore, the
population’s average house Price index for Sydney is different from 100.
Hypothesis 3
H0: The population’s average house Price for Melbourne is equal to 100
H1: The population’s average house Price for Melbourne is different to 100

The t-value is -1 with a p-value of 0.17 and 0.33 at one-tail and two-tail respectively. Since the
result is not significant at p<0.05, we choose to not accept the null hypothesis. Therefore, the
population’s average house Price index for Melbourne is different from 100.
It was of great importance to determine whether the population means house Price Index for
these cities were different. The three cities were paired forming three categories. The developed
hypothesis for the first pair (V2 and V4) is as shown:
Hypothesis 1
H0: The population means house Price Index for Brisbane and Sydney are equal.
H1: The population means house Price Index for Brisbane and Sydney are not equal.
A two-sample t-test was appropriate since t-tests if two population means are equal (Keselman,
Othman, Wilcox, & Fradette, 2004). It was found out that the t-value is -2.27 with a p-value of
0.02 and 0.04 at one-tail and two-tail respectively. Since the result is significant at p<0.05, we
choose to not reject the null hypothesis. Therefore, the population means house Price Index for
Brisbane and Sydney are equal.
Hypothesis 2
H0: The population means house Price Index for Brisbane and Melbourne are equal.
H1: The population means house Price Index for Brisbane and Melbourne are not equal.
The t-value is 0.77 with a p-value of 0.23 and 0.45 at one-tail and two-tail respectively. Since the
result is not significant at p<0.05, we choose to not accept the null hypothesis. Therefore, the
population means house Price Index for Brisbane and Sydney are not equal.
result is not significant at p<0.05, we choose to not accept the null hypothesis. Therefore, the
population’s average house Price index for Melbourne is different from 100.
It was of great importance to determine whether the population means house Price Index for
these cities were different. The three cities were paired forming three categories. The developed
hypothesis for the first pair (V2 and V4) is as shown:
Hypothesis 1
H0: The population means house Price Index for Brisbane and Sydney are equal.
H1: The population means house Price Index for Brisbane and Sydney are not equal.
A two-sample t-test was appropriate since t-tests if two population means are equal (Keselman,
Othman, Wilcox, & Fradette, 2004). It was found out that the t-value is -2.27 with a p-value of
0.02 and 0.04 at one-tail and two-tail respectively. Since the result is significant at p<0.05, we
choose to not reject the null hypothesis. Therefore, the population means house Price Index for
Brisbane and Sydney are equal.
Hypothesis 2
H0: The population means house Price Index for Brisbane and Melbourne are equal.
H1: The population means house Price Index for Brisbane and Melbourne are not equal.
The t-value is 0.77 with a p-value of 0.23 and 0.45 at one-tail and two-tail respectively. Since the
result is not significant at p<0.05, we choose to not accept the null hypothesis. Therefore, the
population means house Price Index for Brisbane and Sydney are not equal.
⊘ This is a preview!⊘
Do you want full access?
Subscribe today to unlock all pages.

Trusted by 1+ million students worldwide

Hypothesis 3
H0: The population means house Price Index for Sydney and Melbourne are equal.
H1: The population means house Price Index for Sydney and Melbourne are not equal.
The t-value is 4.46 with a p-value of 0.00 at both the one-tail and two-tail. Since the result is
significant at p < 0.05, we choose to accept the null hypothesis. Therefore, the population means
house Price Index for Sydney and Melbourne are equal.
From the above tests, it is evident that Sydney has a similar house price index with the other two
cities, Melbourne and Brisbane. However, the Brisbane and Melbourne have different house
price indices. The findings of this study are in line with Luo, Liu & Picken (2007) research
which showed that Sydney is at the top in terms of housing prices with Melbourne in second.
Other cities such as Brisbane lies on the bottom.
Paraphrase This Document
Need a fresh take? Get an instant paraphrase of this document with our AI Paraphraser

Reference:
Bourassa, S. C., Hoesli, M., & Sun, J. (2006). A simple alternative house price index
method. Journal of Housing Economics, 15(1), 80-97.
De Winter, J. C. (2013). Using the Student's t-test with extremely small sample sizes. Practical
Assessment, Research & Evaluation, 18(10).
Fritz, M. S., & MacKinnon, D. P. (2007). Required sample size to detect the mediated
effect. Psychological science, 18(3), 233-239.
Keselman, H. J., Othman, A. R., Wilcox, R. R., & Fradette, K. (2004). The new and improved
two-sample t-test. Psychological Science, 15(1), 47-51.
Labovitz, S. (2006). Criteria for selecting a significance level: a note on the sacredness of.
05. The significance test controversy. New Brunswick, NJ, USA: Aldine Transaction, 166-
171.
Lowry, R. (2014). Concepts and applications of inferential statistics.
Luo, Z. Q., Liu, C., & Picken, D. (2007). Housing price diffusion pattern of Australia's state
capital cities. International Journal of Strategic Property Management, 11(4), 227-242.
Trochim, W. M. (2006). Descriptive statistics.
1 out of 8
Your All-in-One AI-Powered Toolkit for Academic Success.
+13062052269
info@desklib.com
Available 24*7 on WhatsApp / Email
Unlock your academic potential
Copyright © 2020–2025 A2Z Services. All Rights Reserved. Developed and managed by ZUCOL.

