STAT670 - Weightlifting Data Analysis: Exploring Key Influences
VerifiedAdded on 2023/06/11
|9
|2002
|313
Report
AI Summary
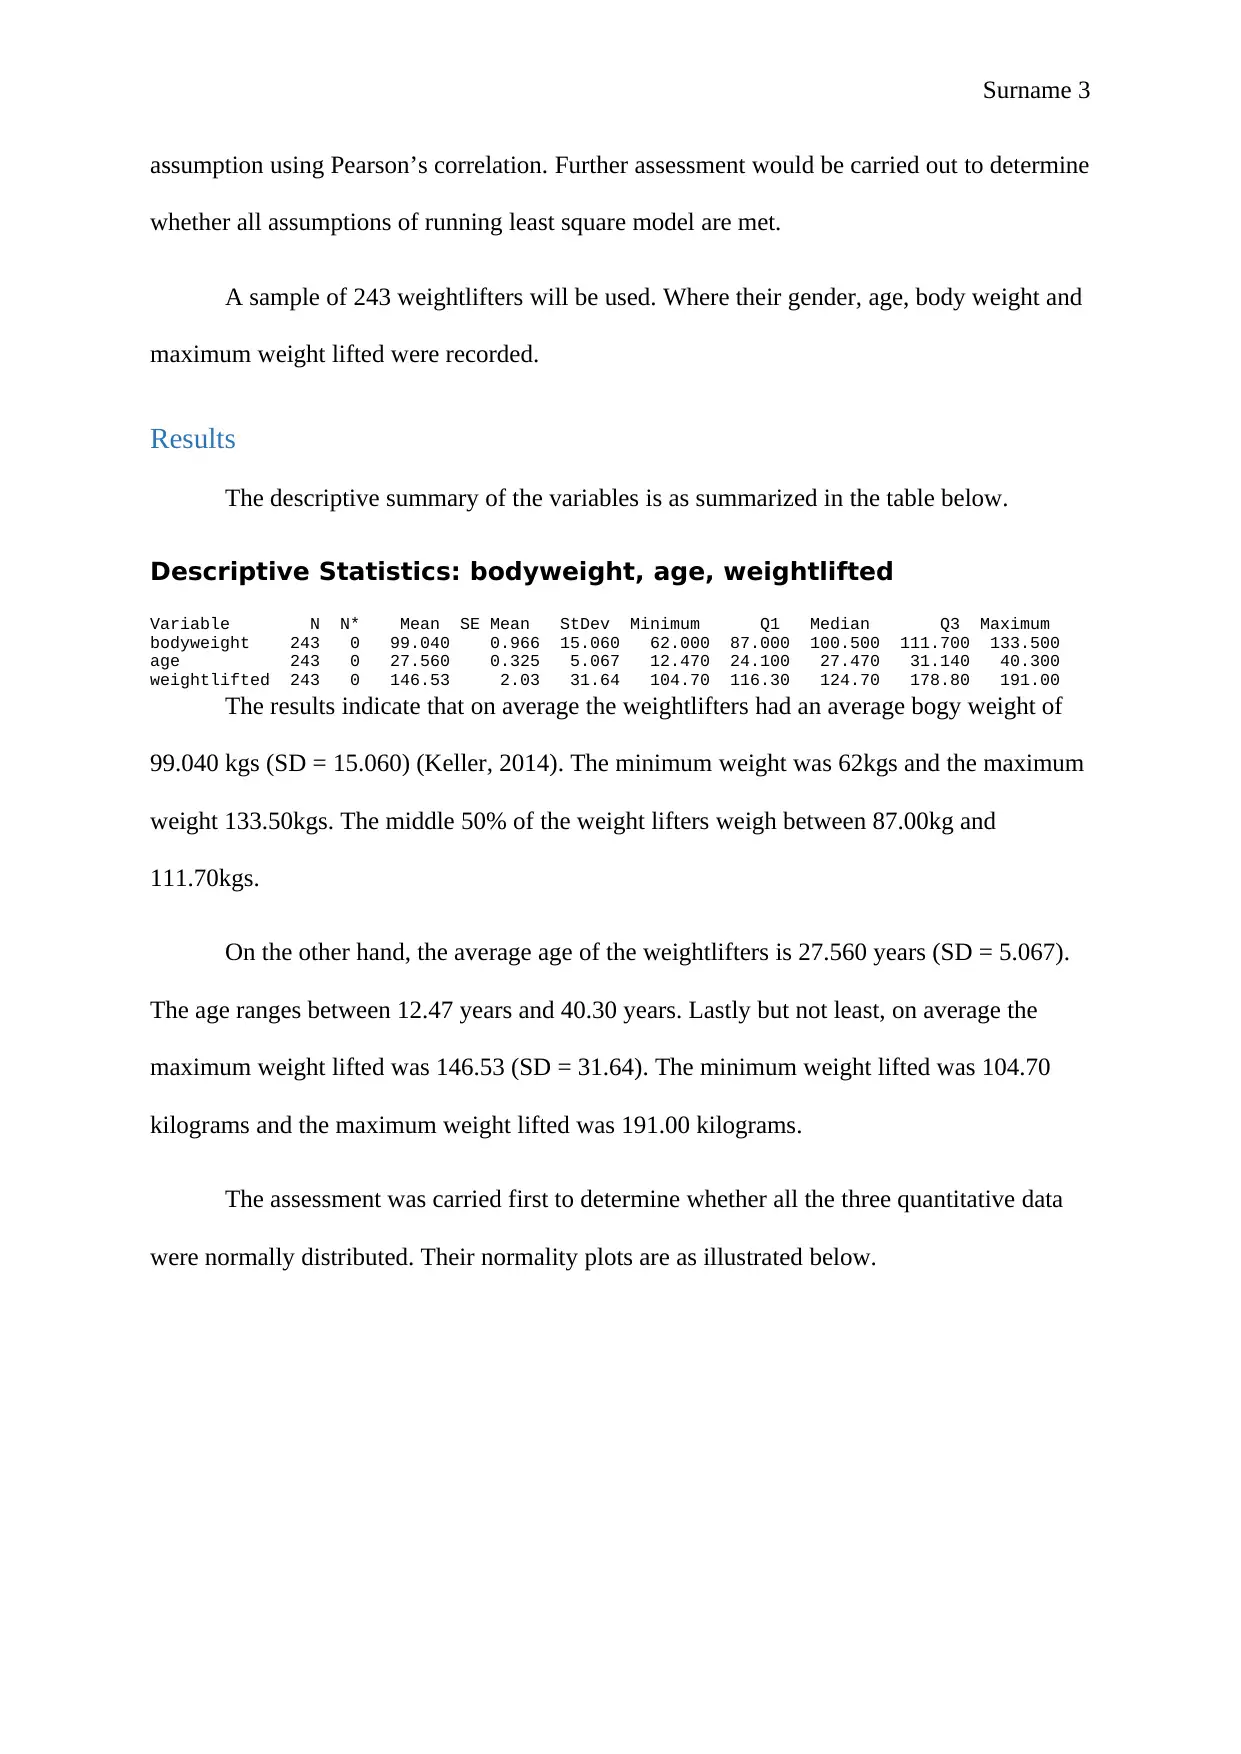
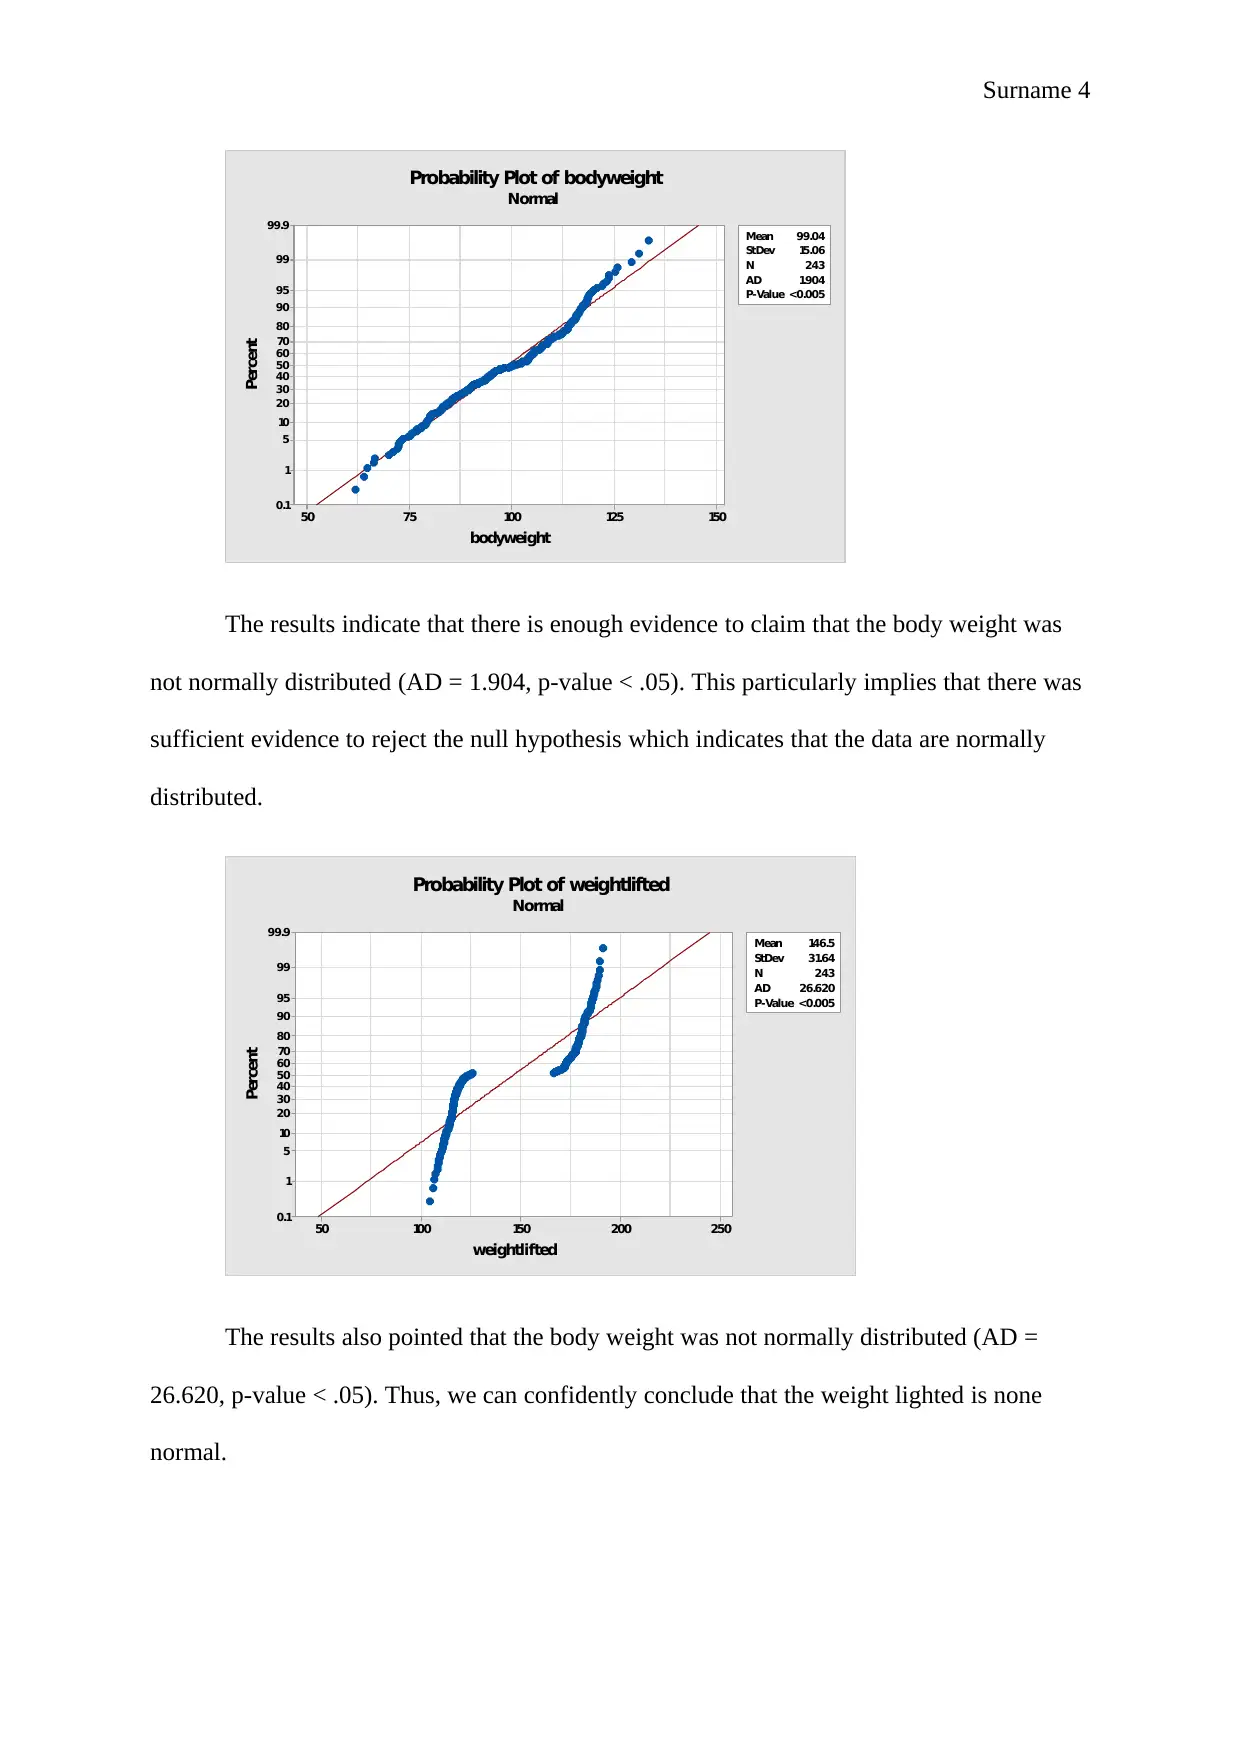
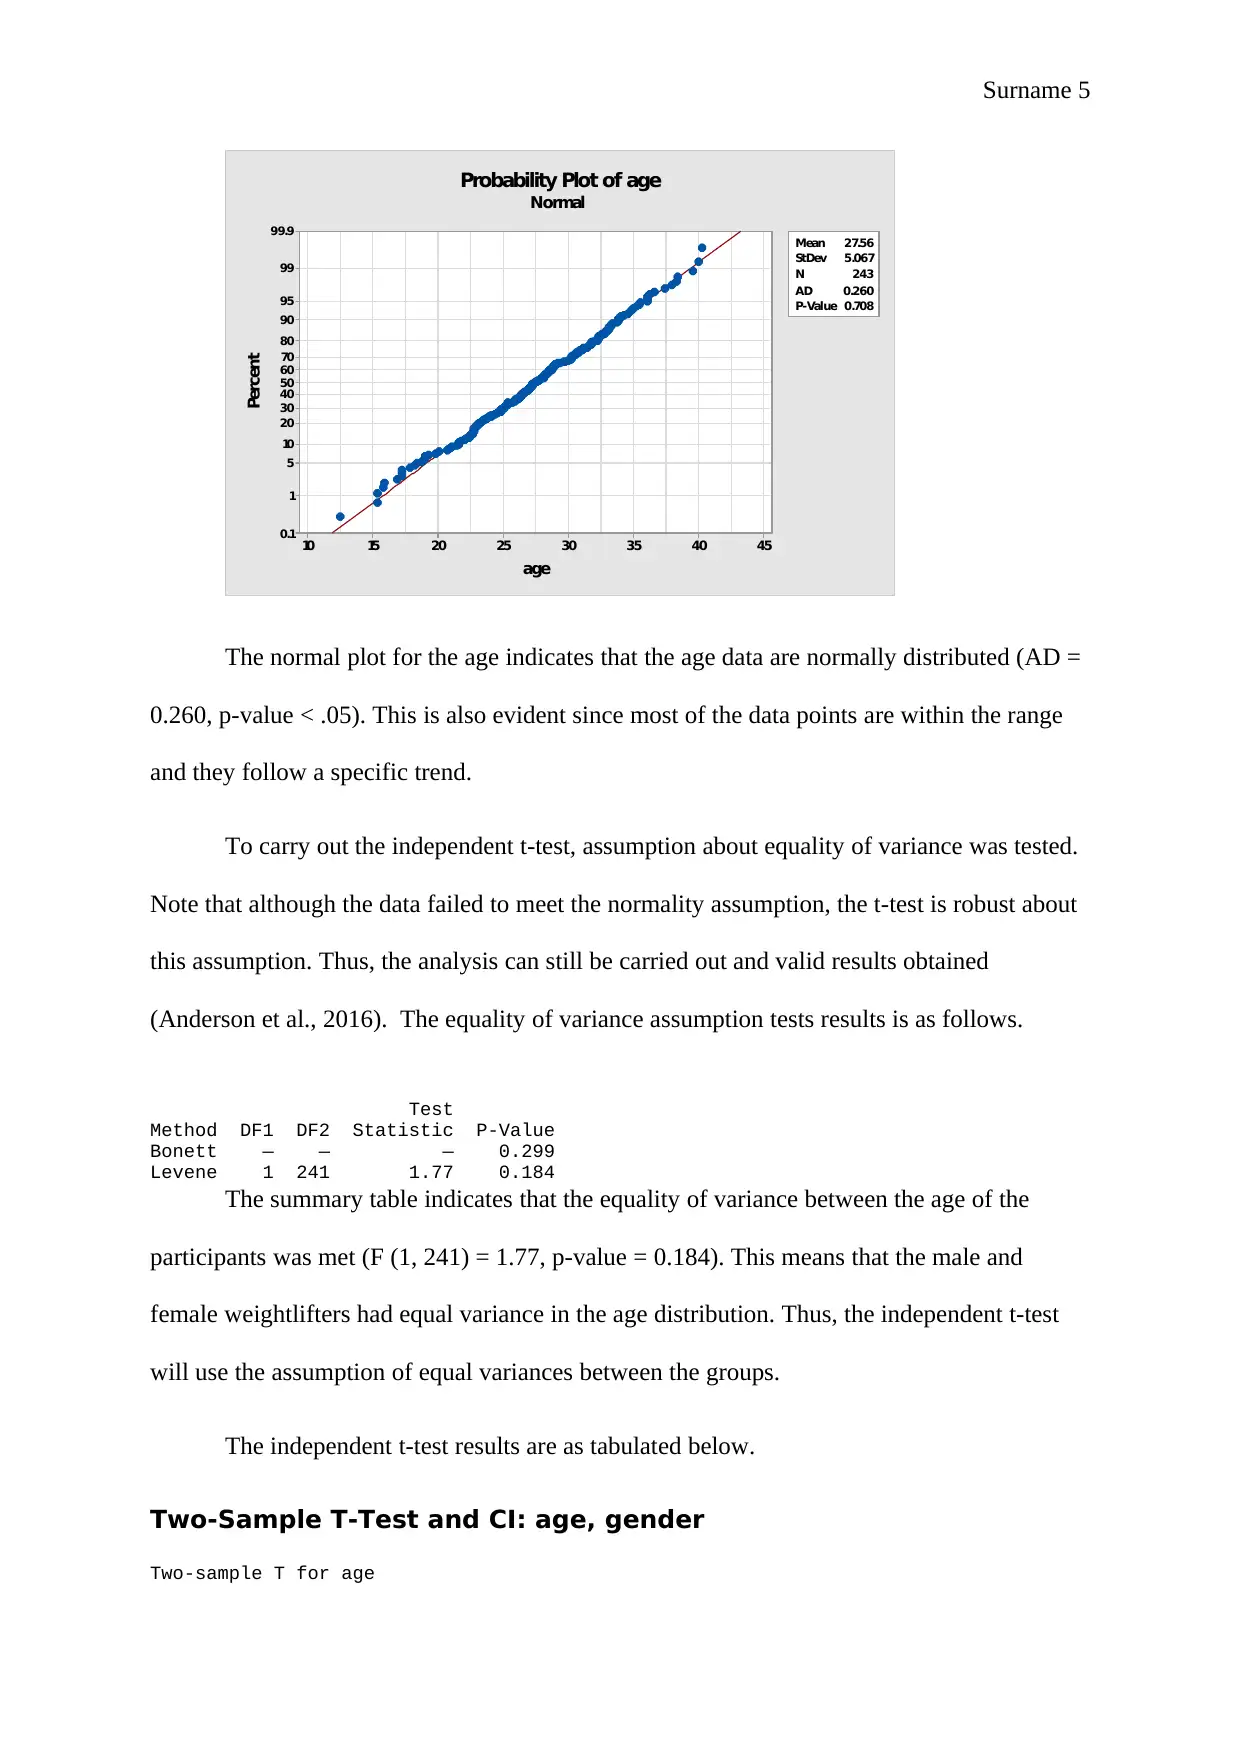
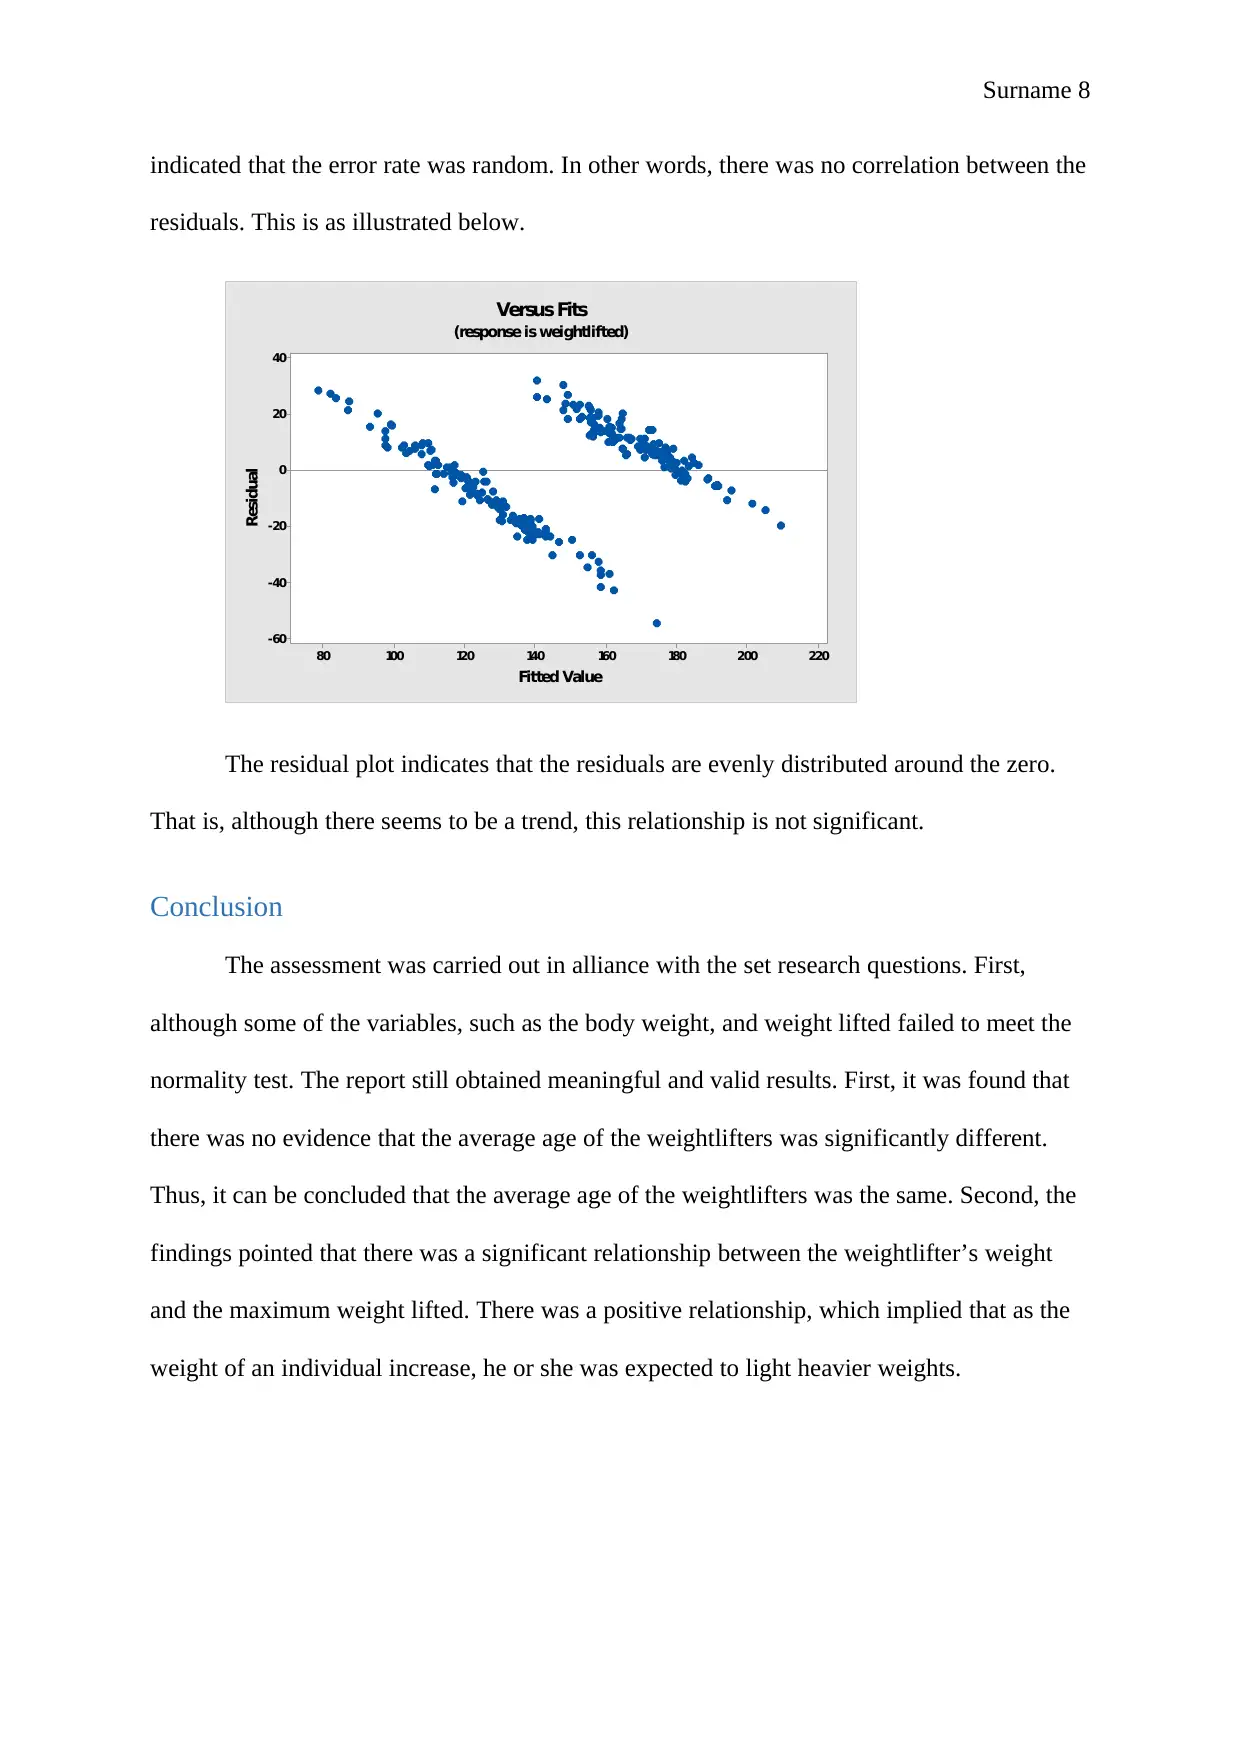
This statistical report analyzes a dataset of 243 weightlifters to determine the impact of gender, age, and body weight on the maximum weight lifted. The study employs descriptive statistics, independent sample t-tests, and simple linear regression. Results indicate no significant difference in average age between male and female weightlifters. However, a strong positive correlation exists between body weight and maximum weight lifted, suggesting that heavier individuals tend to lift more. The regression model explains a significant portion of the variance in weight lifted, with residual diagnostics confirming the model's validity. While some variables didn't meet normality assumptions, the report concludes that body weight is a reliable predictor of weight lifted. Access more solved assignments and study resources on Desklib.

Surname 1
Statistical Report
Authors Name:
Course:
Instructor’s name:
Institutions Name:
City and state
Due date:
Statistical Report
Authors Name:
Course:
Instructor’s name:
Institutions Name:
City and state
Due date:
Paraphrase This Document
Need a fresh take? Get an instant paraphrase of this document with our AI Paraphraser

Surname 2
Introduction
Body fitness is important for both body wellbeing and increasing the body stamina.
Researchers have found different factors that affect the muscular strength. One of this factor
include gender, age, types of muscle fiber among others (Tackett, 2017). In this research, the
main focus will be to determine whether gender, an individual body weight, and age have a
significant impact on the weight lifted. To achieve this, the physical and performance data
will be used to test the hypothesis. The study will answer the following research questions:
(a) Is there any difference in the average age of male and female weightlifters?
(b) What is the relation between the body weight of weightlifters and the maximum
weight they can lift?
All the tests are performed at the 0.05 level of significance.
Methods
Different research analysis method would be incorporated into this research. First, the
descriptive statistics would be carried out to determine the measures of central tendency and
the measures of dispersion. Second, the assumptions for tests of the hypothesis would be
carried out to ensure that most of the crucial ones are met. That is, some of the assumptions
such as normality test and equality of variances would be tested. This will help in ensuring
that appropriate tests are conducted for valid decisions and conclusion. The first primary test
of hypothesis technique that would be applied in the report is independent sample t-test. In
which the assessment would be carried out to test whether there is an average difference in
the age of the weightlifters by gender. Second, a simple linear regression would be carried
out to determine whether the body weight had a significant association with the maximum
weight lifted. However, the second test would be carried out after testing the linearity

Surname 3
assumption using Pearson’s correlation. Further assessment would be carried out to determine
whether all assumptions of running least square model are met.
A sample of 243 weightlifters will be used. Where their gender, age, body weight and
maximum weight lifted were recorded.
Results
The descriptive summary of the variables is as summarized in the table below.
Descriptive Statistics: bodyweight, age, weightlifted
Variable N N* Mean SE Mean StDev Minimum Q1 Median Q3 Maximum
bodyweight 243 0 99.040 0.966 15.060 62.000 87.000 100.500 111.700 133.500
age 243 0 27.560 0.325 5.067 12.470 24.100 27.470 31.140 40.300
weightlifted 243 0 146.53 2.03 31.64 104.70 116.30 124.70 178.80 191.00
The results indicate that on average the weightlifters had an average bogy weight of
99.040 kgs (SD = 15.060) (Keller, 2014). The minimum weight was 62kgs and the maximum
weight 133.50kgs. The middle 50% of the weight lifters weigh between 87.00kg and
111.70kgs.
On the other hand, the average age of the weightlifters is 27.560 years (SD = 5.067).
The age ranges between 12.47 years and 40.30 years. Lastly but not least, on average the
maximum weight lifted was 146.53 (SD = 31.64). The minimum weight lifted was 104.70
kilograms and the maximum weight lifted was 191.00 kilograms.
The assessment was carried first to determine whether all the three quantitative data
were normally distributed. Their normality plots are as illustrated below.
⊘ This is a preview!⊘
Do you want full access?
Subscribe today to unlock all pages.

Trusted by 1+ million students worldwide

Surname 4
1501251007550
99.9
99
95
90
80
70
60
50
40
30
20
10
5
1
0.1
Mean 99.04
StDev 15.06
N 243
AD 1.904
P-Value <0.005
bodyweight
Percent
Probability Plot of bodyweight
Normal
The results indicate that there is enough evidence to claim that the body weight was
not normally distributed (AD = 1.904, p-value < .05). This particularly implies that there was
sufficient evidence to reject the null hypothesis which indicates that the data are normally
distributed.
25020015010050
99.9
99
95
90
80
70
60
50
40
30
20
10
5
1
0.1
Mean 146.5
StDev 31.64
N 243
AD 26.620
P-Value <0.005
weightlifted
Percent
Probability Plot of weightlifted
Normal
The results also pointed that the body weight was not normally distributed (AD =
26.620, p-value < .05). Thus, we can confidently conclude that the weight lighted is none
normal.
Paraphrase This Document
Need a fresh take? Get an instant paraphrase of this document with our AI Paraphraser

Surname 5
4540353025201510
99.9
99
95
90
80
70
60
50
40
30
20
10
5
1
0.1
Mean 27.56
StDev 5.067
N 243
AD 0.260
P-Value 0.708
age
Percent
Probability Plot of age
Normal
The normal plot for the age indicates that the age data are normally distributed (AD =
0.260, p-value < .05). This is also evident since most of the data points are within the range
and they follow a specific trend.
To carry out the independent t-test, assumption about equality of variance was tested.
Note that although the data failed to meet the normality assumption, the t-test is robust about
this assumption. Thus, the analysis can still be carried out and valid results obtained
(Anderson et al., 2016). The equality of variance assumption tests results is as follows.
Test
Method DF1 DF2 Statistic P-Value
Bonett — — — 0.299
Levene 1 241 1.77 0.184
The summary table indicates that the equality of variance between the age of the
participants was met (F (1, 241) = 1.77, p-value = 0.184). This means that the male and
female weightlifters had equal variance in the age distribution. Thus, the independent t-test
will use the assumption of equal variances between the groups.
The independent t-test results are as tabulated below.
Two-Sample T-Test and CI: age, gender
Two-sample T for age

Surname 6
gender N Mean StDev SE Mean
Female 125 28.13 5.27 0.47
Male 118 26.96 4.79 0.44
Difference = μ (Female) - μ (Male)
The estimate for difference: 1.175
95% CI for difference: (-0.100, 2.450)
T-Test of difference = 0 (vs ≠): T-Value = 1.82 P-Value = 0.071 DF = 241
Both use Pooled StDev = 5.0435
The results indicate that there is no enough evidence to reject the null hypothesis (T
(241) = 1.82, p-value = 0.071). This implies that there is no significant difference in the age
between the weightlifters by gender. In particular, the average age between the male and
female weightlifters is equal. The 95% confidence interval indicates that the average
difference between female and male was between -0.100 and 2.450. Notably, the confidence
interval contains a zero. This supports the decision to fail to reject the null hypothesis.
Further, assessment to answer the second research question was carried out. But first,
the assumptions were checked. That is, before running simple linear regression analysis was
carried out to determine whether there was a linear relationship between the body weight of
the weightlifters and the maximum weight lifted. The results are as follows.
Probability Plot of age
Correlation: bodyweight, weightlifted
Pearson correlation of bodyweight and weight lifted = 0.870
P-Value = 0.000
The results depict that there is a strong positive correlation between the body weight
and the weight lifted (r = 0.870, p-value < .05). This association is significant. Thus, we can
conclude that linearity assumption is met. Hence, a simple linear regression model can be
fitted (Chatterjee and Hadi 2015).
The regression model was fitted on the data and the results are as illustrated below.
Regression Analysis: weight lifted versus bodyweight
Analysis of Variance
⊘ This is a preview!⊘
Do you want full access?
Subscribe today to unlock all pages.

Trusted by 1+ million students worldwide

Surname 7
Source DF Adj SS Adj MS F-Value P-Value
Regression 1 183162 183162 747.81 0.000
bodyweight 1 183162 183162 747.81 0.000
Error 241 59029 245
Lack-of-Fit 194 52015 268 1.80 0.010
Pure Error 47 7014 149
Total 242 242191
Model Summary
S R-sq R-sq(adj) R-sq(pred)
15.6503 75.63% 75.53% 75.28%
Coefficients
Term Coef SE Coef T-Value P-Value VIF
Constant -34.39 6.69 -5.14 0.000
bodyweight 1.8268 0.0668 27.35 0.000 1.00
Regression Equation
weightlifted = -34.39 + 1.8268 bodyweight
Durbin-Watson Statistic
Durbin-Watson Statistic = 1.91624
As indicated earlier, there is a significant relationship between body weight and the
weight lifted (F (1, 241) = 747.81, p-value < .05). In other words, there was enough evidence
to reject the claim that there is no linear relationship between these two variables. Thus, the
body weight is an ideal predictor of the weight lifted. However, further assessment should be
carried out on the model, to determine whether it is the most appropriate. First, the model
could take into account 75.63% of sources of variation. Based, on this value, this model is
reliable to predict weight lifted. That is, the proportion of variation was high enough to
warrant the prediction of values which are quite close to the actual values of the dependent
variable.
The model indicated that when the weight of the weightlifter increased by one
kilogram, he/she was expected to increase the weight lifted by 1.8268 kilograms. The results
indicated that those with more weight are expected to light more weight.
Residual diagnostics were carried out and the results indicated that the errors were
randomly distributed with no significant trend. In fact, the Durbin-Watson value 1.91624
Paraphrase This Document
Need a fresh take? Get an instant paraphrase of this document with our AI Paraphraser

Surname 8
indicated that the error rate was random. In other words, there was no correlation between the
residuals. This is as illustrated below.
22020018016014012010080
40
20
0
-20
-40
-60
Fitted Value
Residual
Versus Fits
(response is weightlifted)
The residual plot indicates that the residuals are evenly distributed around the zero.
That is, although there seems to be a trend, this relationship is not significant.
Conclusion
The assessment was carried out in alliance with the set research questions. First,
although some of the variables, such as the body weight, and weight lifted failed to meet the
normality test. The report still obtained meaningful and valid results. First, it was found that
there was no evidence that the average age of the weightlifters was significantly different.
Thus, it can be concluded that the average age of the weightlifters was the same. Second, the
findings pointed that there was a significant relationship between the weightlifter’s weight
and the maximum weight lifted. There was a positive relationship, which implied that as the
weight of an individual increase, he or she was expected to light heavier weights.

Surname 9
References
Anderson, D.R., Sweeney, D.J., Williams, T.A., Camm, J.D. and Cochran, J.J., 2016.
Statistics for business & economics. Nelson Education.
Chatterjee, S. and Hadi, A.S., 2015. Regression analysis by example. John Wiley & Sons.
Keller, G., 2014. Statistics for management and economics. Nelson Education.
Tackett, C. (2017). Factors Affecting Muscular Strength. [online] Afpafitness.com. Available
at: https://www.afpafitness.com/research-articles/factors-affecting-muscular-strength
[Accessed 29 May 2018].
⊘ This is a preview!⊘
Do you want full access?
Subscribe today to unlock all pages.

Trusted by 1+ million students worldwide
1 out of 9