StatCrunch Assignment 3: Statistical Analysis of Population Proportion

Verified

Added on  2023/06/10

|5
|1011
|137
Homework Assignment
AI Summary
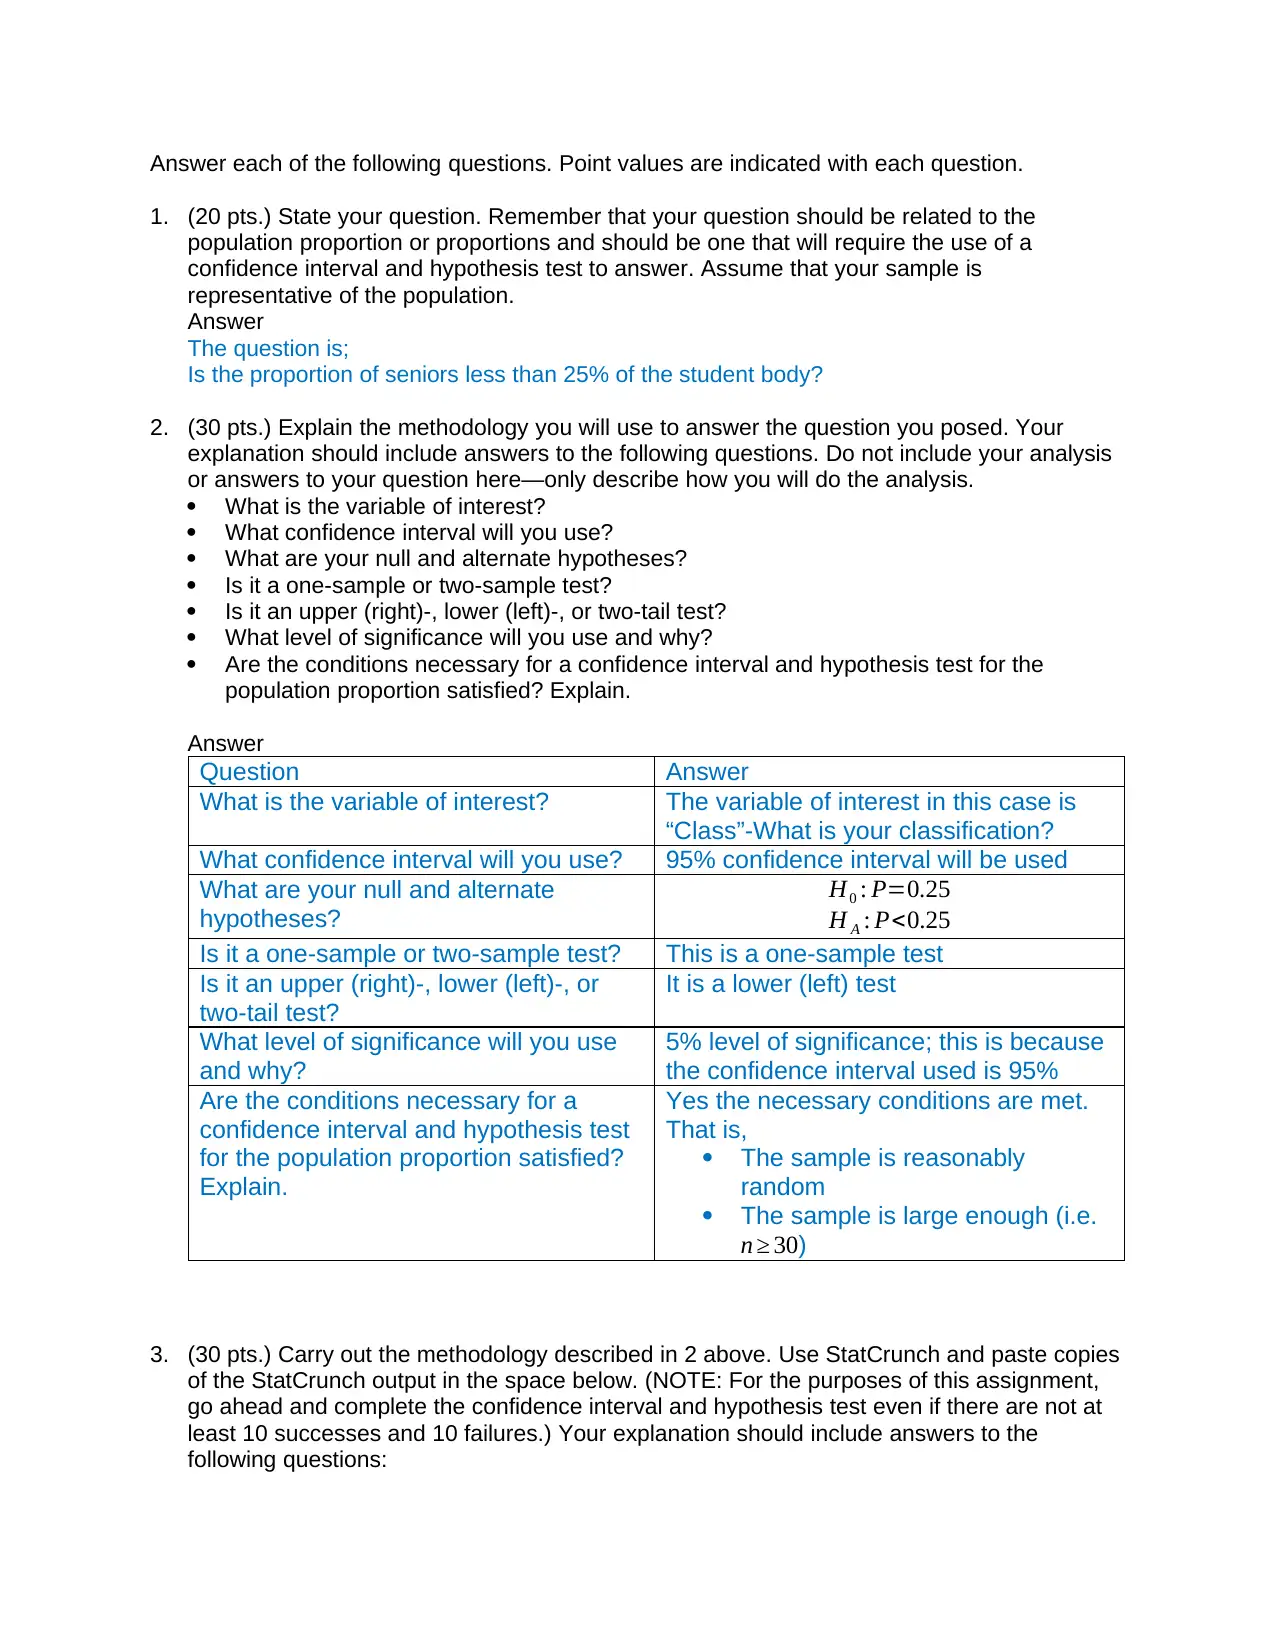
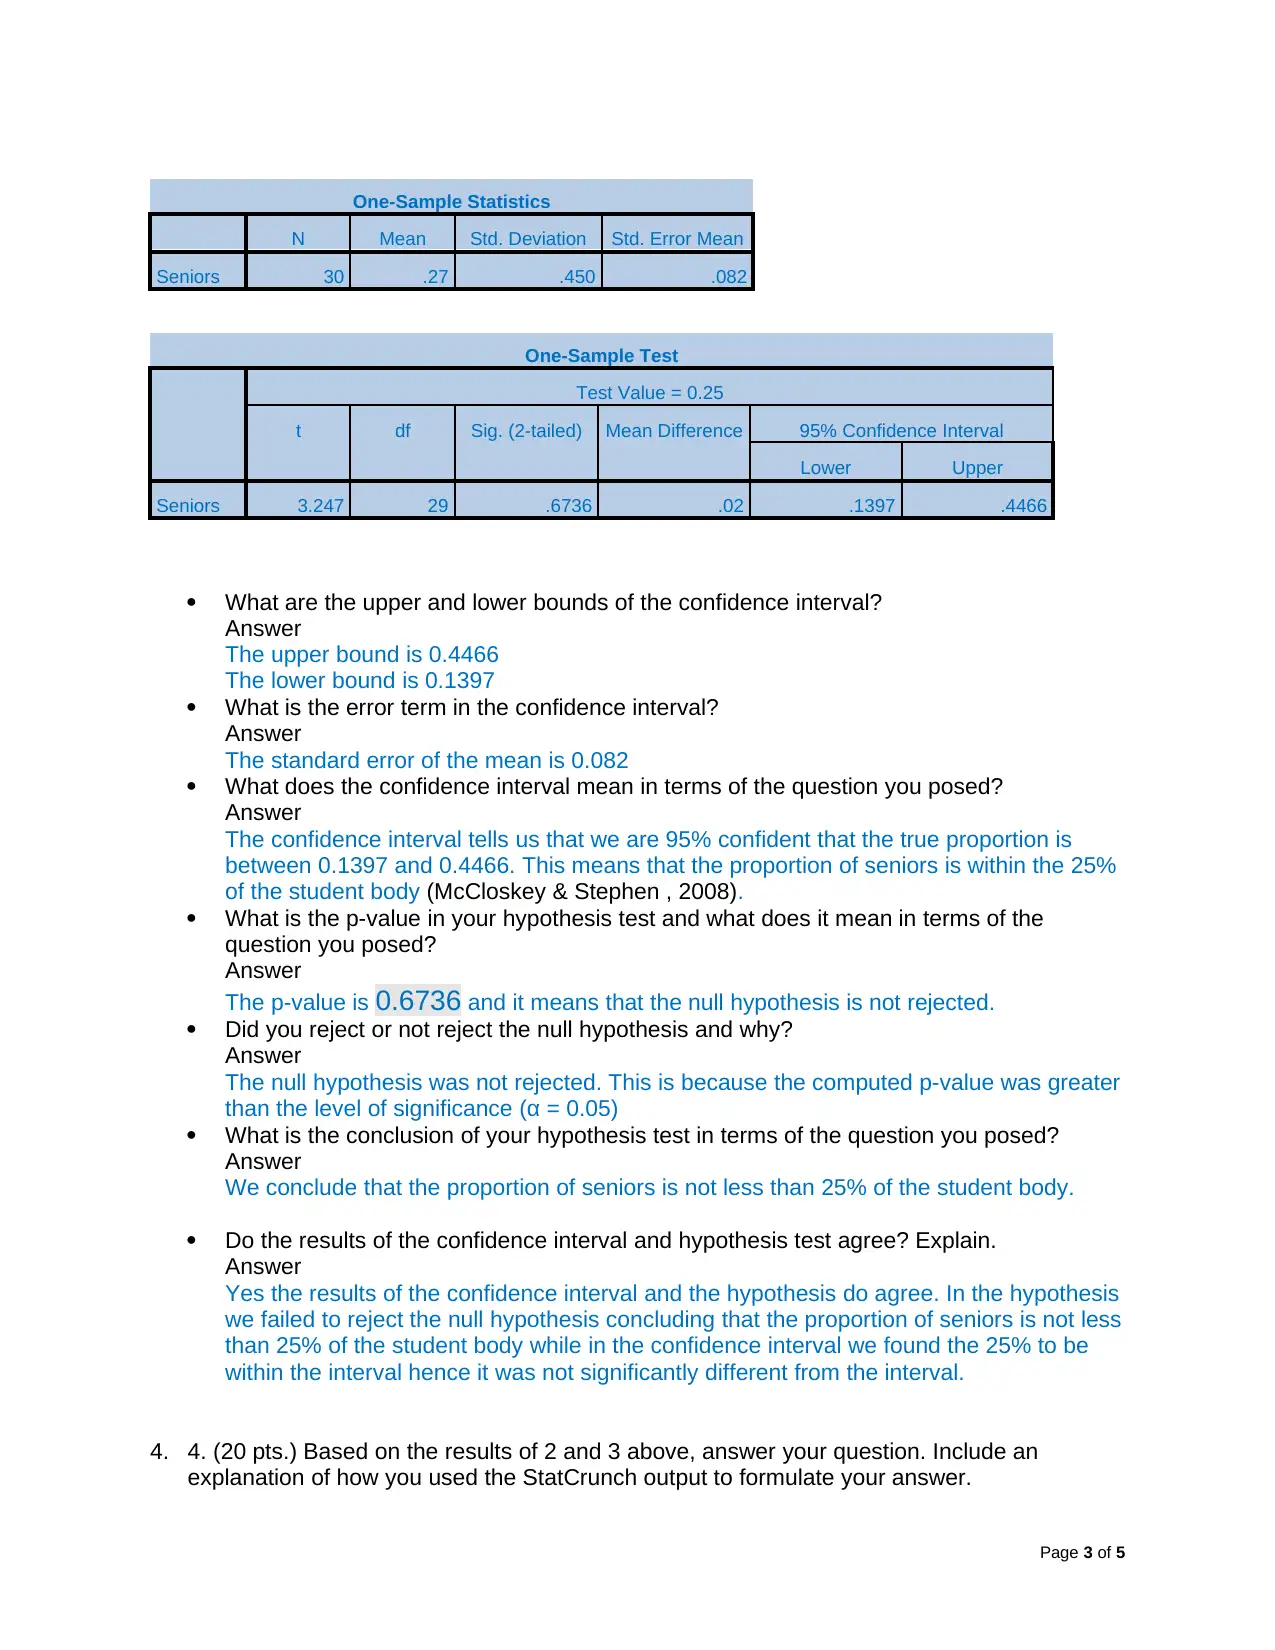
This StatCrunch assignment addresses a question related to population proportion, specifically whether the proportion of seniors is less than 25% of the student body. The methodology involves defining the variable of interest as 'Class,' using a 95% confidence interval, and setting up null and alternative hypotheses (H0: P=0.25, HA: P<0.25). A one-sample, lower-tail test is conducted at a 5% significance level. The StatCrunch output provides the confidence interval bounds (0.1397 to 0.4466) and a p-value of 0.6736. The analysis concludes that the null hypothesis is not rejected, indicating that the proportion of seniors is not less than 25% of the student body, and the confidence interval supports this conclusion. The assignment demonstrates the application of statistical methods to answer a specific research question using StatCrunch.
Document Page
StatCrunch
StatCrunch Assignment 3
StatCrunch Assignment
Name:
Institution:
24th July 2018
tabler-icon-diamond-filled.svg

Paraphrase This Document

Need a fresh take? Get an instant paraphrase of this document with our AI Paraphraser
Document Page
Answer each of the following questions. Point values are indicated with each question.
1. (20 pts.) State your question. Remember that your question should be related to the
population proportion or proportions and should be one that will require the use of a
confidence interval and hypothesis test to answer. Assume that your sample is
representative of the population.
Answer
The question is;
Is the proportion of seniors less than 25% of the student body?
2. (30 pts.) Explain the methodology you will use to answer the question you posed. Your
explanation should include answers to the following questions. Do not include your analysis
or answers to your question here—only describe how you will do the analysis.
What is the variable of interest?
What confidence interval will you use?
What are your null and alternate hypotheses?
Is it a one-sample or two-sample test?
Is it an upper (right)-, lower (left)-, or two-tail test?
What level of significance will you use and why?
Are the conditions necessary for a confidence interval and hypothesis test for the
population proportion satisfied? Explain.
Answer
Question Answer
What is the variable of interest? The variable of interest in this case is
“Class”-What is your classification?
What confidence interval will you use? 95% confidence interval will be used
What are your null and alternate
hypotheses?
H0 : P=0.25
H A : P<0.25
Is it a one-sample or two-sample test? This is a one-sample test
Is it an upper (right)-, lower (left)-, or
two-tail test?
It is a lower (left) test
What level of significance will you use
and why?
5% level of significance; this is because
the confidence interval used is 95%
Are the conditions necessary for a
confidence interval and hypothesis test
for the population proportion satisfied?
Explain.
Yes the necessary conditions are met.
That is,
The sample is reasonably
random
The sample is large enough (i.e.
n 30)
3. (30 pts.) Carry out the methodology described in 2 above. Use StatCrunch and paste copies
of the StatCrunch output in the space below. (NOTE: For the purposes of this assignment,
go ahead and complete the confidence interval and hypothesis test even if there are not at
least 10 successes and 10 failures.) Your explanation should include answers to the
following questions:
Document Page
One-Sample Statistics
N Mean Std. Deviation Std. Error Mean
Seniors 30 .27 .450 .082
One-Sample Test
Test Value = 0.25
t df Sig. (2-tailed) Mean Difference 95% Confidence Interval
Lower Upper
Seniors 3.247 29 .6736 .02 .1397 .4466
What are the upper and lower bounds of the confidence interval?
Answer
The upper bound is 0.4466
The lower bound is 0.1397
What is the error term in the confidence interval?
Answer
The standard error of the mean is 0.082
What does the confidence interval mean in terms of the question you posed?
Answer
The confidence interval tells us that we are 95% confident that the true proportion is
between 0.1397 and 0.4466. This means that the proportion of seniors is within the 25%
of the student body (McCloskey & Stephen , 2008).
What is the p-value in your hypothesis test and what does it mean in terms of the
question you posed?
Answer
The p-value is 0.6736 and it means that the null hypothesis is not rejected.
Did you reject or not reject the null hypothesis and why?
Answer
The null hypothesis was not rejected. This is because the computed p-value was greater
than the level of significance (α = 0.05)
What is the conclusion of your hypothesis test in terms of the question you posed?
Answer
We conclude that the proportion of seniors is not less than 25% of the student body.
Do the results of the confidence interval and hypothesis test agree? Explain.
Answer
Yes the results of the confidence interval and the hypothesis do agree. In the hypothesis
we failed to reject the null hypothesis concluding that the proportion of seniors is not less
than 25% of the student body while in the confidence interval we found the 25% to be
within the interval hence it was not significantly different from the interval.
4. 4. (20 pts.) Based on the results of 2 and 3 above, answer your question. Include an
explanation of how you used the StatCrunch output to formulate your answer.
Page 3 of 5
Document Page
Answer
From the above, we conclude that the proportion of seniors is not less than 25% of the
student body. The StatCrunch output helped me formulate the answer by considering the
key components of the output. The output considered include upper and lower bounds of the
confidence interval, the p-value and the standard error (Barde, 2012).
tabler-icon-diamond-filled.svg

Paraphrase This Document

Need a fresh take? Get an instant paraphrase of this document with our AI Paraphraser
Document Page
References
Barde, M. (2012). What to use to express the variability of data: Standard deviation or standard error of
mean?". Journal of the Royal Statistical Society, 3(3), 113–116.
McCloskey, D. N., & Stephen , T. Z. (2008). The Cult of Statistical Significance: How the Standard Error
Costs Us Jobs, Justice, and Lives. 25-37.
Page 5 of 5
chevron_up_icon
1 out of 5
circle_padding
hide_on_mobile
zoom_out_icon