Market Research Report: Stationeries and I.T Equipment, Kent Institute
VerifiedAdded on 2020/04/01
|16
|3037
|38
Report
AI Summary
This market research report investigates the demand for stationeries and I.T. equipment among students at Kent Institute, Australia. The study aimed to determine preferred pen ink colors, the relationship between course units and pen usage, and the connection between courses involving calculations and book usage. A questionnaire was administered to a sample of 20 students, gathering demographic information and data on stationery and I.T. equipment preferences. The findings revealed a correlation between course units and pen usage, a positive relationship between calculation-based courses and book usage, and a preference for blue pen ink. The report includes an executive summary, introduction, methods of data collection, data analysis, hypothesis testing, and conclusions, along with tables, figures, and appendices containing the questionnaire and supplementary data.
MARKET RESEARCH FOR STATIONERIES AND I.T EQUIPMENT IN KENT
INSTITUTE AUSTRALIA.
i
INSTITUTE AUSTRALIA.
i
Paraphrase This Document
Need a fresh take? Get an instant paraphrase of this document with our AI Paraphraser
Executive summary
The purpose for this market report was for the purpose of determining the need for stationeries
and I.T equipment that could be needed by the students in Kent institute. As a result, among
other things, the report aimed to meet the following three objectives; to determine the most
preferred pen ink color by the students in Kent institute, to determine the relationship between
the course units and the number of pens used by the students in the semester and To determine
the relationship between the course involving calculations and the number of books used per
semester by the students. A population of about over 6000 students was targeted out of which a
sample of 20 students was used. Demographic information among other aspects concerning the
topic of focus was asked for in the questionnaire that was used as a tool of collecting data. The
report concluded that the results showed that there was a relationship existing between the
numbers of course units that were being taken by the students per semester and the number of
pens used in the same semester. Additionally, a relatively strong positive correlation between
courses that involved calculations and the number of books used in a semester and lastly, the
most preferred pen ink color was found out to be blue over other pen ink colors.
ii
Table of contents
Contents
Executive summary……………………………………………………………………………………………………………..…………..ii
Introduction …………………………………………………………………………………………………………………………………….1
Methods of data collection……………………………………………………………………………………………………………….2
Summary of the data set…………………………………………………………………………………………………………………..4
Data analysis…………………………………………………………………………………………………………………………………....8
Hypothesis testing…………………………………………………………………………………………………………………………….8
Conclusion and recommendations……………………………………………………………………………………………….…..9
References ……………………………………………………………………………………………………………………….……….……10
Appendices A: Questionnaire………………………………………………………………………………………………………….11
Appendix B: Other variable tables……………………………………………………………………..……………..…………….12
Appendix C: Hypotheses…………………………………………………………………………………………………..…………….13
List of tables
Table 1: Dataset………………………………………………………………………………………………..………………………………3
Table 2: Sex of the respondents…………………………………………………………………………………………….4
Table 3: Number of units done………………………………………………………………………………………………5
Table 4: Number of pens used per semester……………………………………………………………….…………….6
Table 5: Course involving arithmetic calculation…………………………………………………………..…………….6
Table 6: Number of books per semester……………………………………………………………………….………….7
Table 7: Pen Ink color………………………………………………………………………………………………..………..7
Table 8: Correlations…………………………………………………………………………………………………..………8
List of figures
Figure 1: Age of the sampled students……………………………..……………………………………………………………….5
iii
⊘ This is a preview!⊘
Do you want full access?
Subscribe today to unlock all pages.
Trusted by 1+ million students worldwide
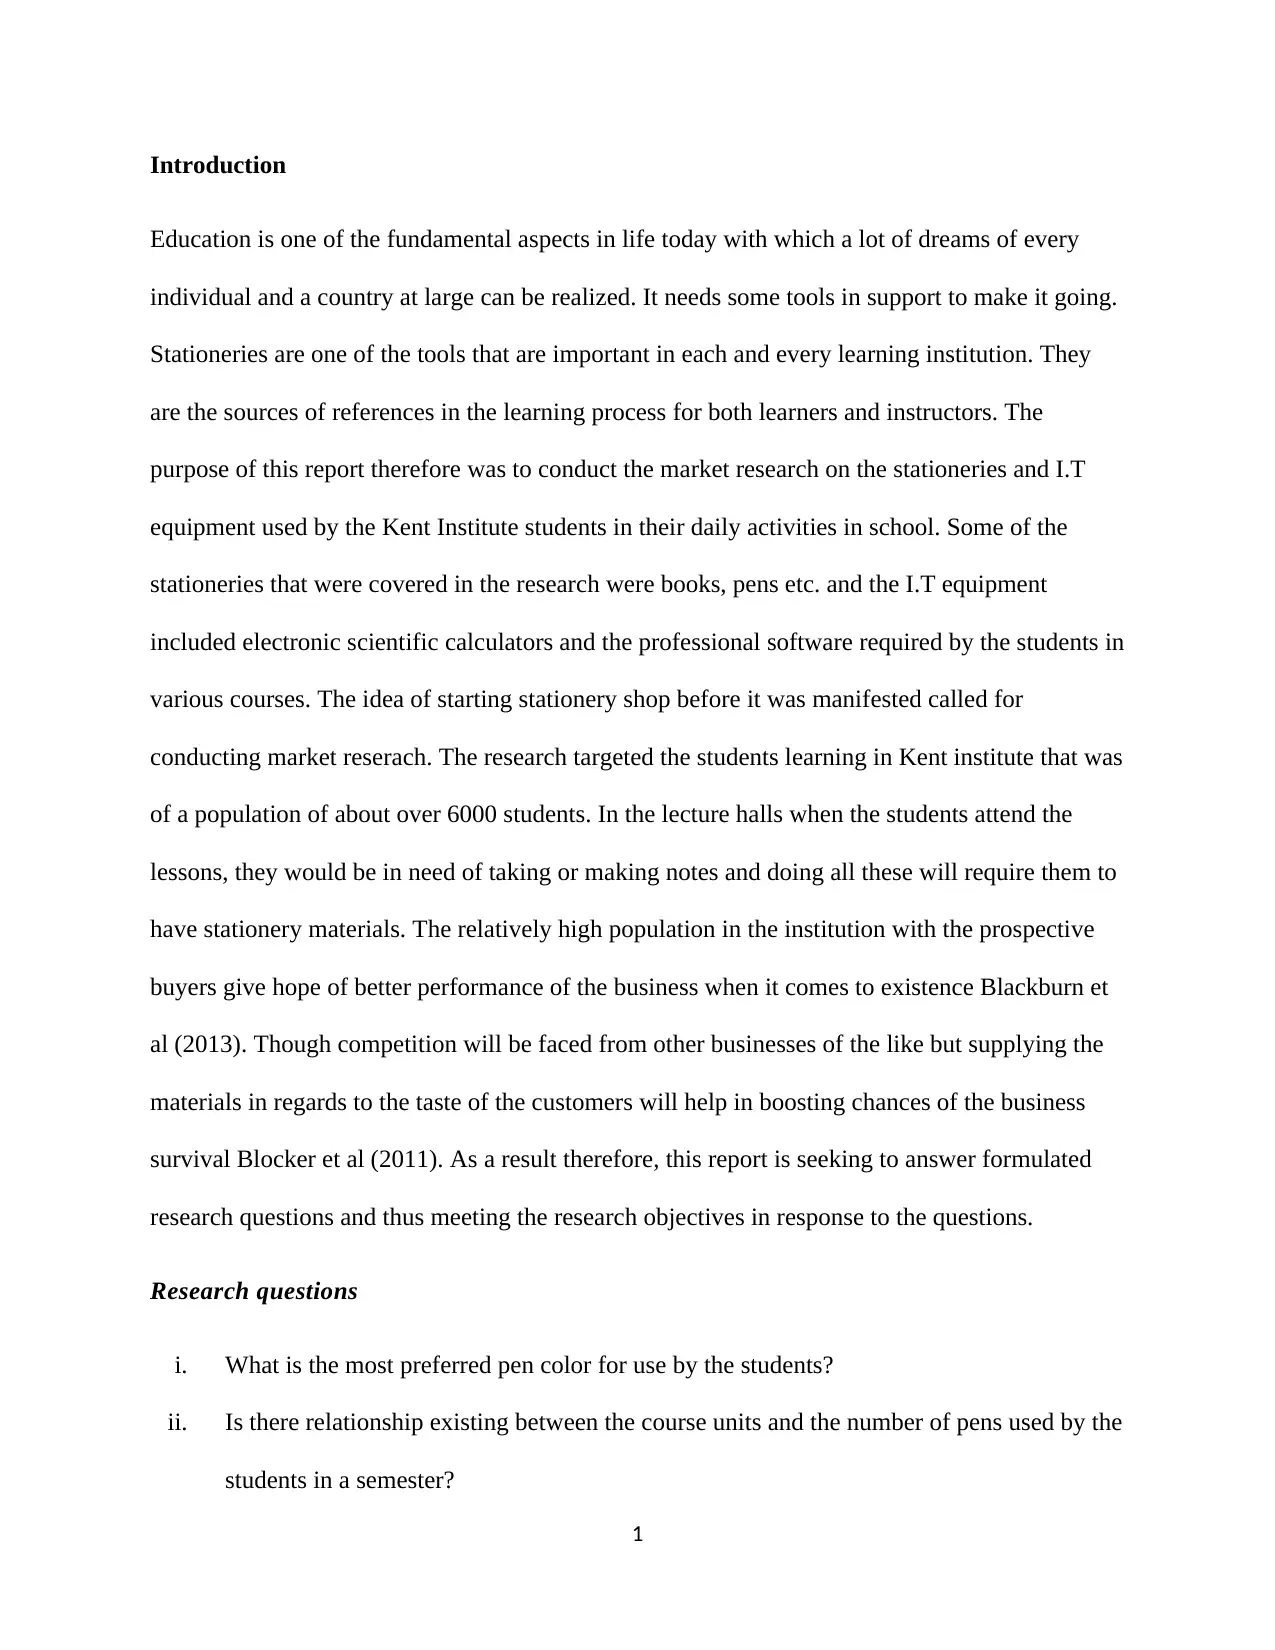
Introduction
Education is one of the fundamental aspects in life today with which a lot of dreams of every
individual and a country at large can be realized. It needs some tools in support to make it going.
Stationeries are one of the tools that are important in each and every learning institution. They
are the sources of references in the learning process for both learners and instructors. The
purpose of this report therefore was to conduct the market research on the stationeries and I.T
equipment used by the Kent Institute students in their daily activities in school. Some of the
stationeries that were covered in the research were books, pens etc. and the I.T equipment
included electronic scientific calculators and the professional software required by the students in
various courses. The idea of starting stationery shop before it was manifested called for
conducting market reserach. The research targeted the students learning in Kent institute that was
of a population of about over 6000 students. In the lecture halls when the students attend the
lessons, they would be in need of taking or making notes and doing all these will require them to
have stationery materials. The relatively high population in the institution with the prospective
buyers give hope of better performance of the business when it comes to existence Blackburn et
al (2013). Though competition will be faced from other businesses of the like but supplying the
materials in regards to the taste of the customers will help in boosting chances of the business
survival Blocker et al (2011). As a result therefore, this report is seeking to answer formulated
research questions and thus meeting the research objectives in response to the questions.
Research questions
i. What is the most preferred pen color for use by the students?
ii. Is there relationship existing between the course units and the number of pens used by the
students in a semester?
1
Paraphrase This Document
Need a fresh take? Get an instant paraphrase of this document with our AI Paraphraser
iii. Is there any relationship existing between the courses involving calculations and the
number of books used per semester?
Research objectives
Response to the above research questions would lead to meeting the following specific research
objectives;
i. To determine the most preferred pen ink color by the students in Kent institute.
ii. To determine the relationship between the course units and the number of pens used by
the students in the semester
iii. To determine the relationship between the course involving calculations and the number
of books used per semester by the students
Methods of data collection
In the survey, questionnaires were used to collect and gather data from a sample size of 20
respondents. The questionnaire was structured with a total of 10 questions asking for various
responses. The types of questions that were used in structuring the questionnaire were closed
ended questions. This type of questions was preferred due to their simplicity at the time of data
analysis and reducing the data bulk as to when open ended questions were used Roberts et al
(2014). They further make coding of the responses very easy and then the analysis Percy et al
(2015). A total of 10 variables corresponding to the 10 questions were prepared as from the
questionnaires. Variables such as Sex, Software etc. were nominal variables and Age, Units,
number of pens etc. are the examples of scale measure variables. The targeted population in this
report was about over 6000 students of Kent institute Australia. From the population, a sample
2
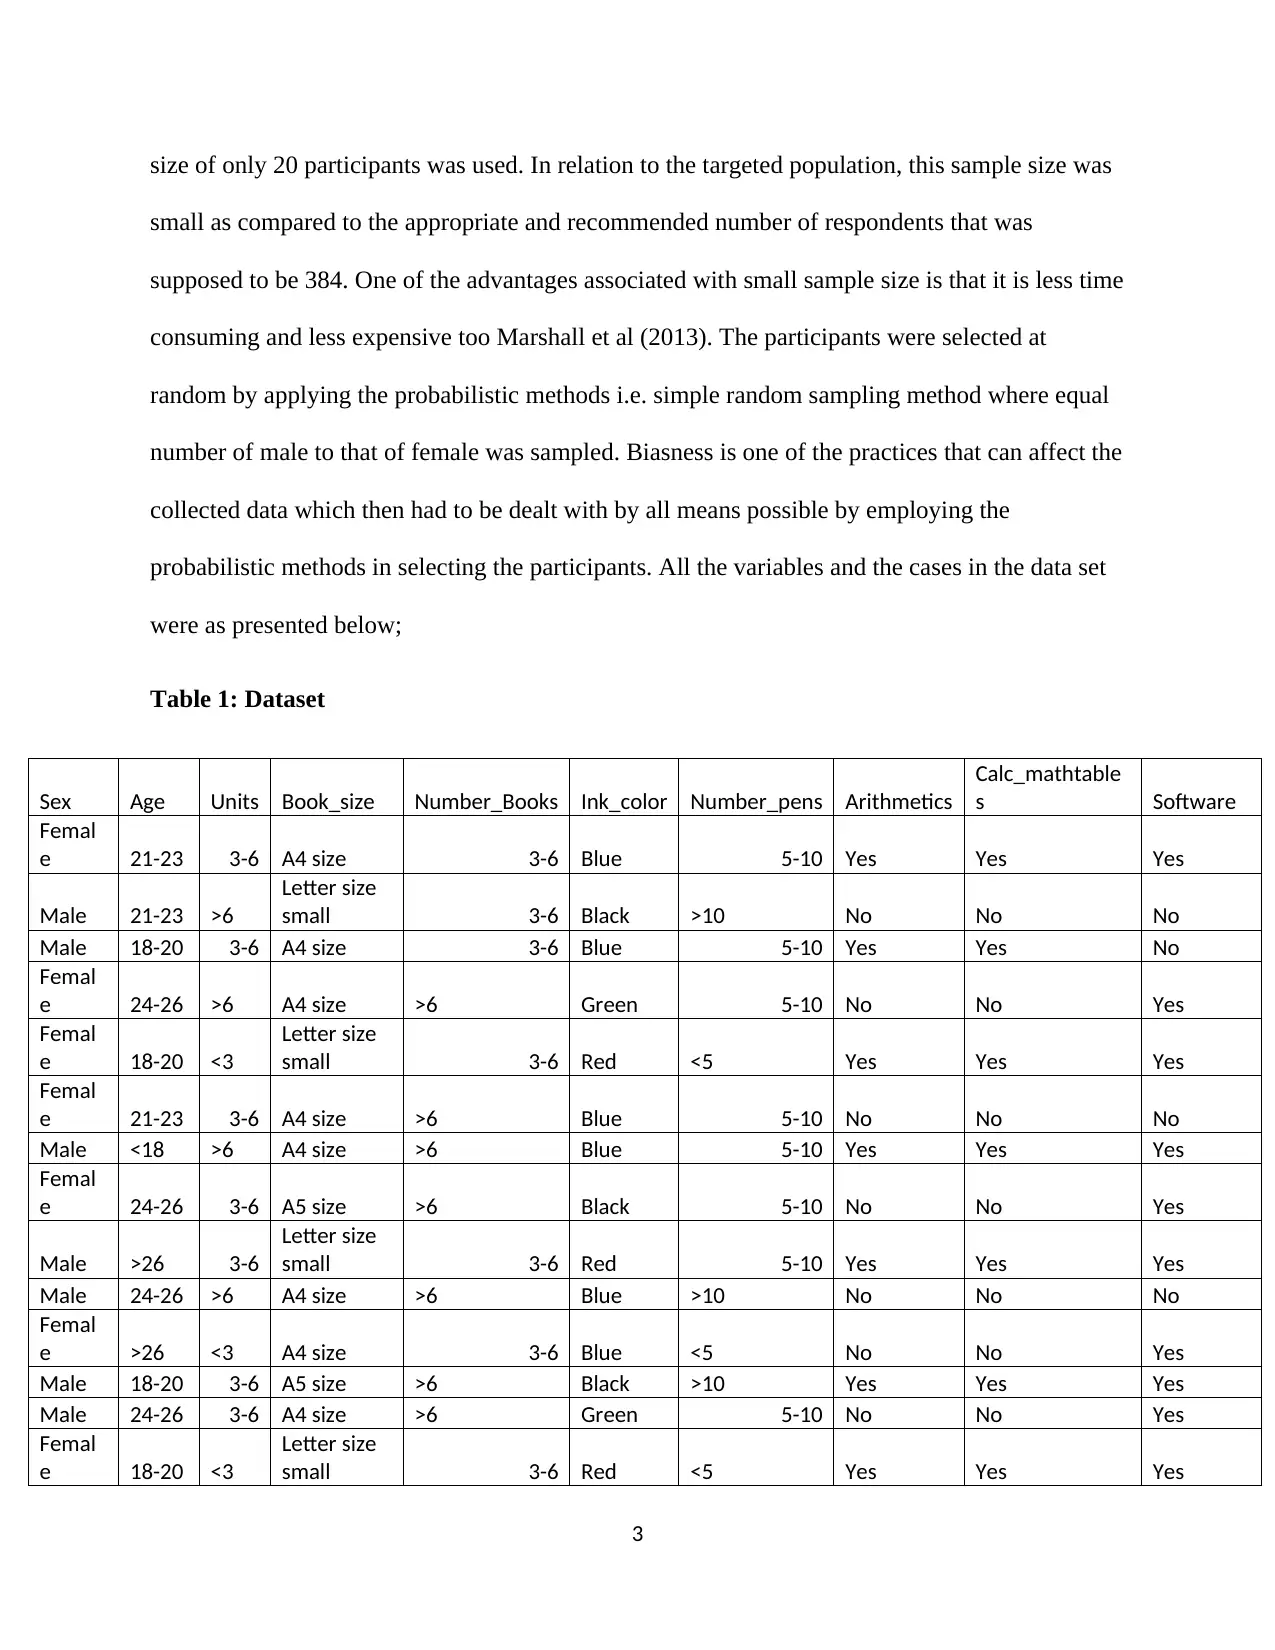
size of only 20 participants was used. In relation to the targeted population, this sample size was
small as compared to the appropriate and recommended number of respondents that was
supposed to be 384. One of the advantages associated with small sample size is that it is less time
consuming and less expensive too Marshall et al (2013). The participants were selected at
random by applying the probabilistic methods i.e. simple random sampling method where equal
number of male to that of female was sampled. Biasness is one of the practices that can affect the
collected data which then had to be dealt with by all means possible by employing the
probabilistic methods in selecting the participants. All the variables and the cases in the data set
were as presented below;
Table 1: Dataset
Sex Age Units Book_size Number_Books Ink_color Number_pens Arithmetics
Calc_mathtable
s Software
Femal
e 21-23 3-6 A4 size 3-6 Blue 5-10 Yes Yes Yes
Male 21-23 >6
Letter size
small 3-6 Black >10 No No No
Male 18-20 3-6 A4 size 3-6 Blue 5-10 Yes Yes No
Femal
e 24-26 >6 A4 size >6 Green 5-10 No No Yes
Femal
e 18-20 <3
Letter size
small 3-6 Red <5 Yes Yes Yes
Femal
e 21-23 3-6 A4 size >6 Blue 5-10 No No No
Male <18 >6 A4 size >6 Blue 5-10 Yes Yes Yes
Femal
e 24-26 3-6 A5 size >6 Black 5-10 No No Yes
Male >26 3-6
Letter size
small 3-6 Red 5-10 Yes Yes Yes
Male 24-26 >6 A4 size >6 Blue >10 No No No
Femal
e >26 <3 A4 size 3-6 Blue <5 No No Yes
Male 18-20 3-6 A5 size >6 Black >10 Yes Yes Yes
Male 24-26 3-6 A4 size >6 Green 5-10 No No Yes
Femal
e 18-20 <3
Letter size
small 3-6 Red <5 Yes Yes Yes
3
⊘ This is a preview!⊘
Do you want full access?
Subscribe today to unlock all pages.
Trusted by 1+ million students worldwide
Femal
e 21-23 3-6 A4 size >6 Blue 5-10 No No No
Male 18-20 >6 A4 size >6 Blue 5-10 Yes Yes Yes
Femal
e 24-26 3-6 A5 size >6 Black 5-10 No No Yes
Male >26 3-6 A5 size 3-6 Red >10 Yes Yes Yes
Male 24-26 >6 A4 size >6 Black <5 No No Yes
Femal
e 21-23 3-6
Letter size
small 3-6 Green 5-10 Yes Yes Yes
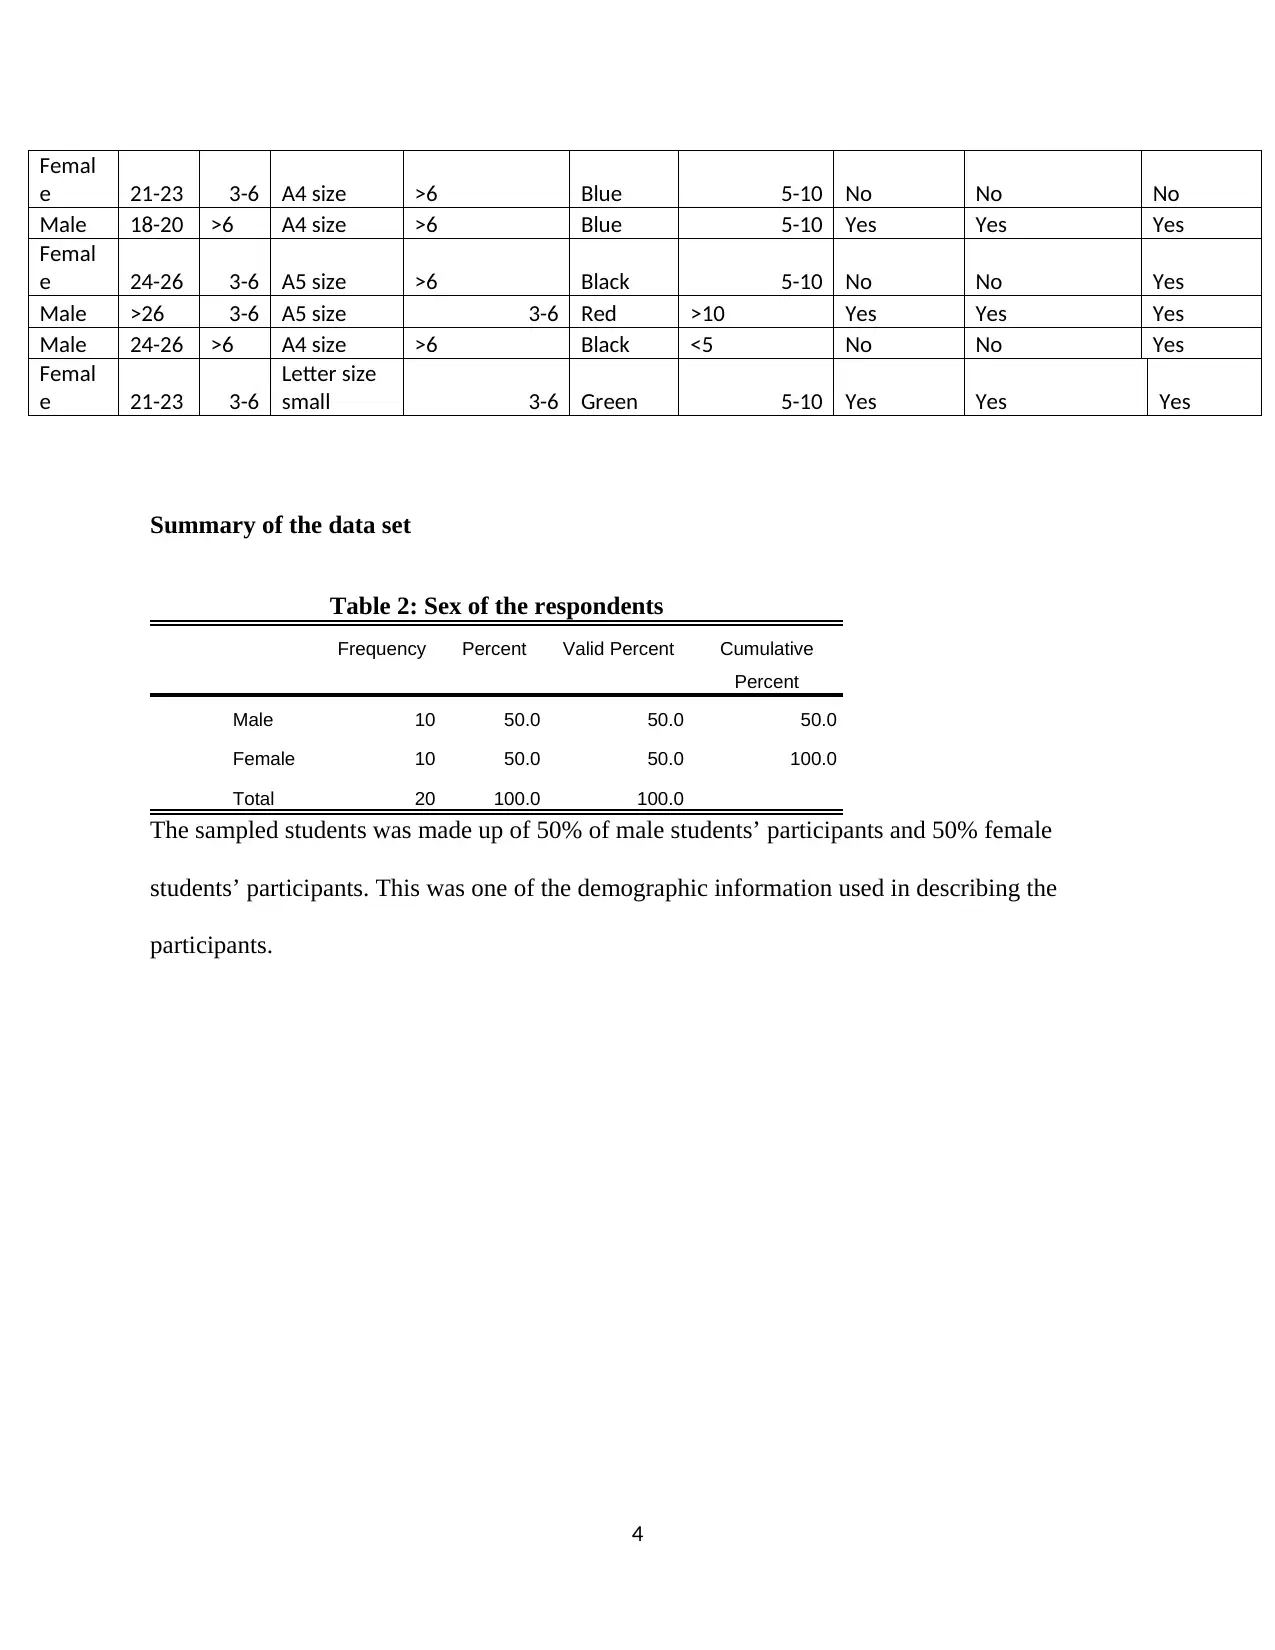
Summary of the data set
Table 2: Sex of the respondents
Frequency Percent Valid Percent Cumulative
Percent
Male 10 50.0 50.0 50.0
Female 10 50.0 50.0 100.0
Total 20 100.0 100.0
The sampled students was made up of 50% of male students’ participants and 50% female
students’ participants. This was one of the demographic information used in describing the
participants.
4
e 21-23 3-6 A4 size >6 Blue 5-10 No No No
Male 18-20 >6 A4 size >6 Blue 5-10 Yes Yes Yes
Femal
e 24-26 3-6 A5 size >6 Black 5-10 No No Yes
Male >26 3-6 A5 size 3-6 Red >10 Yes Yes Yes
Male 24-26 >6 A4 size >6 Black <5 No No Yes
Femal
e 21-23 3-6
Letter size
small 3-6 Green 5-10 Yes Yes Yes
Summary of the data set
Table 2: Sex of the respondents
Frequency Percent Valid Percent Cumulative
Percent
Male 10 50.0 50.0 50.0
Female 10 50.0 50.0 100.0
Total 20 100.0 100.0
The sampled students was made up of 50% of male students’ participants and 50% female
students’ participants. This was one of the demographic information used in describing the
participants.
4
Paraphrase This Document
Need a fresh take? Get an instant paraphrase of this document with our AI Paraphraser

Figure 1: Age of the sampled students
From the figure above, the students who were sampled had their ages varied as follows; those
with their ages <18 years were represented by 5%, 18-20 years were represented by 25%, 21-23
years were represented by 25%, 24-26years were represented by 30% and lastly, the students
who responded that their ages were >26 was represented by 15%.
Table 3: Number of units done
Frequency Percent Valid Percent Cumulative
Percent
<3 3 15.0 15.0 15.0
5
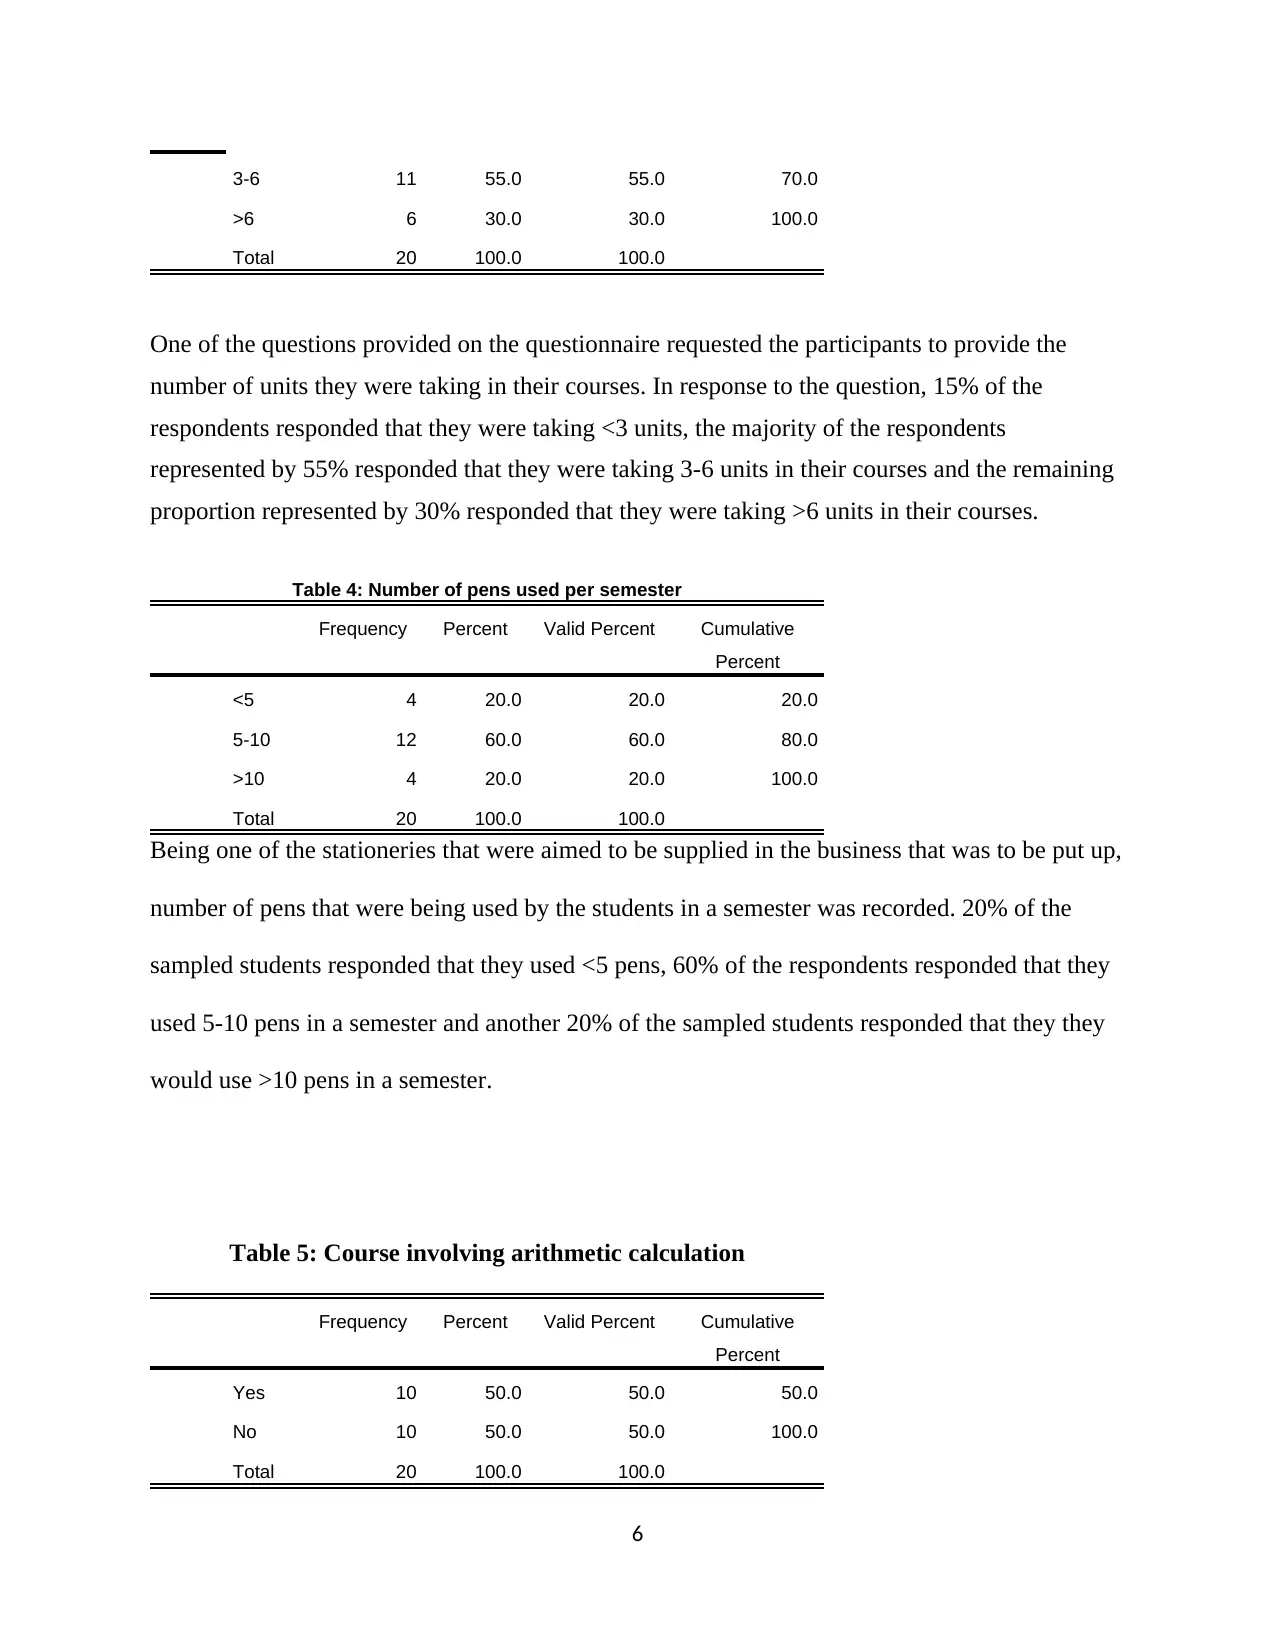
3-6 11 55.0 55.0 70.0
>6 6 30.0 30.0 100.0
Total 20 100.0 100.0
One of the questions provided on the questionnaire requested the participants to provide the
number of units they were taking in their courses. In response to the question, 15% of the
respondents responded that they were taking <3 units, the majority of the respondents
represented by 55% responded that they were taking 3-6 units in their courses and the remaining
proportion represented by 30% responded that they were taking >6 units in their courses.
Table 4: Number of pens used per semester
Frequency Percent Valid Percent Cumulative
Percent
<5 4 20.0 20.0 20.0
5-10 12 60.0 60.0 80.0
>10 4 20.0 20.0 100.0
Total 20 100.0 100.0
Being one of the stationeries that were aimed to be supplied in the business that was to be put up,
number of pens that were being used by the students in a semester was recorded. 20% of the
sampled students responded that they used <5 pens, 60% of the respondents responded that they
used 5-10 pens in a semester and another 20% of the sampled students responded that they they
would use >10 pens in a semester.
Table 5: Course involving arithmetic calculation
Frequency Percent Valid Percent Cumulative
Percent
Yes 10 50.0 50.0 50.0
No 10 50.0 50.0 100.0
Total 20 100.0 100.0
6
⊘ This is a preview!⊘
Do you want full access?
Subscribe today to unlock all pages.
Trusted by 1+ million students worldwide
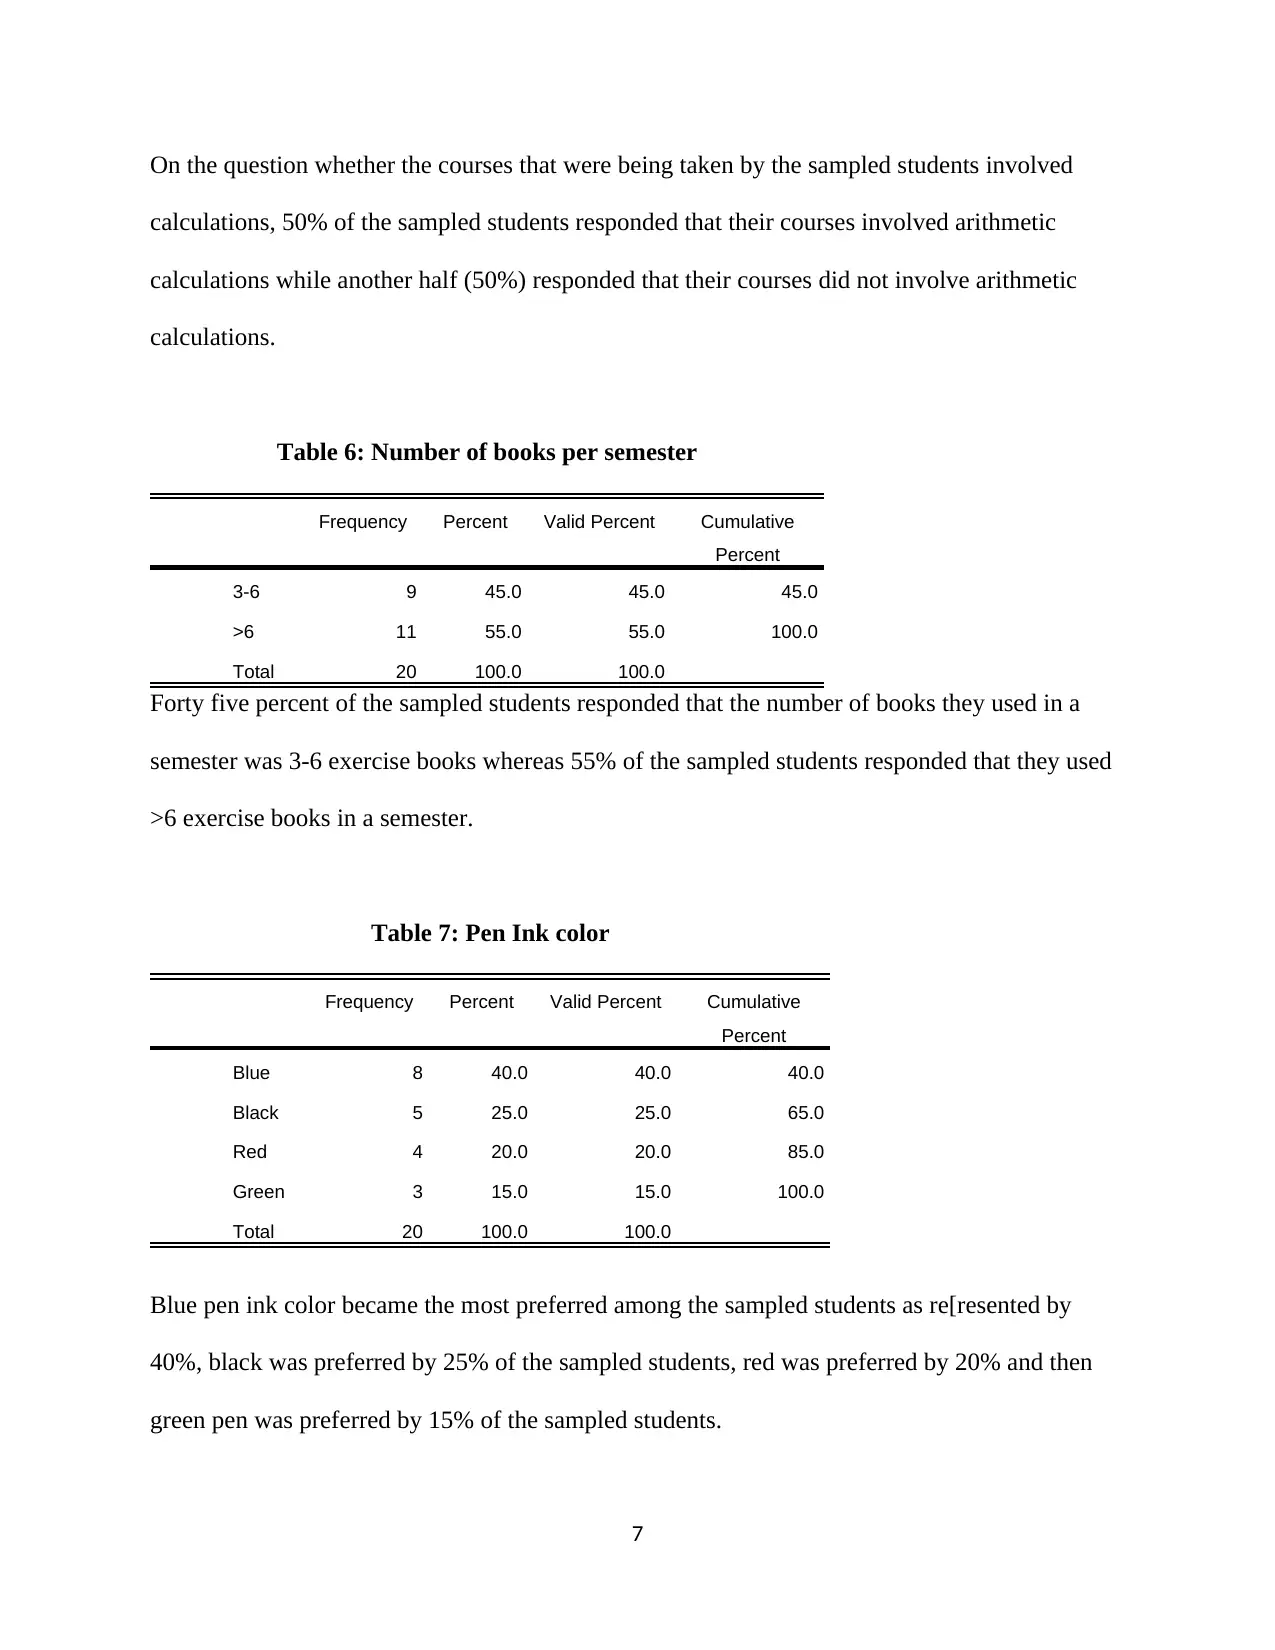
On the question whether the courses that were being taken by the sampled students involved
calculations, 50% of the sampled students responded that their courses involved arithmetic
calculations while another half (50%) responded that their courses did not involve arithmetic
calculations.
Table 6: Number of books per semester
Frequency Percent Valid Percent Cumulative
Percent
3-6 9 45.0 45.0 45.0
>6 11 55.0 55.0 100.0
Total 20 100.0 100.0
Forty five percent of the sampled students responded that the number of books they used in a
semester was 3-6 exercise books whereas 55% of the sampled students responded that they used
>6 exercise books in a semester.
Table 7: Pen Ink color
Frequency Percent Valid Percent Cumulative
Percent
Blue 8 40.0 40.0 40.0
Black 5 25.0 25.0 65.0
Red 4 20.0 20.0 85.0
Green 3 15.0 15.0 100.0
Total 20 100.0 100.0
Blue pen ink color became the most preferred among the sampled students as re[resented by
40%, black was preferred by 25% of the sampled students, red was preferred by 20% and then
green pen was preferred by 15% of the sampled students.
7
Paraphrase This Document
Need a fresh take? Get an instant paraphrase of this document with our AI Paraphraser
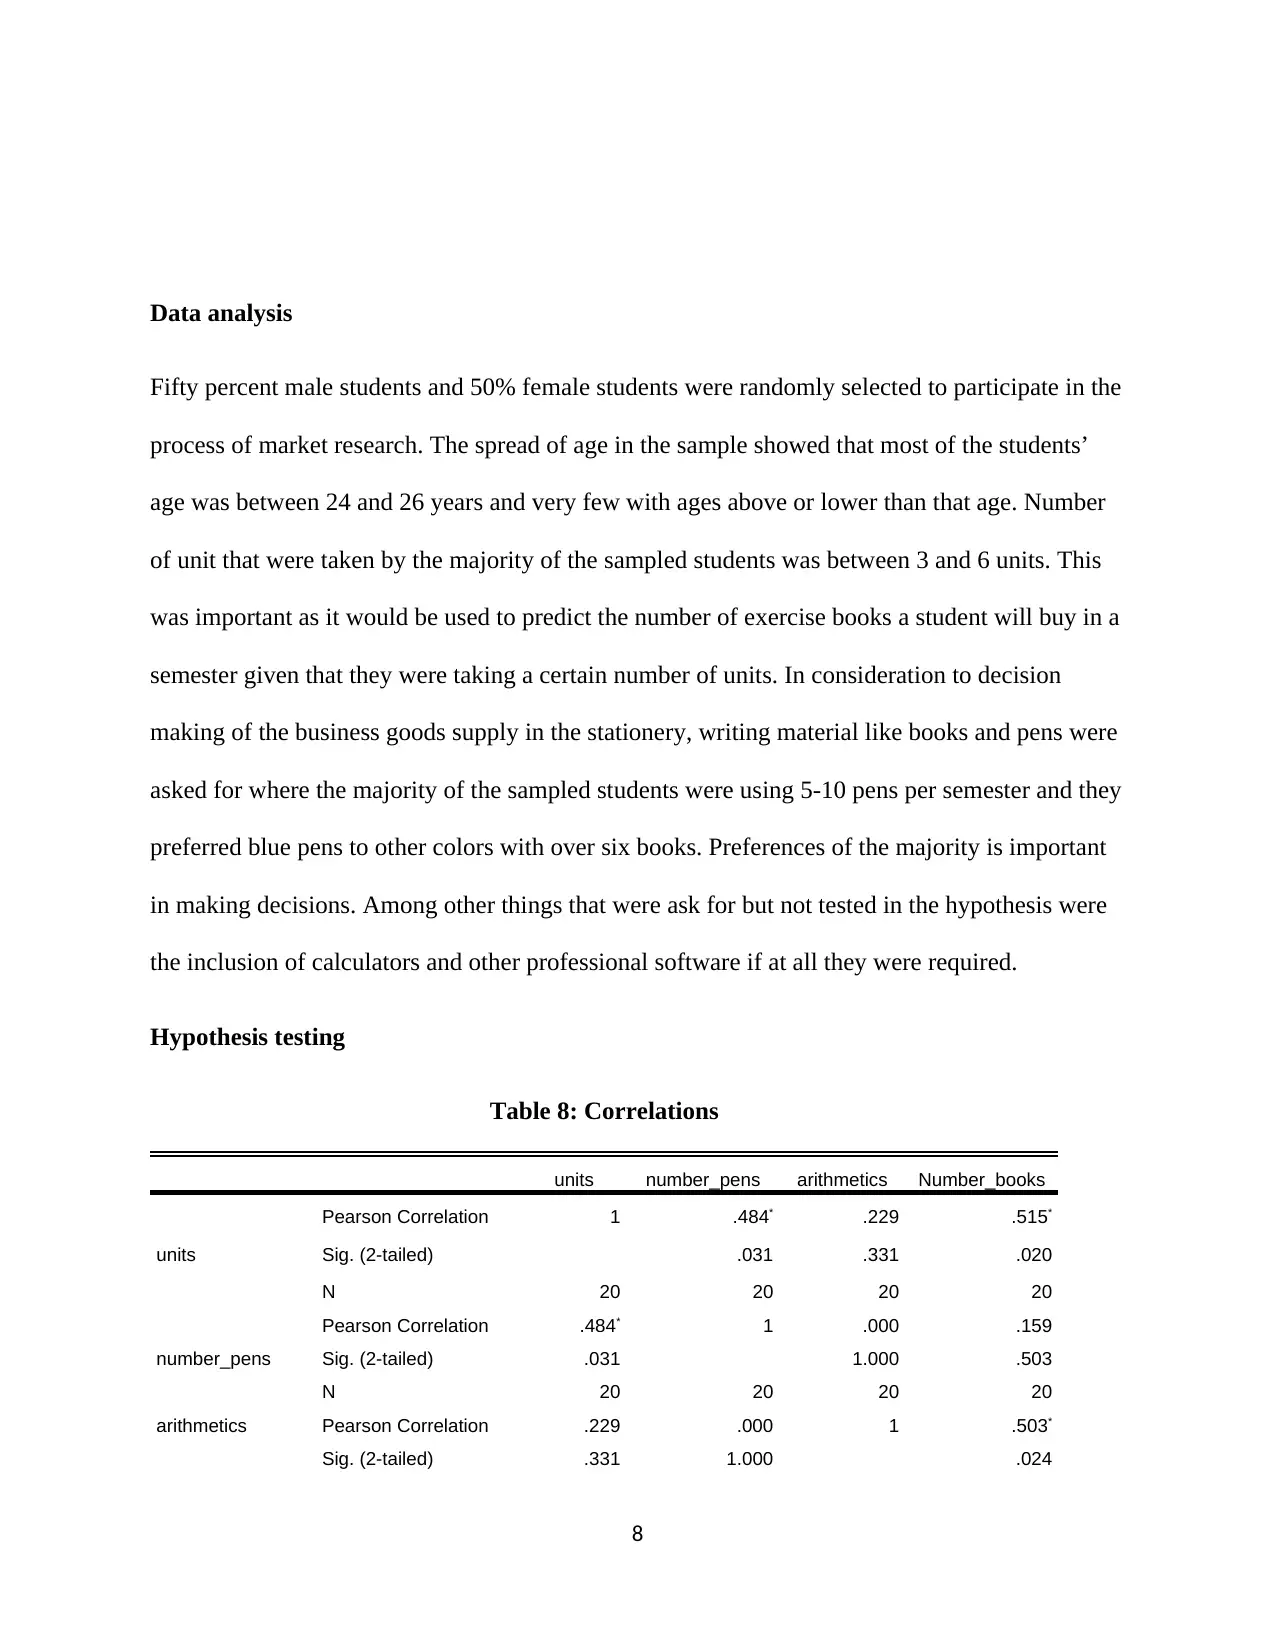
Data analysis
Fifty percent male students and 50% female students were randomly selected to participate in the
process of market research. The spread of age in the sample showed that most of the students’
age was between 24 and 26 years and very few with ages above or lower than that age. Number
of unit that were taken by the majority of the sampled students was between 3 and 6 units. This
was important as it would be used to predict the number of exercise books a student will buy in a
semester given that they were taking a certain number of units. In consideration to decision
making of the business goods supply in the stationery, writing material like books and pens were
asked for where the majority of the sampled students were using 5-10 pens per semester and they
preferred blue pens to other colors with over six books. Preferences of the majority is important
in making decisions. Among other things that were ask for but not tested in the hypothesis were
the inclusion of calculators and other professional software if at all they were required.
Hypothesis testing
Table 8: Correlations
units number_pens arithmetics Number_books
units
Pearson Correlation 1 .484* .229 .515*
Sig. (2-tailed) .031 .331 .020
N 20 20 20 20
number_pens
Pearson Correlation .484* 1 .000 .159
Sig. (2-tailed) .031 1.000 .503
N 20 20 20 20
arithmetics Pearson Correlation .229 .000 1 .503*
Sig. (2-tailed) .331 1.000 .024
8
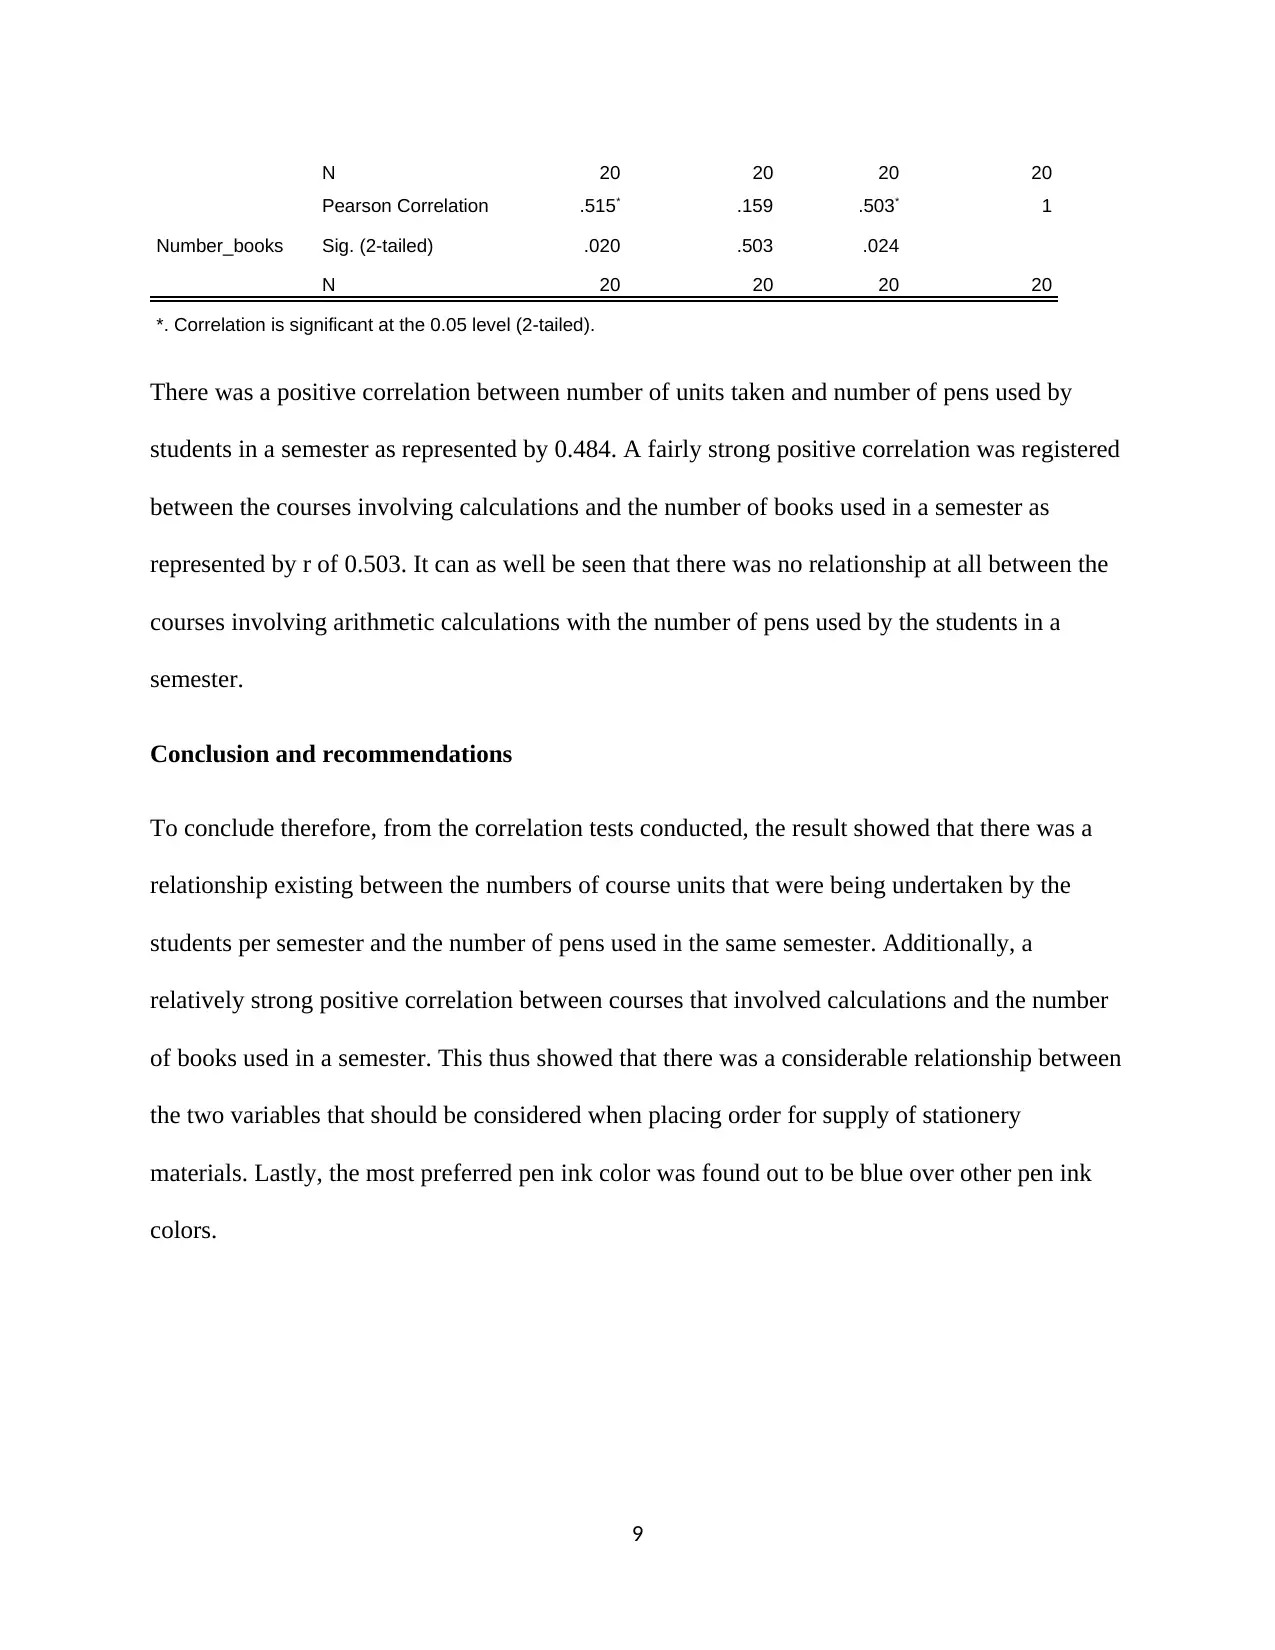
N 20 20 20 20
Number_books
Pearson Correlation .515* .159 .503* 1
Sig. (2-tailed) .020 .503 .024
N 20 20 20 20
*. Correlation is significant at the 0.05 level (2-tailed).
There was a positive correlation between number of units taken and number of pens used by
students in a semester as represented by 0.484. A fairly strong positive correlation was registered
between the courses involving calculations and the number of books used in a semester as
represented by r of 0.503. It can as well be seen that there was no relationship at all between the
courses involving arithmetic calculations with the number of pens used by the students in a
semester.
Conclusion and recommendations
To conclude therefore, from the correlation tests conducted, the result showed that there was a
relationship existing between the numbers of course units that were being undertaken by the
students per semester and the number of pens used in the same semester. Additionally, a
relatively strong positive correlation between courses that involved calculations and the number
of books used in a semester. This thus showed that there was a considerable relationship between
the two variables that should be considered when placing order for supply of stationery
materials. Lastly, the most preferred pen ink color was found out to be blue over other pen ink
colors.
9
⊘ This is a preview!⊘
Do you want full access?
Subscribe today to unlock all pages.
Trusted by 1+ million students worldwide
1 out of 16
Related Documents


Your All-in-One AI-Powered Toolkit for Academic Success.
+13062052269
info@desklib.com
Available 24*7 on WhatsApp / Email
![[object Object]](/_next/static/media/star-bottom.7253800d.svg)
Unlock your academic potential
Copyright © 2020–2026 A2Z Services. All Rights Reserved. Developed and managed by ZUCOL.