Statistics for Management: Statistical Analysis of Inflation and Wages
VerifiedAdded on 2020/10/05
|16
|4020
|369
Homework Assignment
AI Summary
This assignment focuses on applying statistical methods to analyze economic data related to inflation and wages. It begins by examining Consumer Price Indices (CPI, CPIH) and the Retail Price Index (RPI), using data from the Office of National Statistics (ONS) from 2007 to 2017. The report includes graphical representations of these indices, explanations of the differences between CPI and RPI, and calculations of annual inflation rates. Furthermore, the assignment analyzes hourly wage rates, utilizing ogives to estimate the median and quartiles of hourly earnings, and calculates the mean and standard deviation. It then compares earnings between Manchester and London using statistical analysis. Additionally, the assignment employs a paired t-test to investigate the mean time taken for a process, constructs a 99% confidence interval, and concludes with a comparison of CPI, RPI, and CPIH alterations using charts and ogives.
STATISTICS FOR
MANAGEMENT
MANAGEMENT
Paraphrase This Document
Need a fresh take? Get an instant paraphrase of this document with our AI Paraphraser
TABLE OF CONTENTS
INTRODUCTION...........................................................................................................................1
ACTIVITY 1....................................................................................................................................1
a. On basis of ONS, locate Consumer price Indices (CPI and CPIH) and retail price index......1
b. Reflecting graph of above indices from year 2007 to 2017.....................................................3
c. Explaining difference among Consumer and Retail Price Index.............................................3
d. Application of Consumer price Index with calculation of annual inflation ............................4
e. Stating significance on basis of inflation rate..........................................................................6
ACTIVITY 2....................................................................................................................................6
Hourly wage rate..........................................................................................................................6
a.1 Application of ogive for estimating median on basis of quartile and hourly earnings..........6
a.2 Stating mean and standard deviation of hourly earnings.......................................................9
b. Comparing earnings of Manchester and London basis of statistical analysis.......................10
ACTIVITY 3..................................................................................................................................10
a. Carrying paired t test with 5% level of significance for investigating mean length of time
undertaken for process of set of forms.......................................................................................10
b. Stating full usual condition of t test.......................................................................................11
c. Constructing 99% confidence interval mean reduction.........................................................11
ACTIVITY 4..................................................................................................................................12
a. Using data with ONS, producing chart for indicating alteration in CPI, RPI and CPIH.......12
b. Producing ogive for cumulative % of staff versus hourly earnings.......................................13
CONCLUSION..............................................................................................................................13
REFERENCES..............................................................................................................................14
INTRODUCTION
Statistics is replicated as data science which will provide help for enabling presentation,
gathering and analysis of gathering data. The management applies numerous statistical tools for
articulating outcome and with objective of quality assurance, financial analysis and operations as
well with other areas of business. The present report will give brief discussion about inflation
measure index such as RPI, CPI and CPIH which is extracted from Office of National statistics
website. In the similar aspect, it will be showing variance in RPI and CPI along with importance
of inflation rate. Further, this will be using ogive and other charts for showing percentage change
and outcome along with median and standard deviations for hourly earnings. It will articulate
about comparison about earnings of two regions as London and Manchester with their hourly
earnings.
ACTIVITY 1
a. On basis of ONS, locate Consumer price Indices (CPI and CPIH) and retail price index
Retail Price Index: In the current scenario, it is used with different price and income on
basis of tax allowances, pensions, state benefits along with index-linked gilts. It is measure of
inflation of consumer on basis of UK's ONS. In simple words, it tracks alterations in cost of a
fixed basket of goods and reflects changes in price of multiple range of goods chosen as essential
products in budget of a normal household.
Consumer Price Indices: It forms particular basis of inflation target of government
which has been required for attaining Bank of England's Monetary policy committee. In simple
words, it is monthly measurement of US prices for various household goods along with services
as it reports deflation and inflation as well. Generally, it is used by federal government with
application of identifying economic policies with requirement of modifying for purpose of
preventing inflation. In the similar aspect, government agencies uses CPI for adjusting prices in
other government economic indicators like gross domestic products and for improving benefit
level for recipients of Social security along with other programs by government (Dabbicco,
2018).
CPIH: It is referred as additional measure for consumer price inflation which consist of
various other measures of owner occupier's housing costs and regulator thinks about deserving to
national statistic. In simple words, it is not measure which considers change in house prices as it
is essential and conventional familiar measure of consumer price inflation of UK which is
1
⊘ This is a preview!⊘
Do you want full access?
Subscribe today to unlock all pages.
Trusted by 1+ million students worldwide
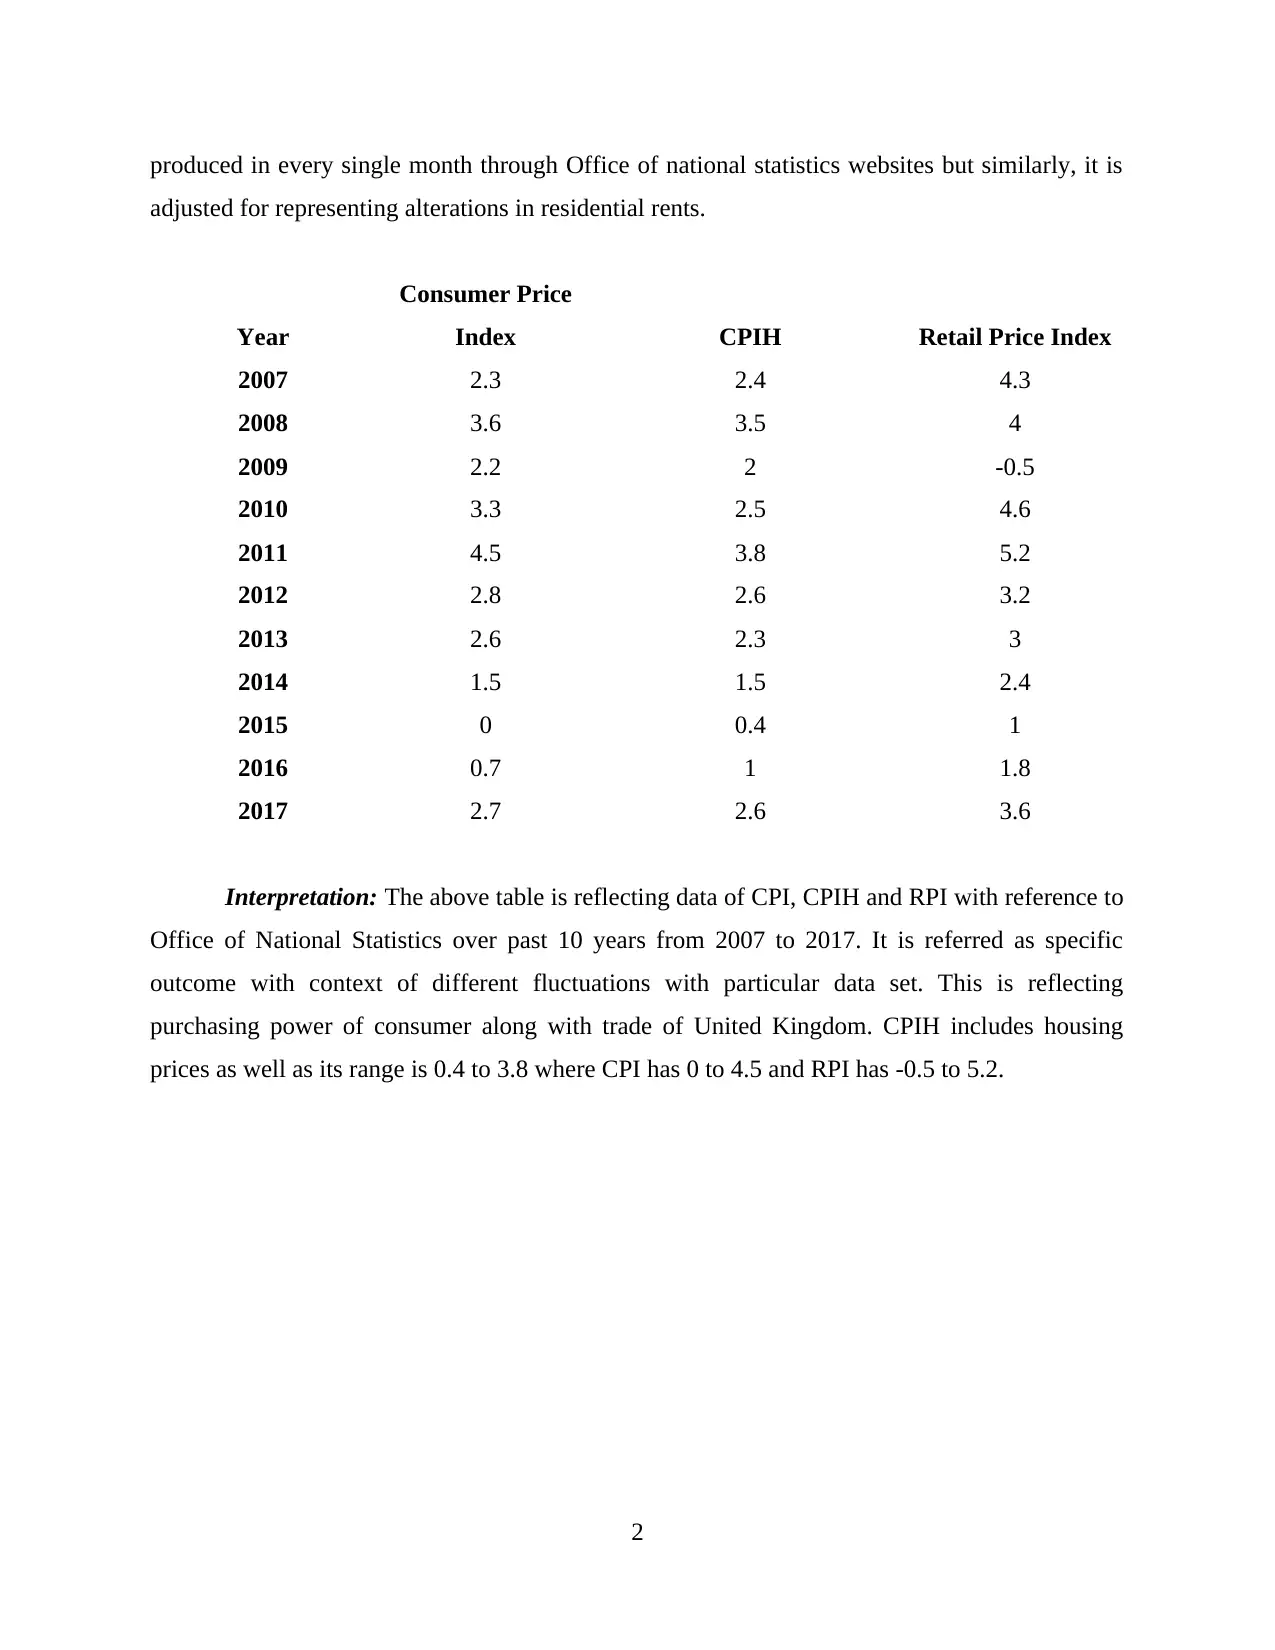
produced in every single month through Office of national statistics websites but similarly, it is
adjusted for representing alterations in residential rents.
Year
Consumer Price
Index CPIH Retail Price Index
2007 2.3 2.4 4.3
2008 3.6 3.5 4
2009 2.2 2 -0.5
2010 3.3 2.5 4.6
2011 4.5 3.8 5.2
2012 2.8 2.6 3.2
2013 2.6 2.3 3
2014 1.5 1.5 2.4
2015 0 0.4 1
2016 0.7 1 1.8
2017 2.7 2.6 3.6
Interpretation: The above table is reflecting data of CPI, CPIH and RPI with reference to
Office of National Statistics over past 10 years from 2007 to 2017. It is referred as specific
outcome with context of different fluctuations with particular data set. This is reflecting
purchasing power of consumer along with trade of United Kingdom. CPIH includes housing
prices as well as its range is 0.4 to 3.8 where CPI has 0 to 4.5 and RPI has -0.5 to 5.2.
2
Paraphrase This Document
Need a fresh take? Get an instant paraphrase of this document with our AI Paraphraser
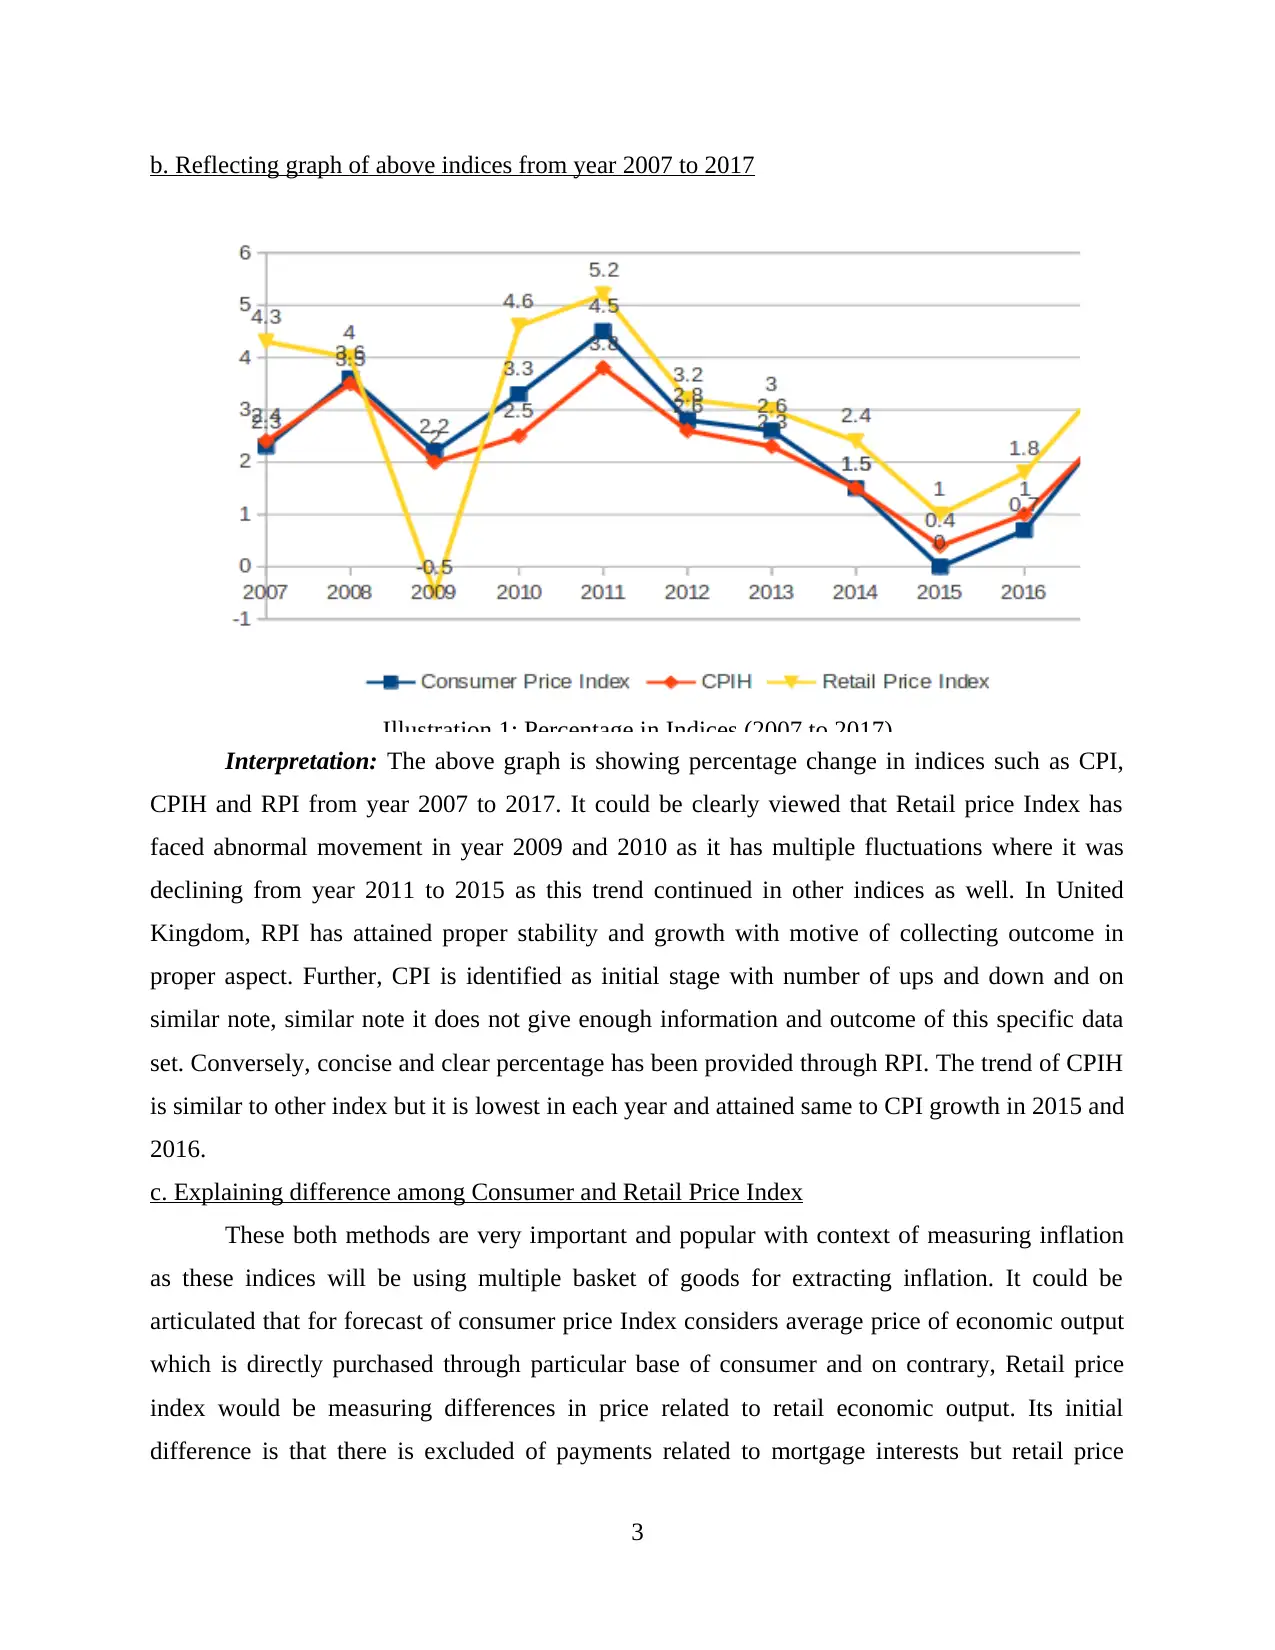
b. Reflecting graph of above indices from year 2007 to 2017
Illustration 1: Percentage in Indices (2007 to 2017)
Interpretation: The above graph is showing percentage change in indices such as CPI,
CPIH and RPI from year 2007 to 2017. It could be clearly viewed that Retail price Index has
faced abnormal movement in year 2009 and 2010 as it has multiple fluctuations where it was
declining from year 2011 to 2015 as this trend continued in other indices as well. In United
Kingdom, RPI has attained proper stability and growth with motive of collecting outcome in
proper aspect. Further, CPI is identified as initial stage with number of ups and down and on
similar note, similar note it does not give enough information and outcome of this specific data
set. Conversely, concise and clear percentage has been provided through RPI. The trend of CPIH
is similar to other index but it is lowest in each year and attained same to CPI growth in 2015 and
2016.
c. Explaining difference among Consumer and Retail Price Index
These both methods are very important and popular with context of measuring inflation
as these indices will be using multiple basket of goods for extracting inflation. It could be
articulated that for forecast of consumer price Index considers average price of economic output
which is directly purchased through particular base of consumer and on contrary, Retail price
index would be measuring differences in price related to retail economic output. Its initial
difference is that there is excluded of payments related to mortgage interests but retail price
3
index undertakes this consideration. With context of this perspective, there is necessity for
purpose of understanding related to indices so further information is stated below:
Parameters Retail Price Index Consumer price Index
Explanation It is implicated as consumer inflation
measure which will directly calculate
alteration in retail price with
representative of particular basket of
goods and services.
It is measure which will extract
differences paid through consumers
with context of fixed basket of services
and goods is replicated as Consumer
price index.
Application It will be using arithmetic mean. There will be application of geometric
mean.
Housing cost This expense is directly included. There will be eliminating of this cost of
housing.
Size of
population
Small size of population Large size of population
Valuation It is higher from compared to CPI. Lower valuation
Financial
charges
These expense are excluded in RPI. This measure directly included these
charges (CPI(H) vs RPI, 2017).
With perspective of both measure CPI and RPI, states alteration in price changes as cost
related to services and goods are last year along with present cost. The main cause of this
variation of previous year about present charges. The main cause of this difference on basis of
figures of these particular indexes with two estimate prices alterations but along with unique
target audience. Furthermore, there are different items which are directly covered in CPI but not
in RPI. Henceforth, there is calculation of application of two different formulas with sum of
variation among these two are stated above (Difference Between CPI and RPI, 2018).
d. Application of Consumer price Index with calculation of annual inflation
Year Consumer Price Index Annual Inflation
2007 2.3 0.00
2008 3.6 0.57
4
⊘ This is a preview!⊘
Do you want full access?
Subscribe today to unlock all pages.
Trusted by 1+ million students worldwide
2009 2.2 -0.39
2010 3.3 0.50
2011 4.5 0.36
2012 2.8 -0.38
2013 2.6 -0.07
2014 1.5 -0.42
2015 0 -1.00
2016 0.7 0.00
2017 2.7 2.86
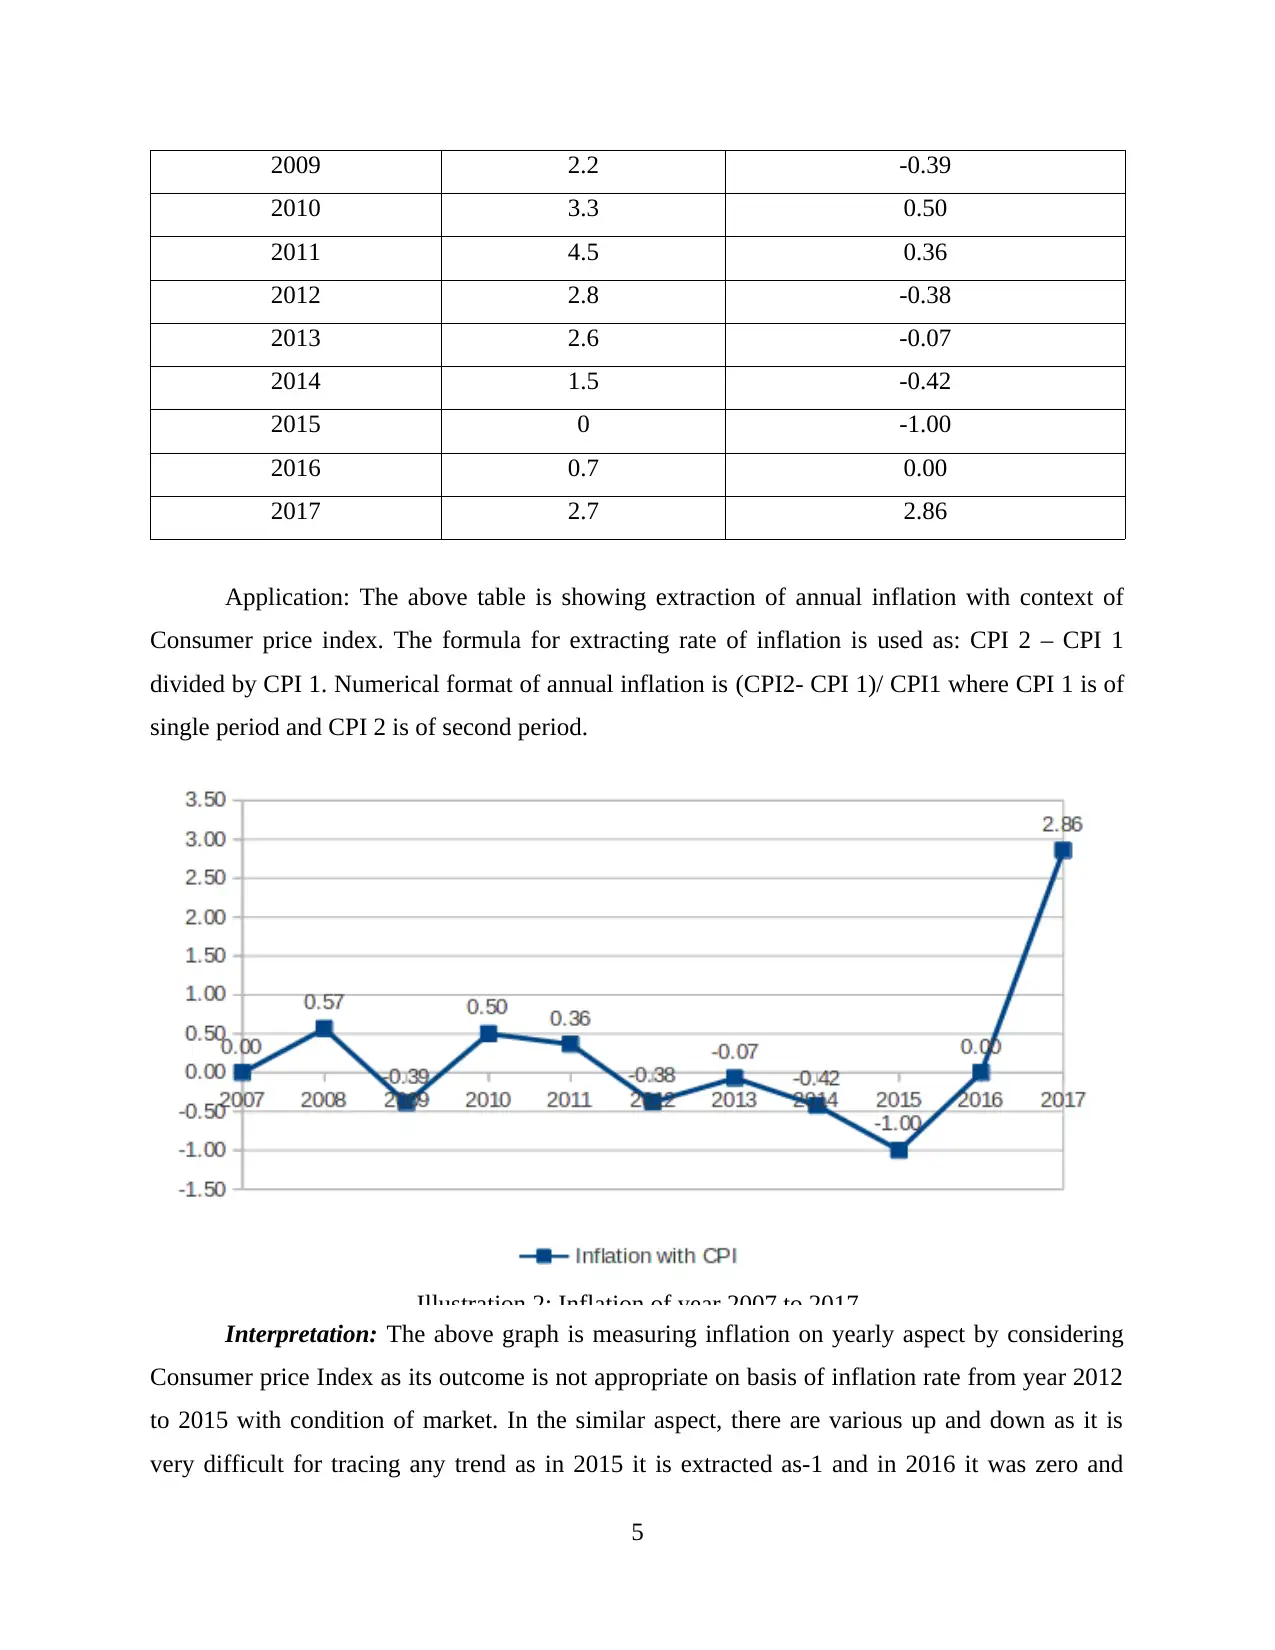
Application: The above table is showing extraction of annual inflation with context of
Consumer price index. The formula for extracting rate of inflation is used as: CPI 2 – CPI 1
divided by CPI 1. Numerical format of annual inflation is (CPI2- CPI 1)/ CPI1 where CPI 1 is of
single period and CPI 2 is of second period.
Illustration 2: Inflation of year 2007 to 2017
Interpretation: The above graph is measuring inflation on yearly aspect by considering
Consumer price Index as its outcome is not appropriate on basis of inflation rate from year 2012
to 2015 with condition of market. In the similar aspect, there are various up and down as it is
very difficult for tracing any trend as in 2015 it is extracted as-1 and in 2016 it was zero and
5
2010 3.3 0.50
2011 4.5 0.36
2012 2.8 -0.38
2013 2.6 -0.07
2014 1.5 -0.42
2015 0 -1.00
2016 0.7 0.00
2017 2.7 2.86
Application: The above table is showing extraction of annual inflation with context of
Consumer price index. The formula for extracting rate of inflation is used as: CPI 2 – CPI 1
divided by CPI 1. Numerical format of annual inflation is (CPI2- CPI 1)/ CPI1 where CPI 1 is of
single period and CPI 2 is of second period.
Illustration 2: Inflation of year 2007 to 2017
Interpretation: The above graph is measuring inflation on yearly aspect by considering
Consumer price Index as its outcome is not appropriate on basis of inflation rate from year 2012
to 2015 with condition of market. In the similar aspect, there are various up and down as it is
very difficult for tracing any trend as in 2015 it is extracted as-1 and in 2016 it was zero and
5
Paraphrase This Document
Need a fresh take? Get an instant paraphrase of this document with our AI Paraphraser
suddenly it raised to 2.86 in 2017 which is leading in these past 10 years because of increment in
Consumer price index as well from its past year. Thus, it could be evaluated that increment in
inflation is challenge to economy and with this context, commodity prices and per capital income
will be impacted and creates stability in financial position (Koutras and Koutras, 2018).
e. Stating significance on basis of inflation rate
Inflation is considered as spike in prices along with money supply which is circulating
with perspective of economy. In simple words, it is related to increment in prices with happening
in association along with specific benchmark. Further, prices tend to increment when supply of
money increases as CPI could be used as benchmark. It has presence of important consequence
with reference to industry as high inflation rate discourages investment and will directly lead for
lowering long term growth with multiple reasons such as:
With presence of high and volatile inflation would be creating uncertainty and confusion
with context of future costs and prices and in similar aspect, it will tend for decreasing
investment and lead for lowering growth rate in economy and then less demand with
context of goods.
If inflation is high, then prices would be altered on frequent aspect as indirectly it will
incur a cost. The high rate of inflation might incur frequent negotiations where trade
unions will be directly trying for purpose of maintaining actual wages which could be
expensive as well.
If there is high inflation, which shows that cost of UK would be raising and creates
exports of country to be less competitive with comparison from rest of world.
This will be impacting on savings not only on households but with context of substantial
cash reserves (Importance of Inflation for Industry, 2016).
The past trend of inflation is referred as very instructive due to influence of inflation rate
through past rate of inflation. In simple words, trends of inflation would be very high in past as it
will directly encourage people for purpose of demanding higher wages and past cost will be
increased. Henceforth, expectations of inflation would be becoming self fulfilling as country
with low trend of inflation would be making attractive proposition on basis of investment as it
will be recommending economic stability , maturity and less risk linked to investment.
6
ACTIVITY 2
Hourly wage rate
a.1 Application of ogive for estimating median on basis of quartile and hourly earnings
There is presence of appropriate analysis of variations in hourly earnings at numerous
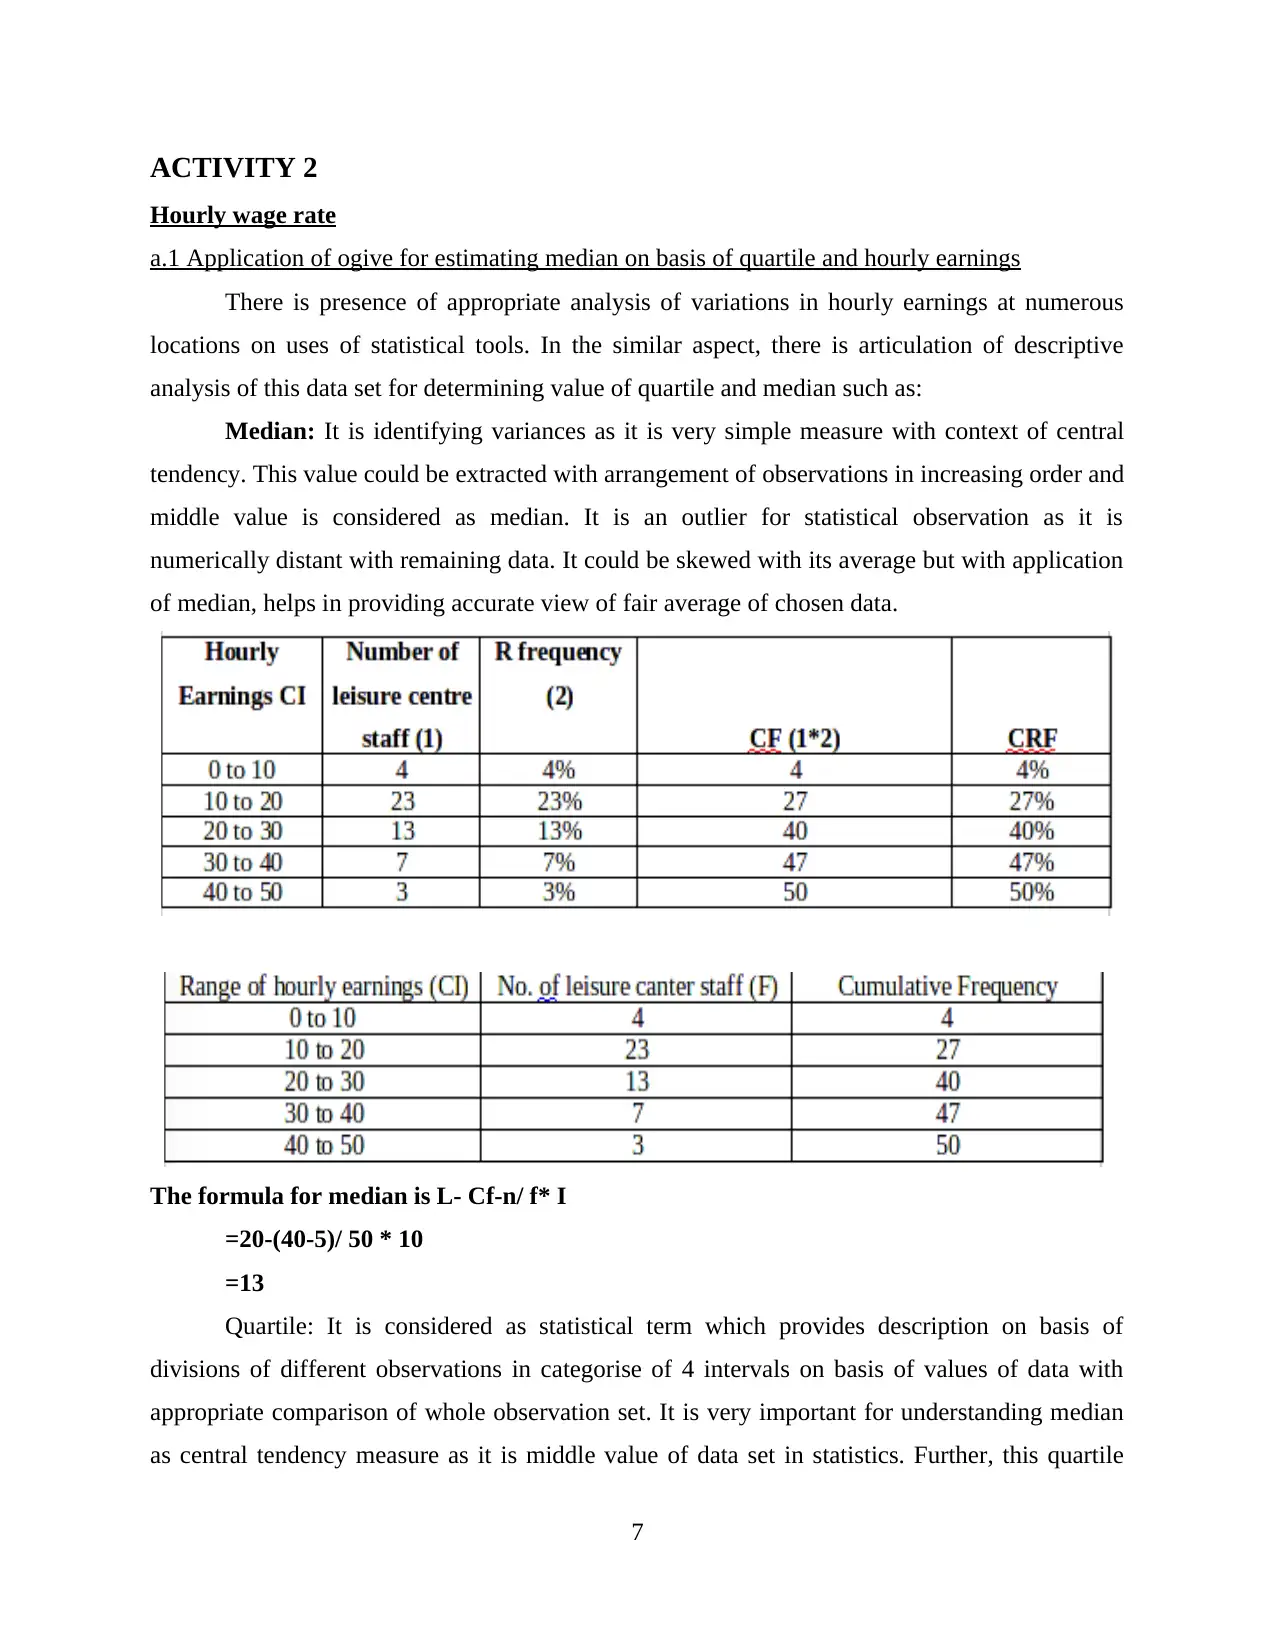
locations on uses of statistical tools. In the similar aspect, there is articulation of descriptive
analysis of this data set for determining value of quartile and median such as:
Median: It is identifying variances as it is very simple measure with context of central
tendency. This value could be extracted with arrangement of observations in increasing order and
middle value is considered as median. It is an outlier for statistical observation as it is
numerically distant with remaining data. It could be skewed with its average but with application
of median, helps in providing accurate view of fair average of chosen data.
The formula for median is L- Cf-n/ f* I
=20-(40-5)/ 50 * 10
=13
Quartile: It is considered as statistical term which provides description on basis of
divisions of different observations in categorise of 4 intervals on basis of values of data with
appropriate comparison of whole observation set. It is very important for understanding median
as central tendency measure as it is middle value of data set in statistics. Further, this quartile
7
Hourly wage rate
a.1 Application of ogive for estimating median on basis of quartile and hourly earnings
There is presence of appropriate analysis of variations in hourly earnings at numerous
locations on uses of statistical tools. In the similar aspect, there is articulation of descriptive
analysis of this data set for determining value of quartile and median such as:
Median: It is identifying variances as it is very simple measure with context of central
tendency. This value could be extracted with arrangement of observations in increasing order and
middle value is considered as median. It is an outlier for statistical observation as it is
numerically distant with remaining data. It could be skewed with its average but with application
of median, helps in providing accurate view of fair average of chosen data.
The formula for median is L- Cf-n/ f* I
=20-(40-5)/ 50 * 10
=13
Quartile: It is considered as statistical term which provides description on basis of
divisions of different observations in categorise of 4 intervals on basis of values of data with
appropriate comparison of whole observation set. It is very important for understanding median
as central tendency measure as it is middle value of data set in statistics. Further, this quartile
7
⊘ This is a preview!⊘
Do you want full access?
Subscribe today to unlock all pages.
Trusted by 1+ million students worldwide
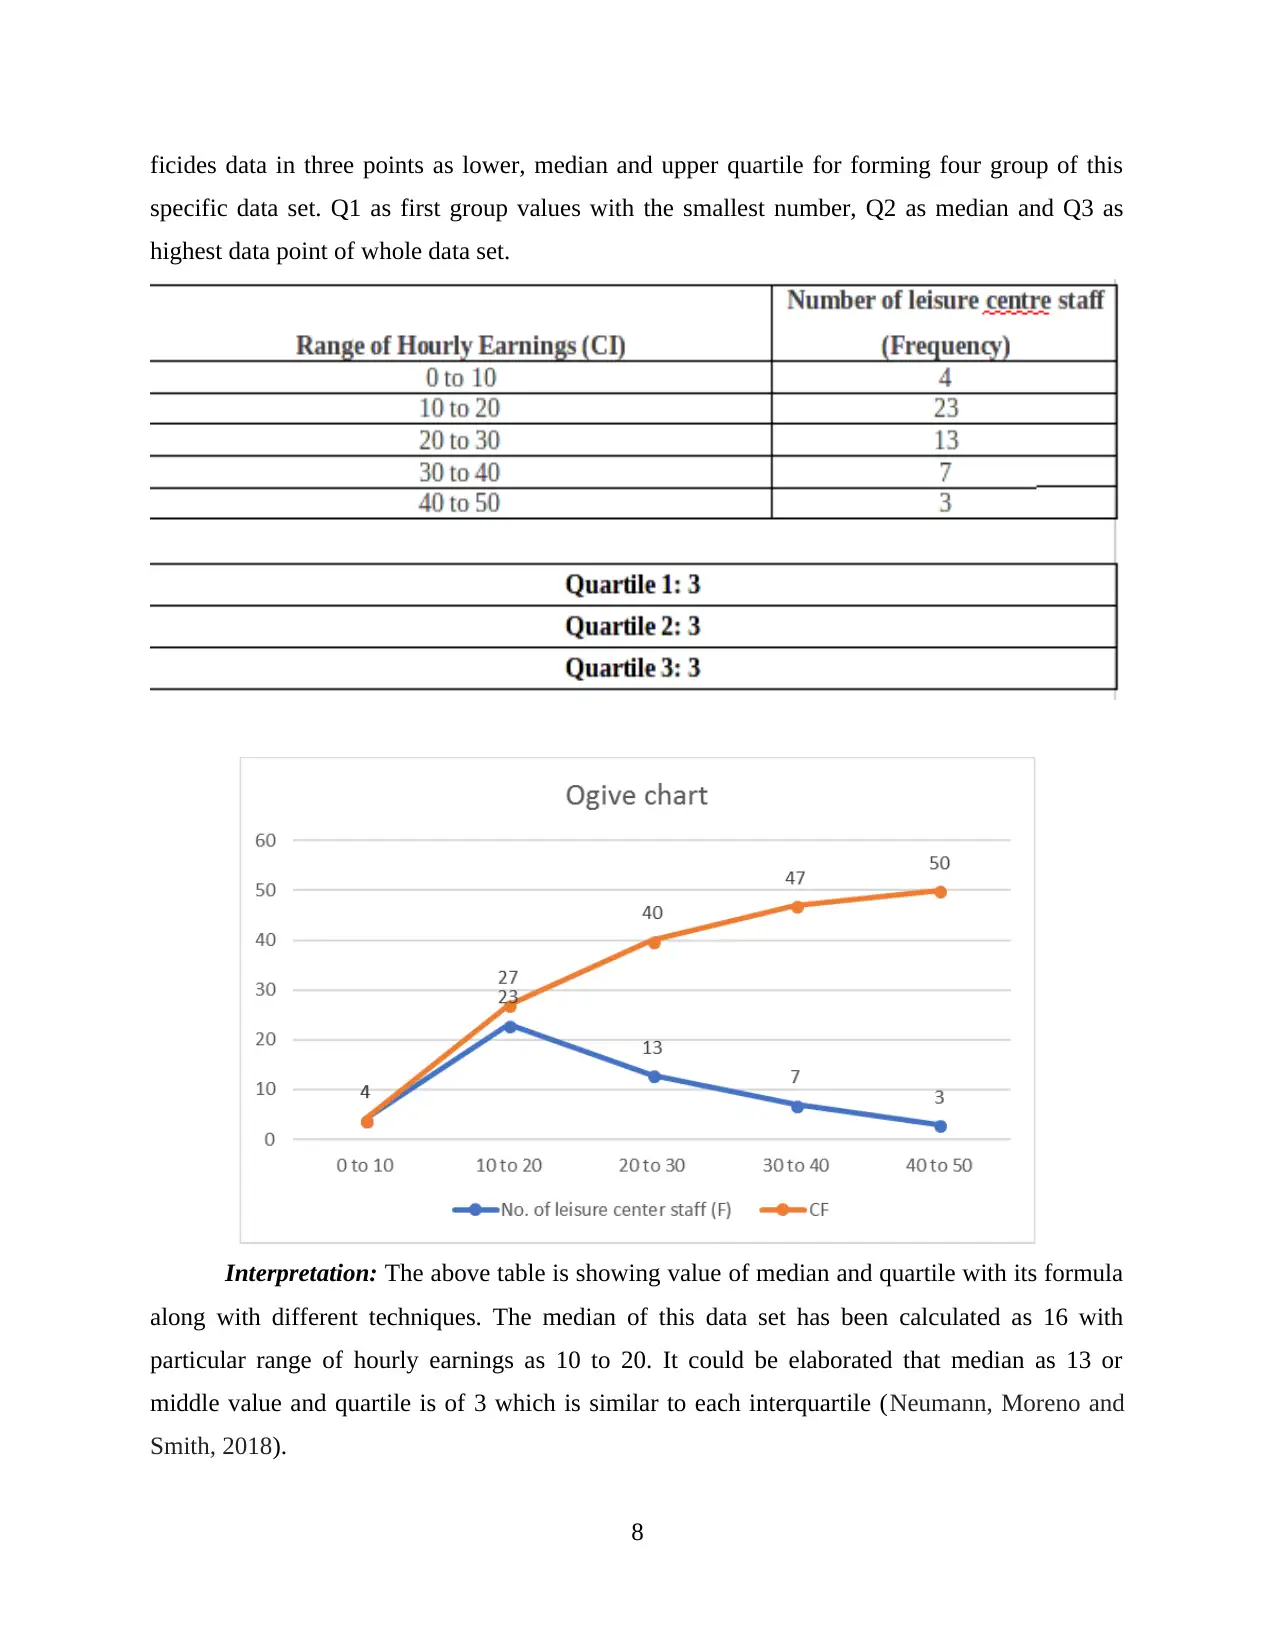
ficides data in three points as lower, median and upper quartile for forming four group of this
specific data set. Q1 as first group values with the smallest number, Q2 as median and Q3 as
highest data point of whole data set.
Interpretation: The above table is showing value of median and quartile with its formula
along with different techniques. The median of this data set has been calculated as 16 with
particular range of hourly earnings as 10 to 20. It could be elaborated that median as 13 or
middle value and quartile is of 3 which is similar to each interquartile (Neumann, Moreno and
Smith, 2018).
8
Paraphrase This Document
Need a fresh take? Get an instant paraphrase of this document with our AI Paraphraser
a.2 Stating mean and standard deviation of hourly earnings
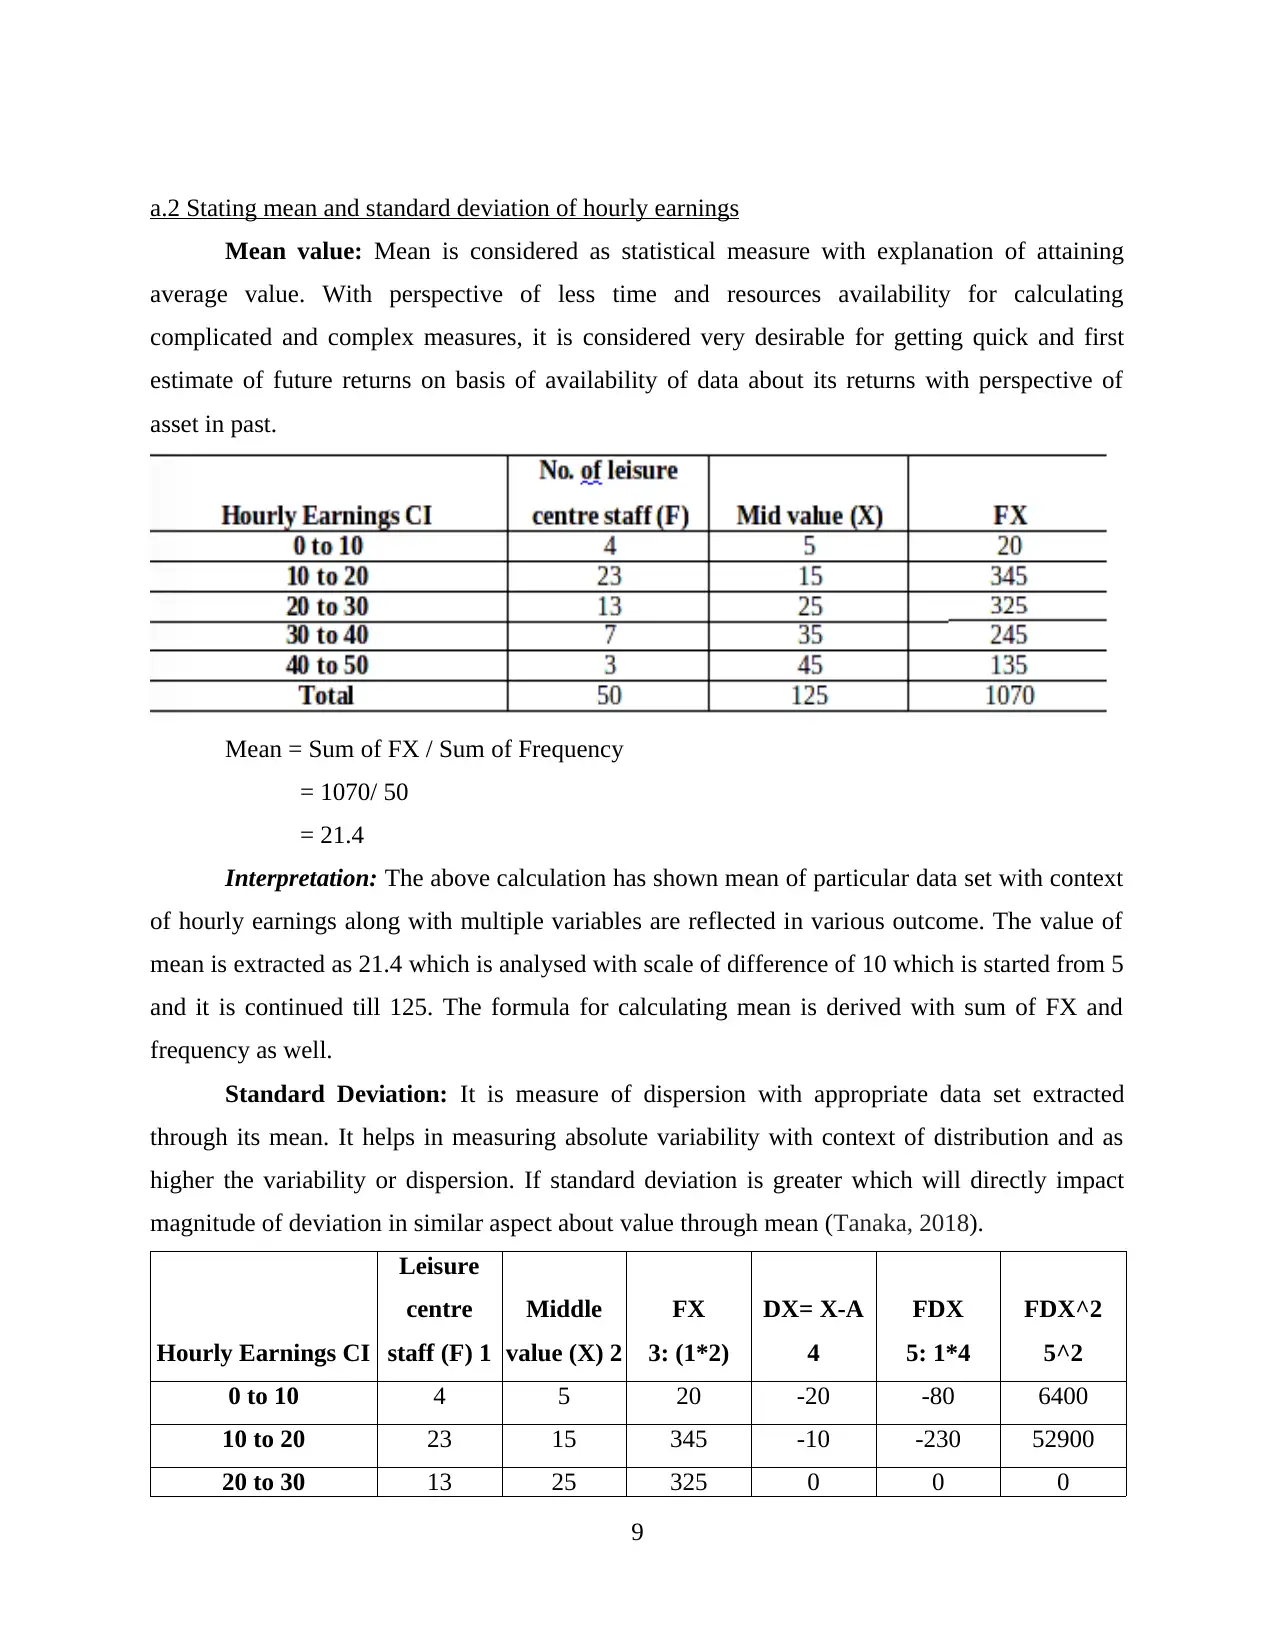
Mean value: Mean is considered as statistical measure with explanation of attaining
average value. With perspective of less time and resources availability for calculating
complicated and complex measures, it is considered very desirable for getting quick and first
estimate of future returns on basis of availability of data about its returns with perspective of
asset in past.
Mean = Sum of FX / Sum of Frequency
= 1070/ 50
= 21.4
Interpretation: The above calculation has shown mean of particular data set with context
of hourly earnings along with multiple variables are reflected in various outcome. The value of
mean is extracted as 21.4 which is analysed with scale of difference of 10 which is started from 5
and it is continued till 125. The formula for calculating mean is derived with sum of FX and
frequency as well.
Standard Deviation: It is measure of dispersion with appropriate data set extracted
through its mean. It helps in measuring absolute variability with context of distribution and as
higher the variability or dispersion. If standard deviation is greater which will directly impact
magnitude of deviation in similar aspect about value through mean (Tanaka, 2018).
Hourly Earnings CI
Leisure
centre
staff (F) 1
Middle
value (X) 2
FX
3: (1*2)
DX= X-A
4
FDX
5: 1*4
FDX^2
5^2
0 to 10 4 5 20 -20 -80 6400
10 to 20 23 15 345 -10 -230 52900
20 to 30 13 25 325 0 0 0
9
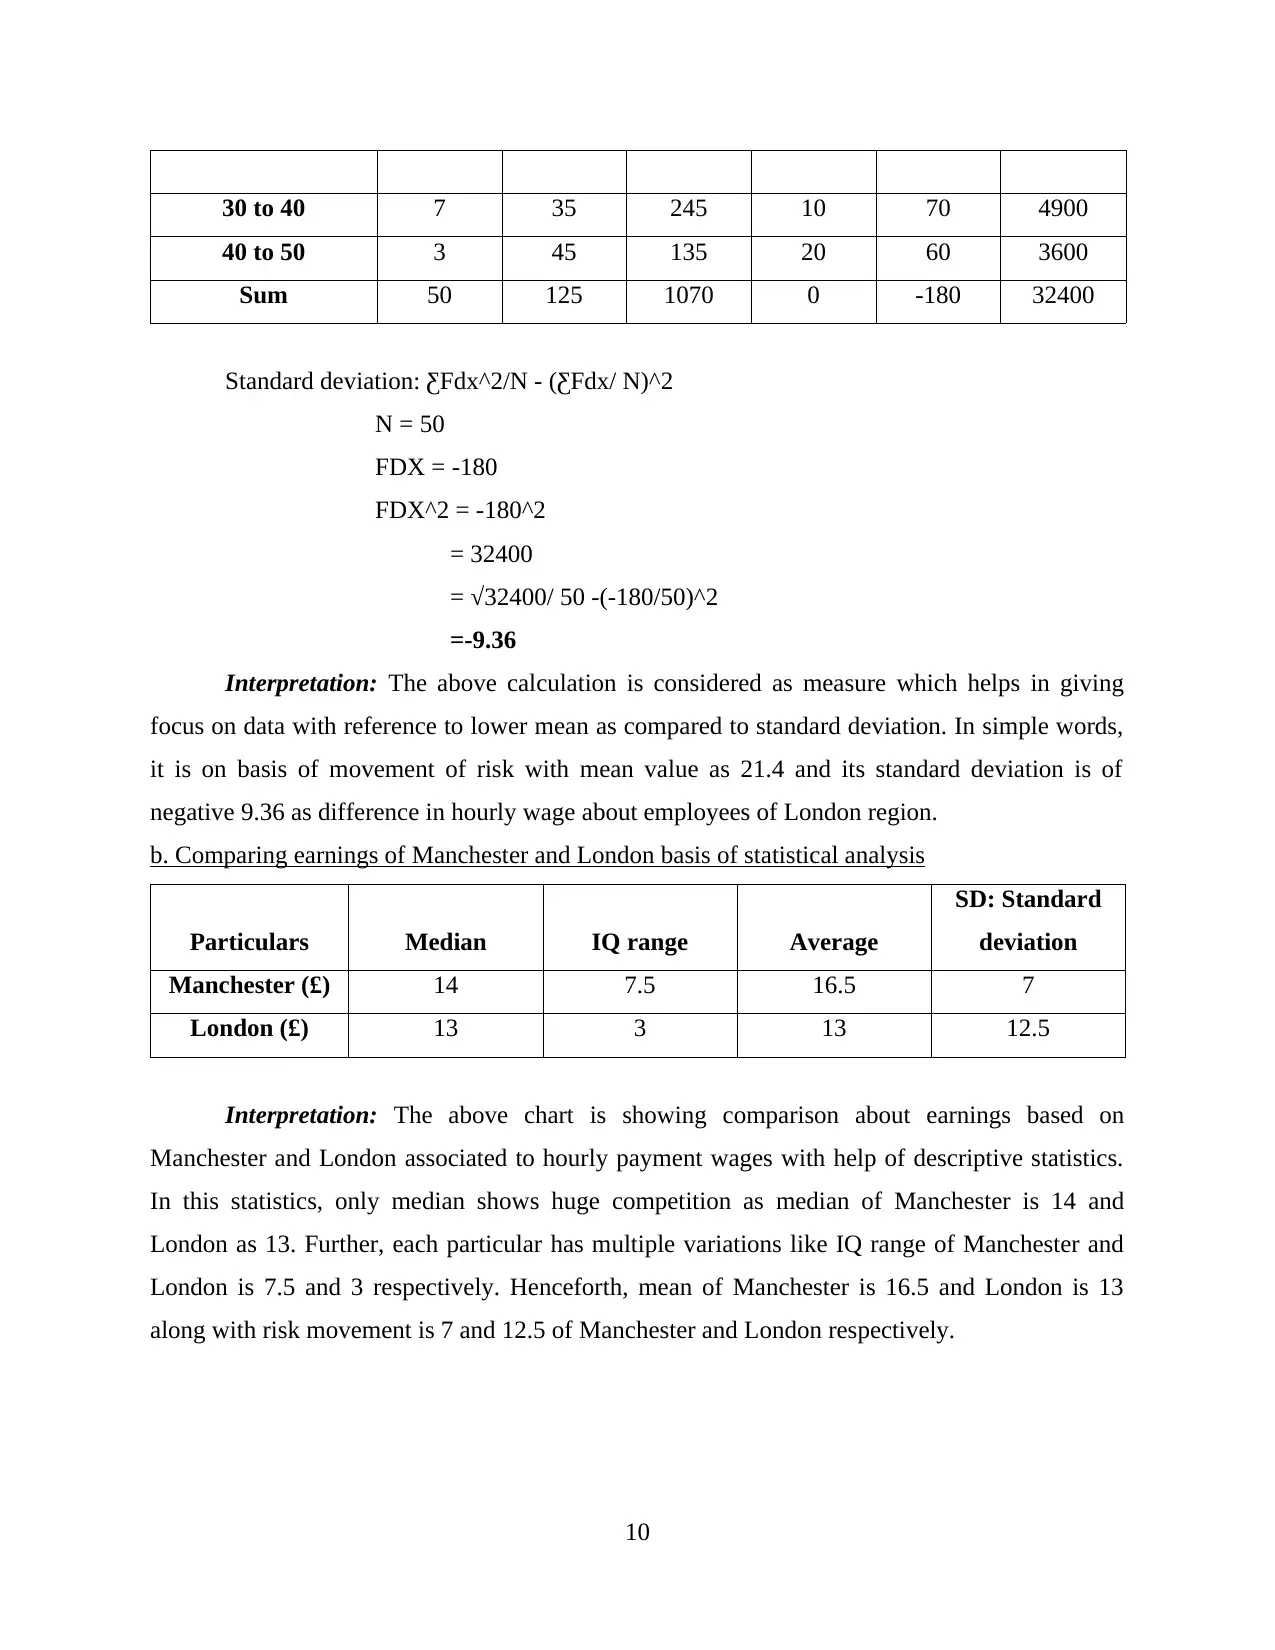
30 to 40 7 35 245 10 70 4900
40 to 50 3 45 135 20 60 3600
Sum 50 125 1070 0 -180 32400
Standard deviation: ƸFdx^2/N - (ƸFdx/ N)^2
N = 50
FDX = -180
FDX^2 = -180^2
= 32400
= √32400/ 50 -(-180/50)^2
=-9.36
Interpretation: The above calculation is considered as measure which helps in giving
focus on data with reference to lower mean as compared to standard deviation. In simple words,
it is on basis of movement of risk with mean value as 21.4 and its standard deviation is of
negative 9.36 as difference in hourly wage about employees of London region.
b. Comparing earnings of Manchester and London basis of statistical analysis
Particulars Median IQ range Average
SD: Standard
deviation
Manchester (£) 14 7.5 16.5 7
London (£) 13 3 13 12.5
Interpretation: The above chart is showing comparison about earnings based on
Manchester and London associated to hourly payment wages with help of descriptive statistics.
In this statistics, only median shows huge competition as median of Manchester is 14 and
London as 13. Further, each particular has multiple variations like IQ range of Manchester and
London is 7.5 and 3 respectively. Henceforth, mean of Manchester is 16.5 and London is 13
along with risk movement is 7 and 12.5 of Manchester and London respectively.
10
⊘ This is a preview!⊘
Do you want full access?
Subscribe today to unlock all pages.
Trusted by 1+ million students worldwide
1 out of 16
Related Documents


Your All-in-One AI-Powered Toolkit for Academic Success.
+13062052269
info@desklib.com
Available 24*7 on WhatsApp / Email
![[object Object]](/_next/static/media/star-bottom.7253800d.svg)
Unlock your academic potential
Copyright © 2020–2026 A2Z Services. All Rights Reserved. Developed and managed by ZUCOL.