Statistical Analysis of APS Data: STA10003 Assignment 2 Report

Verified

Added on  2019/09/26

|8
|1104
|374
Homework Assignment
AI Summary
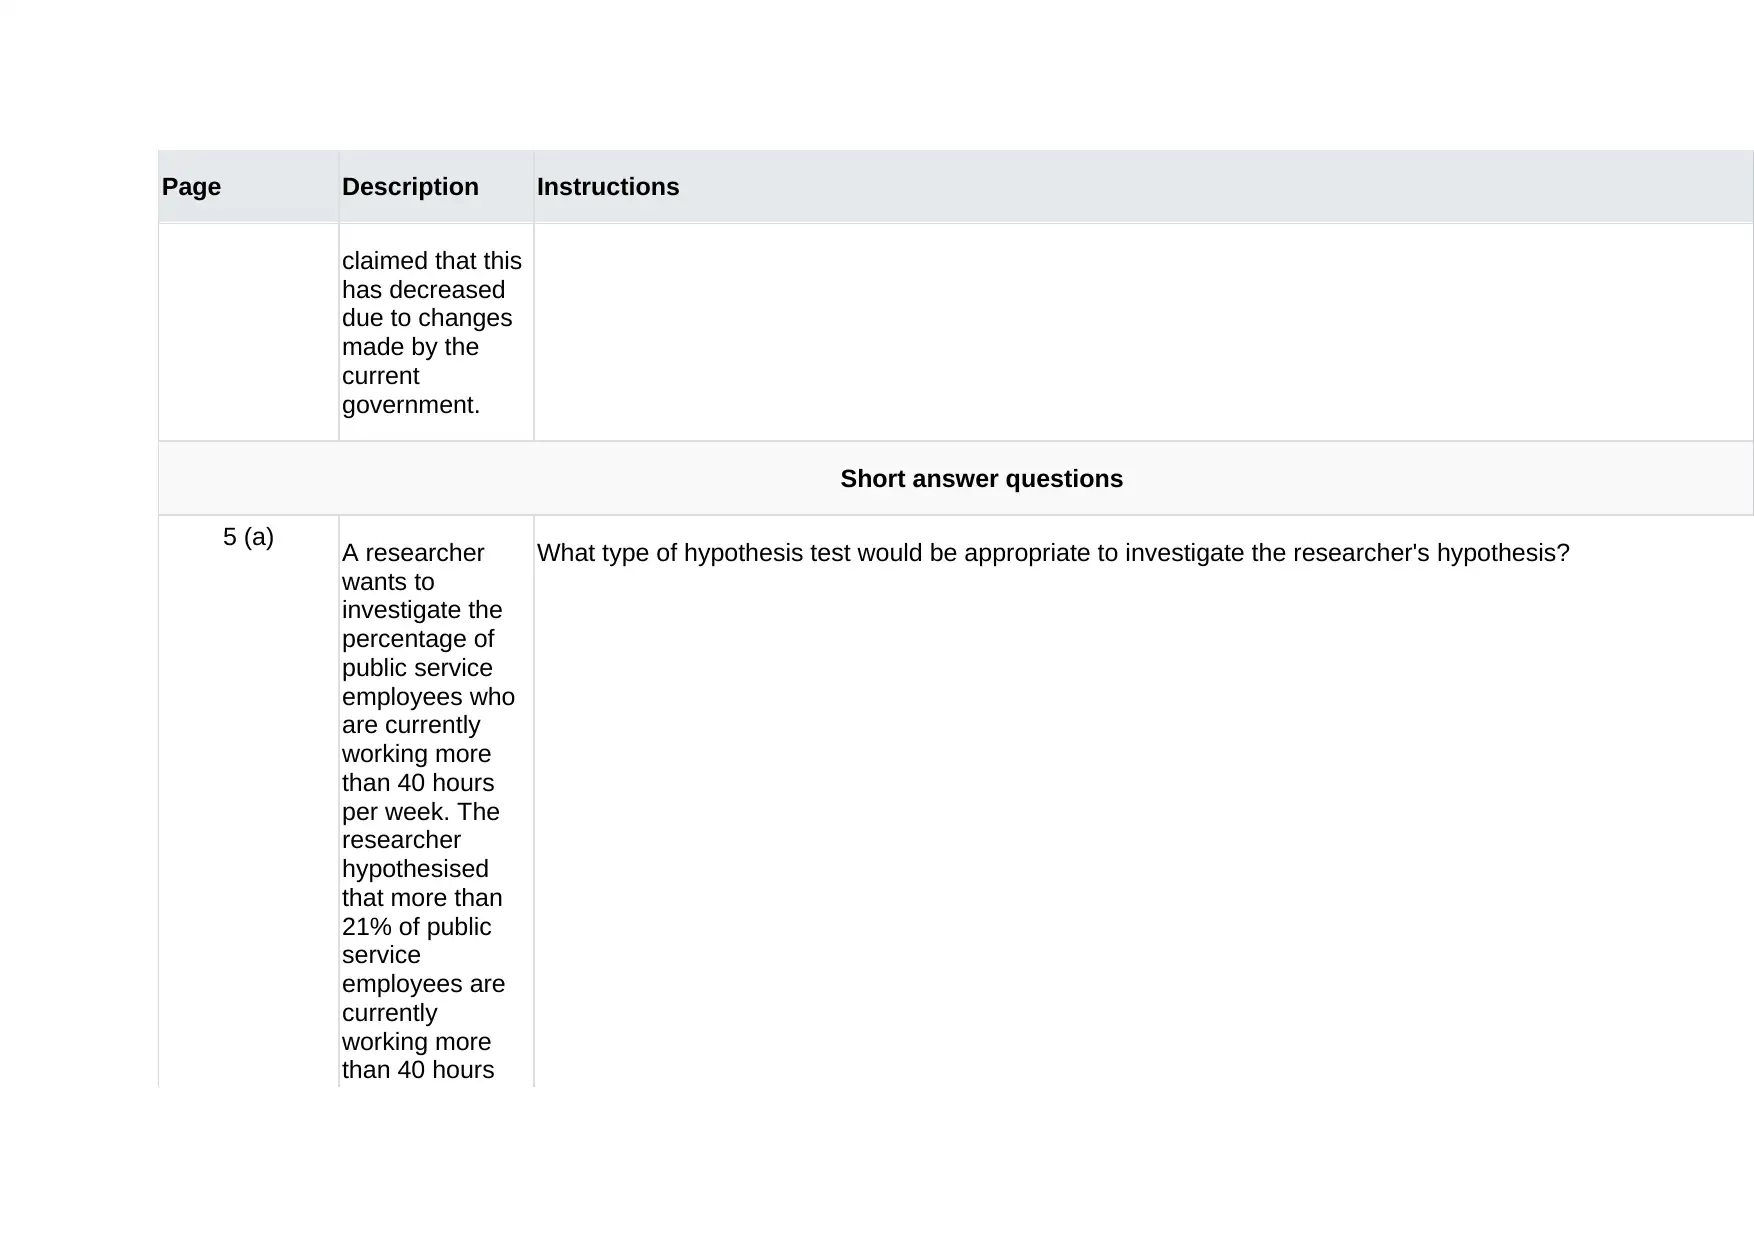
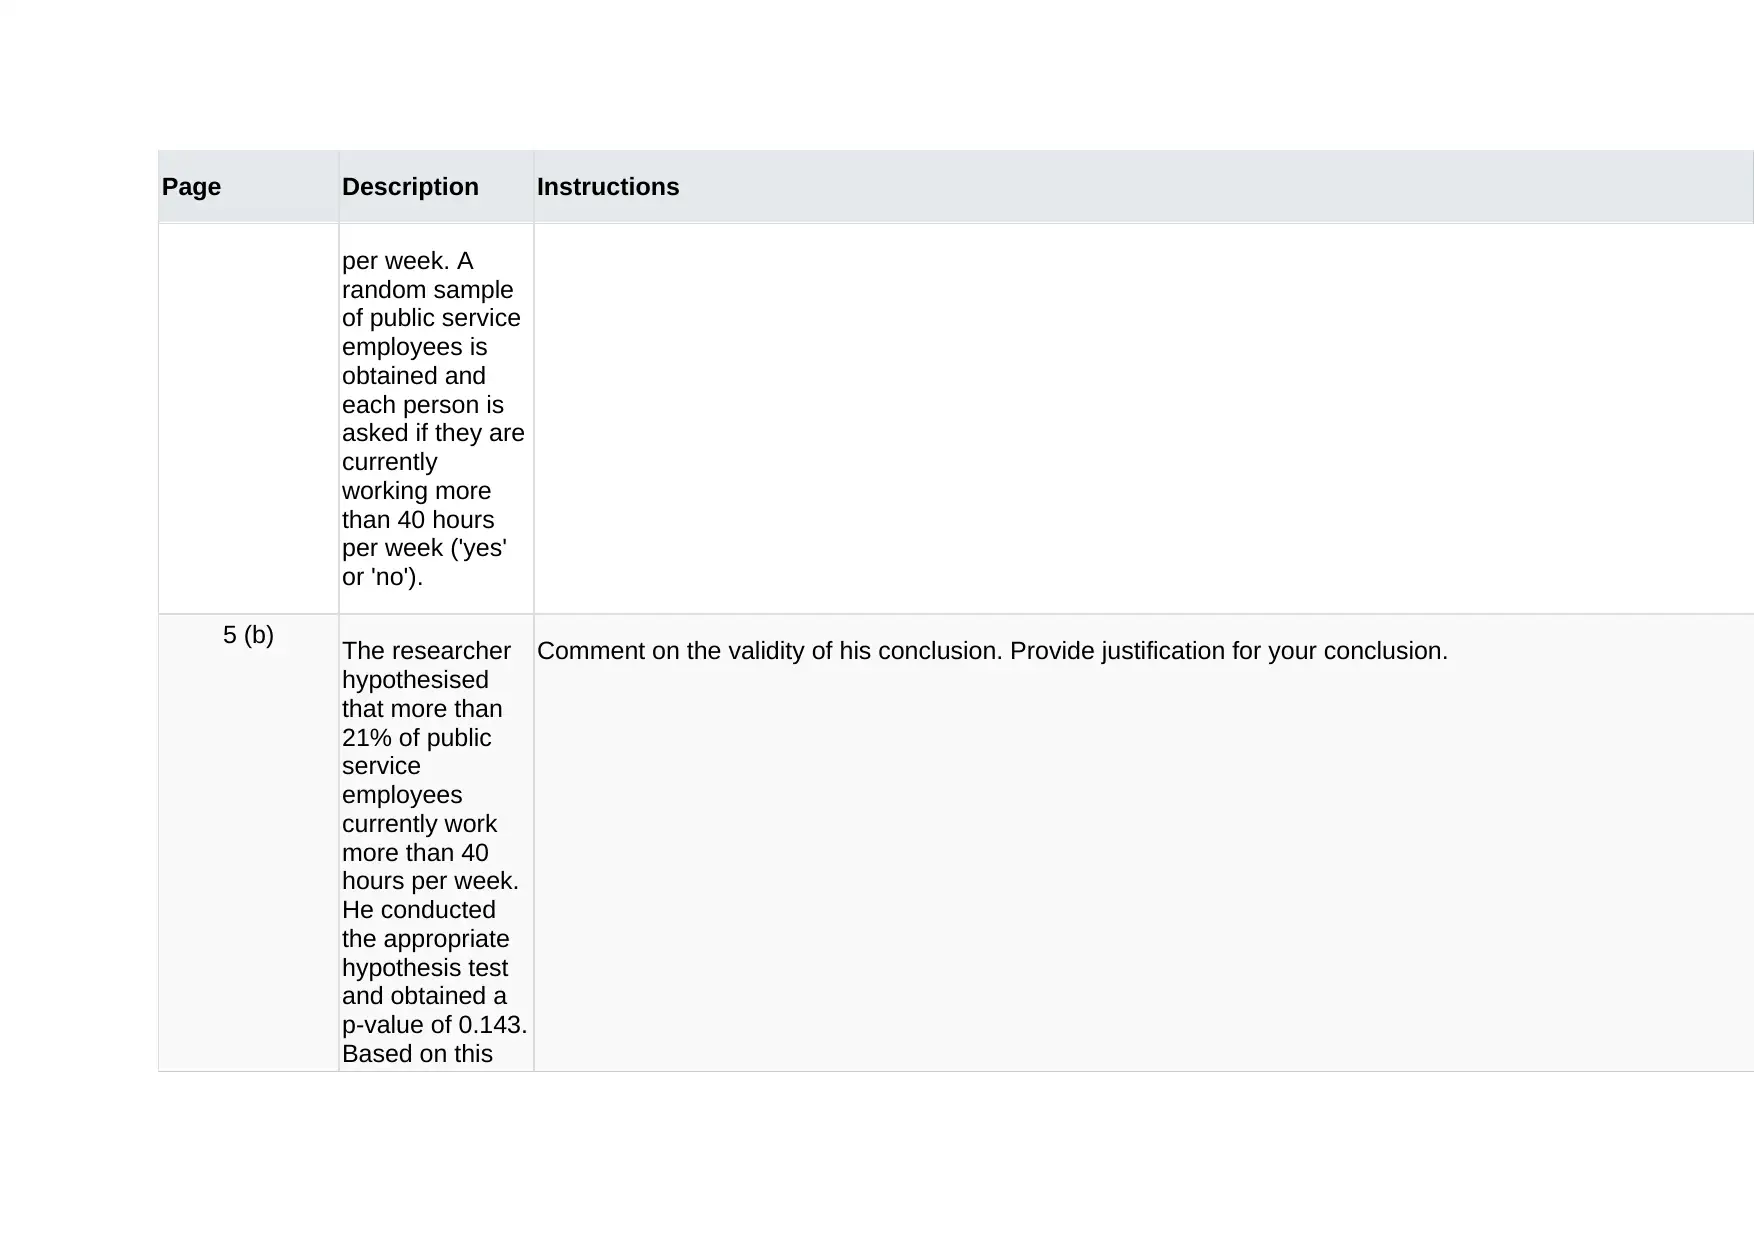
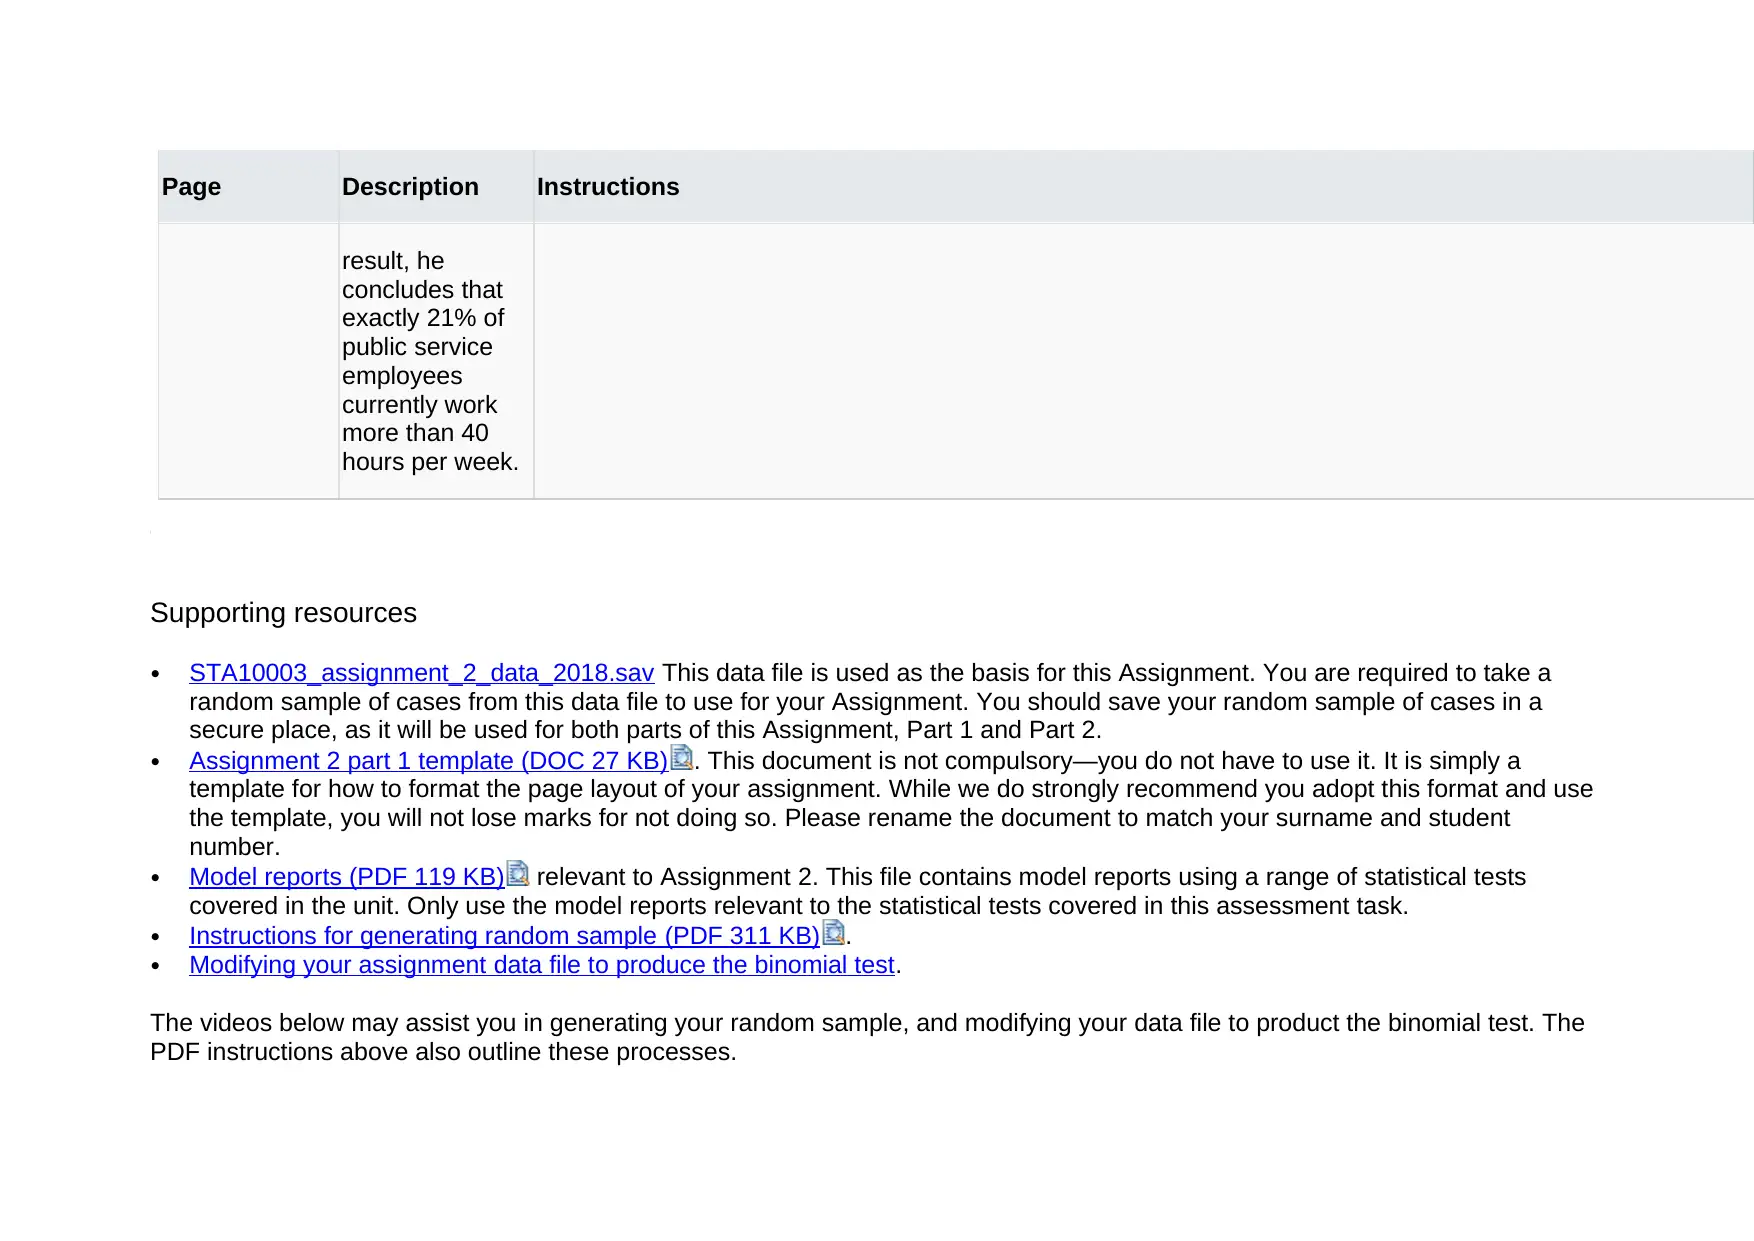
This assignment involves analyzing a dataset from the Australian Public Service Commission Census 2016 using SPSS. The analysis focuses on a random sample of 1500 observations, addressing questions related to work enjoyment, job engagement, bullying, and team engagement. The assignment requires the generation of descriptive statistics, graphs, and the execution of statistical tests, including binomial and one-sample t-tests. Reports are to be written based on the outputs of these analyses, following the format of provided model reports. Additionally, the assignment includes short answer questions concerning hypothesis testing for the percentage of employees working over 40 hours per week and the validity of a researcher's conclusion based on a p-value. The goal is to apply statistical methods to draw conclusions and present findings in a clear and concise manner, adhering to specific formatting guidelines.
Document Page
Scenario
You are a new graduate researcher at a social science and psychological sciences research institute. You have been given a
dataset based on the most recent Australian Public Service Commission Census 2016, which is a survey of Australian Public
Service Sector Employees and asked to analyse the data to answer several questions of interest that are presented on the
following pages.
You will use the data set provided for you in the Supporting resources section.
Data preparation
For the purpose of your report, you must use SPSS to draw a random sample of 1500 of the 4352 observations. You will conduct
your analysis on this sample of 1500. Instructions on how to generate your random sample are on pages four (4) to seven (7) of
this document. Once you have drawn your random sample, you may need to modify your data for the binomial test. The instructions
of which are provided on page eight (8). Note, however, that some variables contain missing values. Therefore, each of your
analyses might not contain the entire 1500 cases.
Data analysis
For your assignment, you are required to complete the first four questions by producing the appropriate analyses and writing the
relevant report for each question. You are also required to complete Question 5, which contains two short answer questions. The
reports should follow the format of the model reports provided in the Additional resources section. For each of the first four
questions requiring SPSS, you should include the relevant output (e.g. tables, confidence interval calculations and graphs) with
your report.
You are required to produce the following sets of analyses. Each analysis should be accompanied by a brief report (each report
should be no more than one page).
tabler-icon-diamond-filled.svg

Paraphrase This Document

Need a fresh take? Get an instant paraphrase of this document with our AI Paraphraser
Document Page
Page Description Instructions
1
The
variable ‘WorkE
njoyment’ indic
ates the extent
to which each
employee
agrees with the
statement 'I
enjoy my work'.
Produce the relevant graph and table to summarise the ‘WorkEnjoyment’ variable and write a paragraph
explaining the key features of the data observed in the output in the style presented in the course materials.
2 The
variable ‘JobEn
gagement’ is a
scale
measurement
that indicates
how engaged an
employee is with
the job they
work in. This
variable was
measured on a
scale that can
take values from
0 to 20, with
higher values
representing
greater
Produce the relevant graph and tables to summarise the ‘JobEngagement’ variable and write a paragraph
explaining the key features of the data observed in the output in the style presented in the course materials.
Document Page
Page Description Instructions
employee
engagement
with their job.
3
The
variable ‘Bullied
indicates
whether or not
an employee
has reported
being bullied at
work. An
occupational
health and
safety
researcher at
the institute
hypothesised
that more than
13.7% of
Australian public
service staff
have reported
being bullied at
work.
Conduct a binomial test using the ‘Bullied’variable to test the researcher's claim. Produce the relevant output a
write a binomial test report based on your output in the style presented in the course materials.
4 The
variable ‘TeamE
Conduct a One-sample t-test using the ‘TeamEngagement’ variable to test this claim. Produce the relevant
output and write a One-sample t-test report based on your output in the style presented in the course materials
Document Page
Page Description Instructions
ngagement’ is a
scale score (0 to
20) of how
engaged an
employee is with
the team of
colleagues they
regularly work
with, with higher
values
representing
greater
employee
engagement
with their team.
Previous
research
indicates that
Australian public
service
employees have
an average
'team
engagement'
score of 14.5.
However, an
organisational
psychologist at
the institute has
Include the relevant output with your answer.
tabler-icon-diamond-filled.svg

Paraphrase This Document

Need a fresh take? Get an instant paraphrase of this document with our AI Paraphraser
Document Page
Page Description Instructions
claimed that this
has decreased
due to changes
made by the
current
government.
Short answer questions
5 (a) A researcher
wants to
investigate the
percentage of
public service
employees who
are currently
working more
than 40 hours
per week. The
researcher
hypothesised
that more than
21% of public
service
employees are
currently
working more
than 40 hours
What type of hypothesis test would be appropriate to investigate the researcher's hypothesis?
Document Page
Page Description Instructions
per week. A
random sample
of public service
employees is
obtained and
each person is
asked if they are
currently
working more
than 40 hours
per week ('yes'
or 'no').
5 (b) The researcher
hypothesised
that more than
21% of public
service
employees
currently work
more than 40
hours per week.
He conducted
the appropriate
hypothesis test
and obtained a
p-value of 0.143.
Based on this
Comment on the validity of his conclusion. Provide justification for your conclusion.
Document Page
Page Description Instructions
result, he
concludes that
exactly 21% of
public service
employees
currently work
more than 40
hours per week.
Supporting resources
STA10003_assignment_2_data_2018.sav This data file is used as the basis for this Assignment. You are required to take a
random sample of cases from this data file to use for your Assignment. You should save your random sample of cases in a
secure place, as it will be used for both parts of this Assignment, Part 1 and Part 2.
Assignment 2 part 1 template (DOC 27 KB) . This document is not compulsory—you do not have to use it. It is simply a
template for how to format the page layout of your assignment. While we do strongly recommend you adopt this format and use
the template, you will not lose marks for not doing so. Please rename the document to match your surname and student
number.
Model reports (PDF 119 KB) relevant to Assignment 2. This file contains model reports using a range of statistical tests
covered in the unit. Only use the model reports relevant to the statistical tests covered in this assessment task.
Instructions for generating random sample (PDF 311 KB) .
Modifying your assignment data file to produce the binomial test.
The videos below may assist you in generating your random sample, and modifying your data file to product the binomial test. The
PDF instructions above also outline these processes.
tabler-icon-diamond-filled.svg

Paraphrase This Document

Need a fresh take? Get an instant paraphrase of this document with our AI Paraphraser
Document Page
chevron_up_icon
1 out of 8
circle_padding
hide_on_mobile
zoom_out_icon