Quantitative Methods Assignment: Probability, Regression, and Finance
VerifiedAdded on 2023/06/10
|14
|2838
|214
Homework Assignment
AI Summary
This document presents a comprehensive solution to a quantitative methods assignment. The assignment encompasses several key areas, including the development of joint probability tables to analyze the relationship between occupation and gender, and to determine independence. Regression analysis is used to create an equation for predicting sales revenue based on investment and advertising expenditure, including coefficient interpretation and an assessment of the model's goodness of fit. The solution also covers compound interest calculations, exploring both annual and quarterly compounding scenarios. Furthermore, the assignment includes the application of statistical tests, such as F-tests and t-tests, to evaluate the overall significance of the regression model and the significance of individual variables, such as population and tax received. Finally, the solution addresses financial calculations related to employee fringe benefits and IRA amounts with compound interest.
SG1022 Quantitative
Methods
Methods
Paraphrase This Document
Need a fresh take? Get an instant paraphrase of this document with our AI Paraphraser
Contents
QUESTION 1...................................................................................................................................4
a) Develop a joint probability table for the data on occupation of workers................................4
b) Determine what is the probability of a female worker being a civil engineer........................4
c) Determine what is the probability of a male worker being a Chief Executive Officer...........4
d) Determine whether occupation is independent of gender and justify your answer with a
probability calculation. Please show your calculations...............................................................5
Question 2........................................................................................................................................5
a. Develop a joint probability table and show the marginal probabilities of men, women, part
time and full time. Comment on the results.................................................................................5
b) If a person is working in full time, what is the probability given that the selected person is a
male..............................................................................................................................................5
c) If a person works part time, what is the probability given that the selected person is a
female...........................................................................................................................................6
d) Let A denote the event that a person is a full time and let B be the event that the person is a
female. Determine whether A and B are independent events and justify the answer..................6
Question 3........................................................................................................................................6
Develop the regression equation that can be used to predict the Sales revenue by investment
and advertisement........................................................................................................................6
c) What is the estimate for the weekly sales revenue when £13000 is spent on inventory
investment and £5000 spent on advertising.................................................................................7
b) Provide an explanation for the regression coefficients b1 and b2 from the regression
equation........................................................................................................................................8
d) Explain whether the regression equation developed in part (a) provides a good fit for the
observed data by interpreting the coefficient of determination...................................................9
Question 4........................................................................................................................................9
a) Conduct an F-test to determine the overall significance of the regression model...................9
b) Use the t- test to determine the significance of each independent variable namely Population
and Tax Received. Explain the conclusion at the 0.05 level of significance...............................9
Question 5......................................................................................................................................10
a) Compounded annual and explain...........................................................................................10
b) Compounded quarterly and explain.......................................................................................11
Question 6......................................................................................................................................11
Question 7......................................................................................................................................12
REFERENCES..............................................................................................................................14
⊘ This is a preview!⊘
Do you want full access?
Subscribe today to unlock all pages.
Trusted by 1+ million students worldwide
QUESTION 1
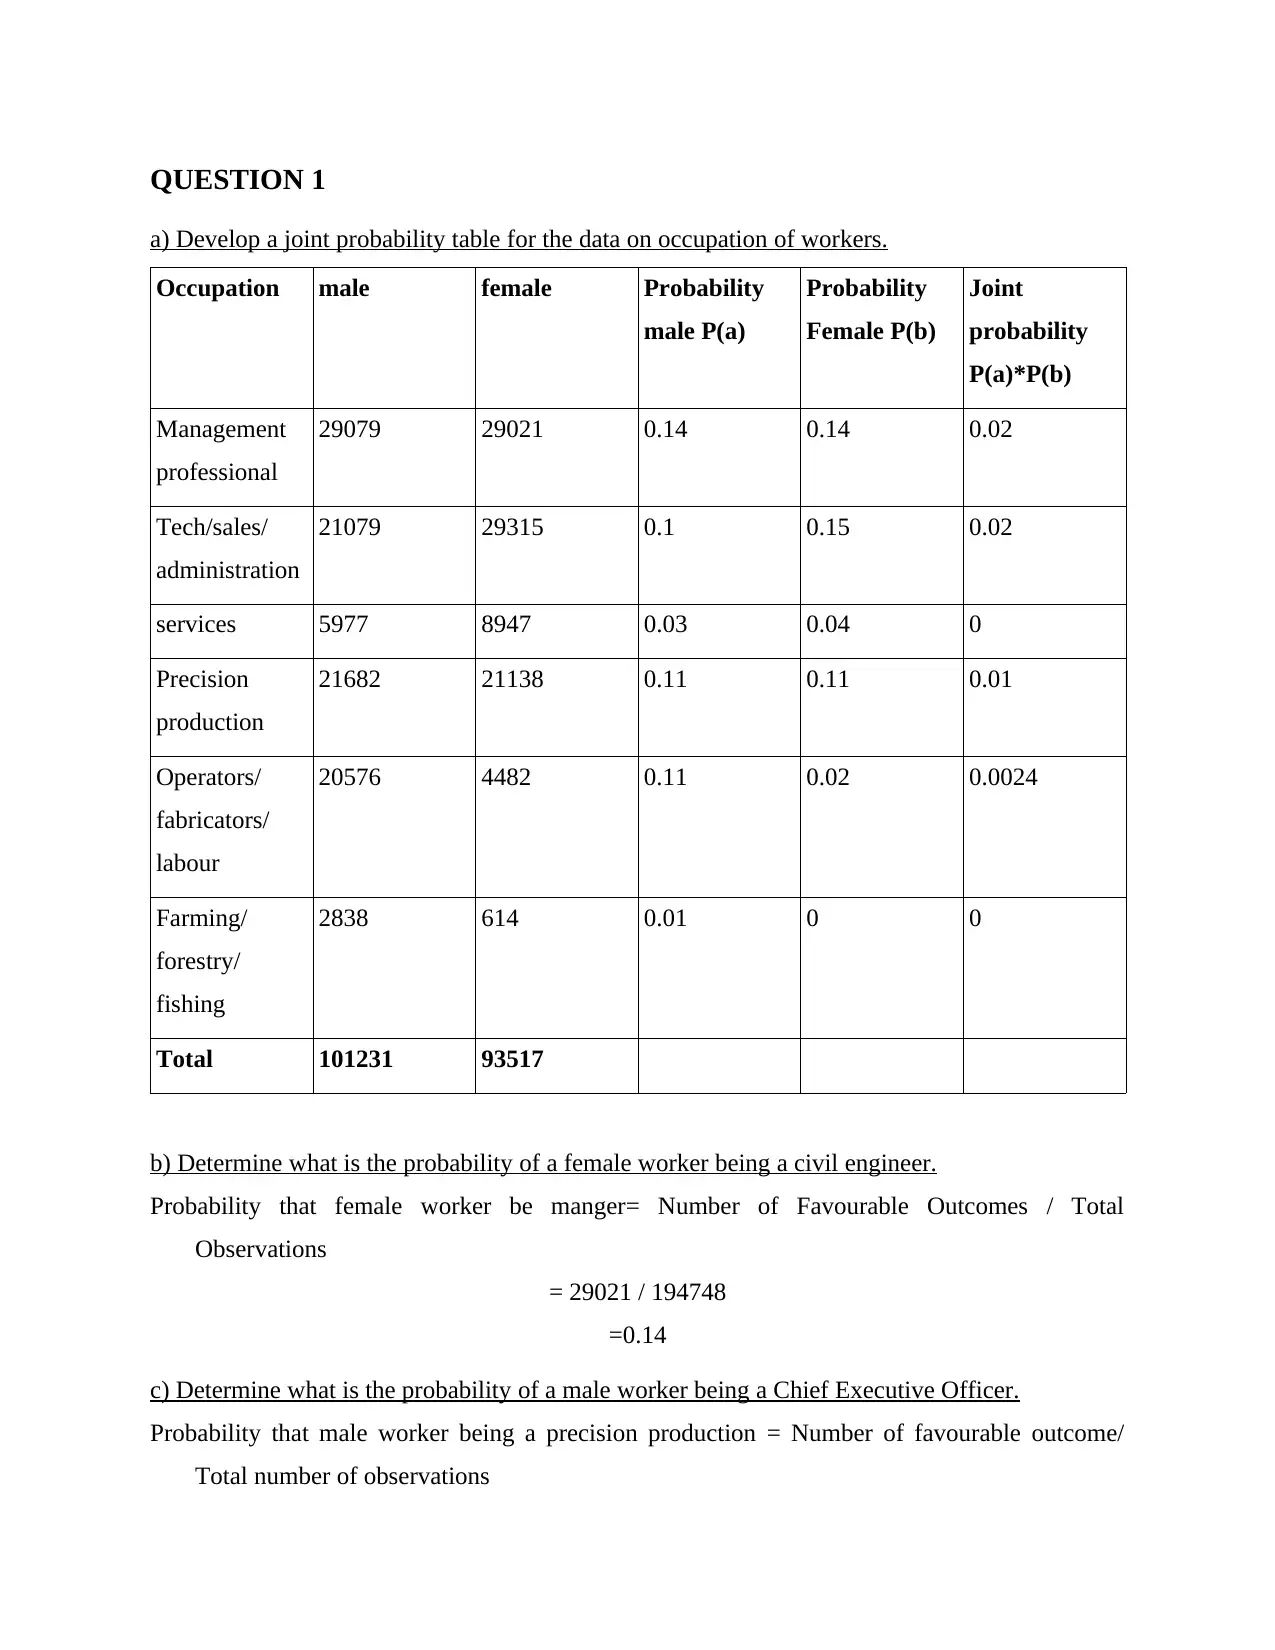
a) Develop a joint probability table for the data on occupation of workers.
Occupation male female Probability
male P(a)
Probability
Female P(b)
Joint
probability
P(a)*P(b)
Management
professional
29079 29021 0.14 0.14 0.02
Tech/sales/
administration
21079 29315 0.1 0.15 0.02
services 5977 8947 0.03 0.04 0
Precision
production
21682 21138 0.11 0.11 0.01
Operators/
fabricators/
labour
20576 4482 0.11 0.02 0.0024
Farming/
forestry/
fishing
2838 614 0.01 0 0
Total 101231 93517
b) Determine what is the probability of a female worker being a civil engineer.
Probability that female worker be manger= Number of Favourable Outcomes / Total
Observations
= 29021 / 194748
=0.14
c) Determine what is the probability of a male worker being a Chief Executive Officer.
Probability that male worker being a precision production = Number of favourable outcome/
Total number of observations
Paraphrase This Document
Need a fresh take? Get an instant paraphrase of this document with our AI Paraphraser
= 21682 / 194748
= 0.111
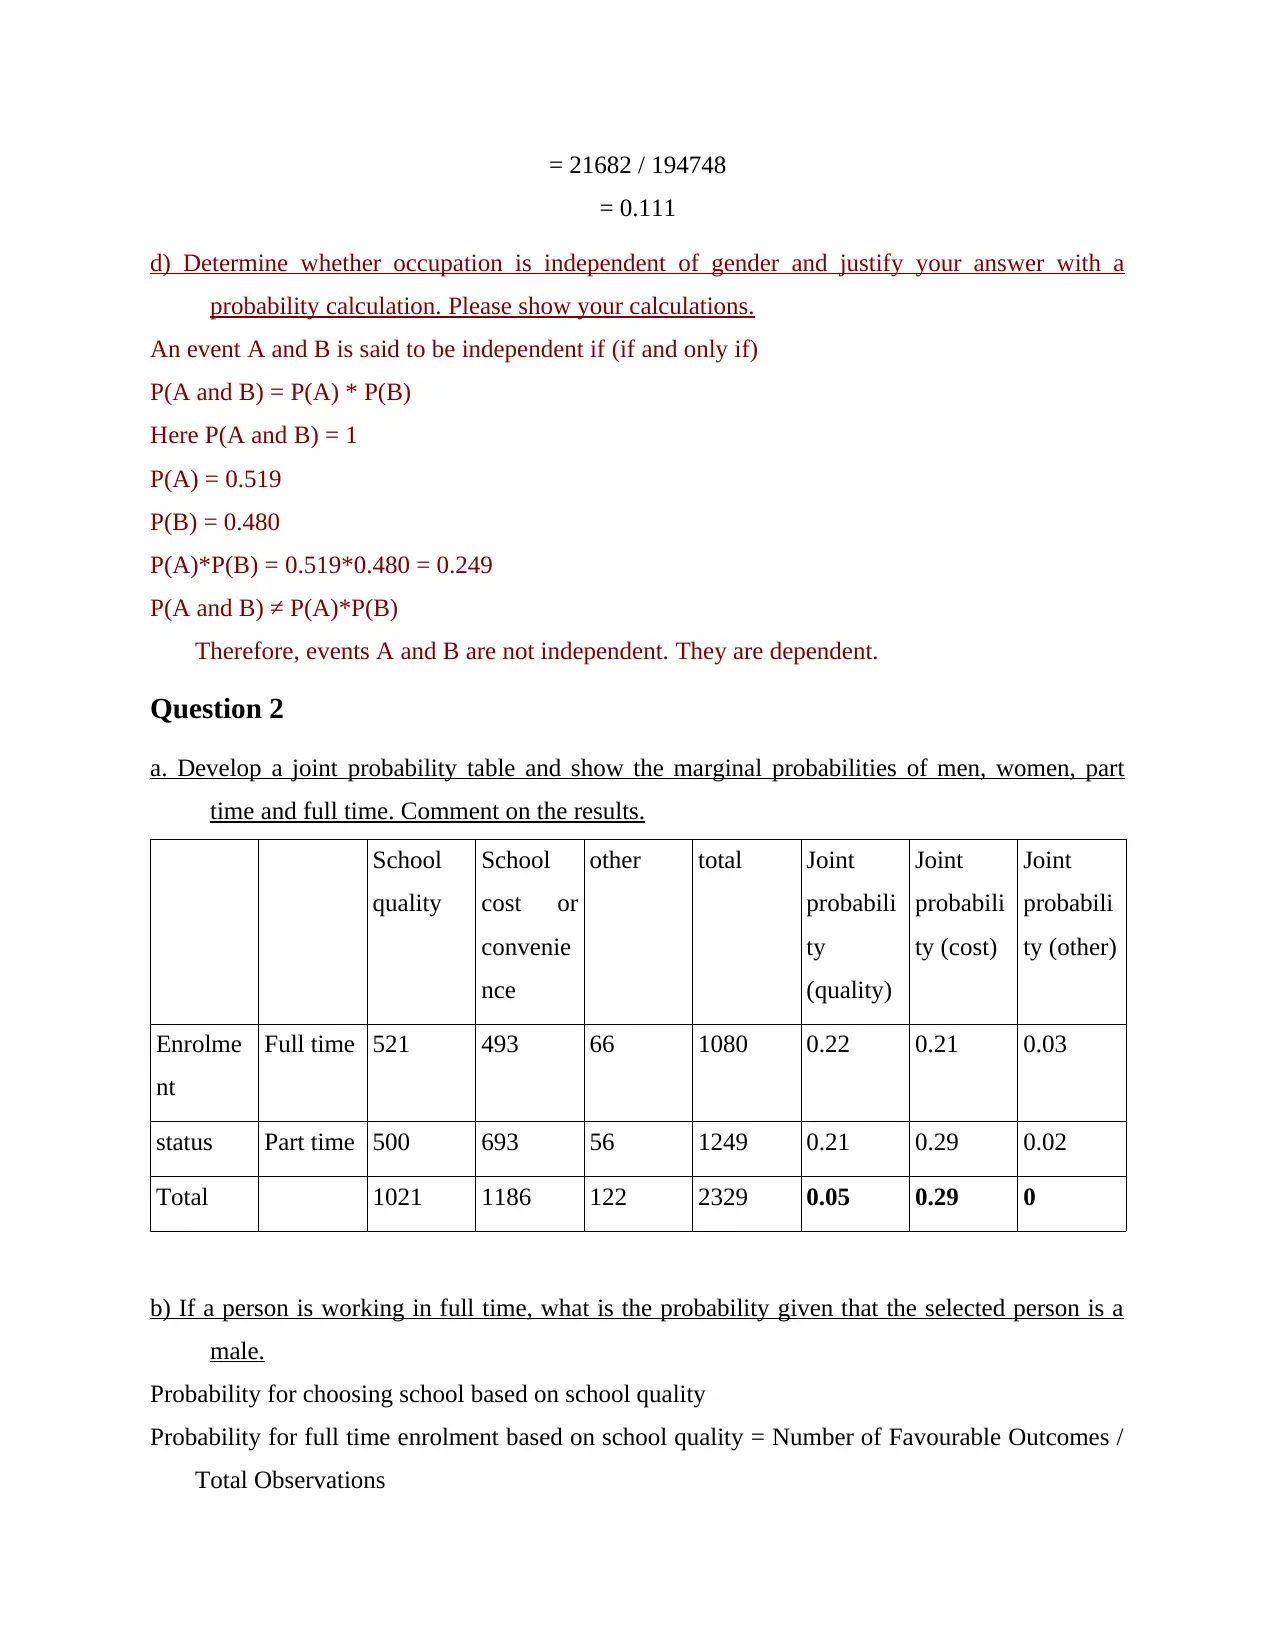
d) Determine whether occupation is independent of gender and justify your answer with a
probability calculation. Please show your calculations.
An event A and B is said to be independent if (if and only if)
P(A and B) = P(A) * P(B)
Here P(A and B) = 1
P(A) = 0.519
P(B) = 0.480
P(A)*P(B) = 0.519*0.480 = 0.249
P(A and B) ≠ P(A)*P(B)
Therefore, events A and B are not independent. They are dependent.
Question 2
a. Develop a joint probability table and show the marginal probabilities of men, women, part
time and full time. Comment on the results.
School
quality
School
cost or
convenie
nce
other total Joint
probabili
ty
(quality)
Joint
probabili
ty (cost)
Joint
probabili
ty (other)
Enrolme
nt
Full time 521 493 66 1080 0.22 0.21 0.03
status Part time 500 693 56 1249 0.21 0.29 0.02
Total 1021 1186 122 2329 0.05 0.29 0
b) If a person is working in full time, what is the probability given that the selected person is a
male.
Probability for choosing school based on school quality
Probability for full time enrolment based on school quality = Number of Favourable Outcomes /
Total Observations
= 0.111
d) Determine whether occupation is independent of gender and justify your answer with a
probability calculation. Please show your calculations.
An event A and B is said to be independent if (if and only if)
P(A and B) = P(A) * P(B)
Here P(A and B) = 1
P(A) = 0.519
P(B) = 0.480
P(A)*P(B) = 0.519*0.480 = 0.249
P(A and B) ≠ P(A)*P(B)
Therefore, events A and B are not independent. They are dependent.
Question 2
a. Develop a joint probability table and show the marginal probabilities of men, women, part
time and full time. Comment on the results.
School
quality
School
cost or
convenie
nce
other total Joint
probabili
ty
(quality)
Joint
probabili
ty (cost)
Joint
probabili
ty (other)
Enrolme
nt
Full time 521 493 66 1080 0.22 0.21 0.03
status Part time 500 693 56 1249 0.21 0.29 0.02
Total 1021 1186 122 2329 0.05 0.29 0
b) If a person is working in full time, what is the probability given that the selected person is a
male.
Probability for choosing school based on school quality
Probability for full time enrolment based on school quality = Number of Favourable Outcomes /
Total Observations
= 521 / 2329
= 0.22
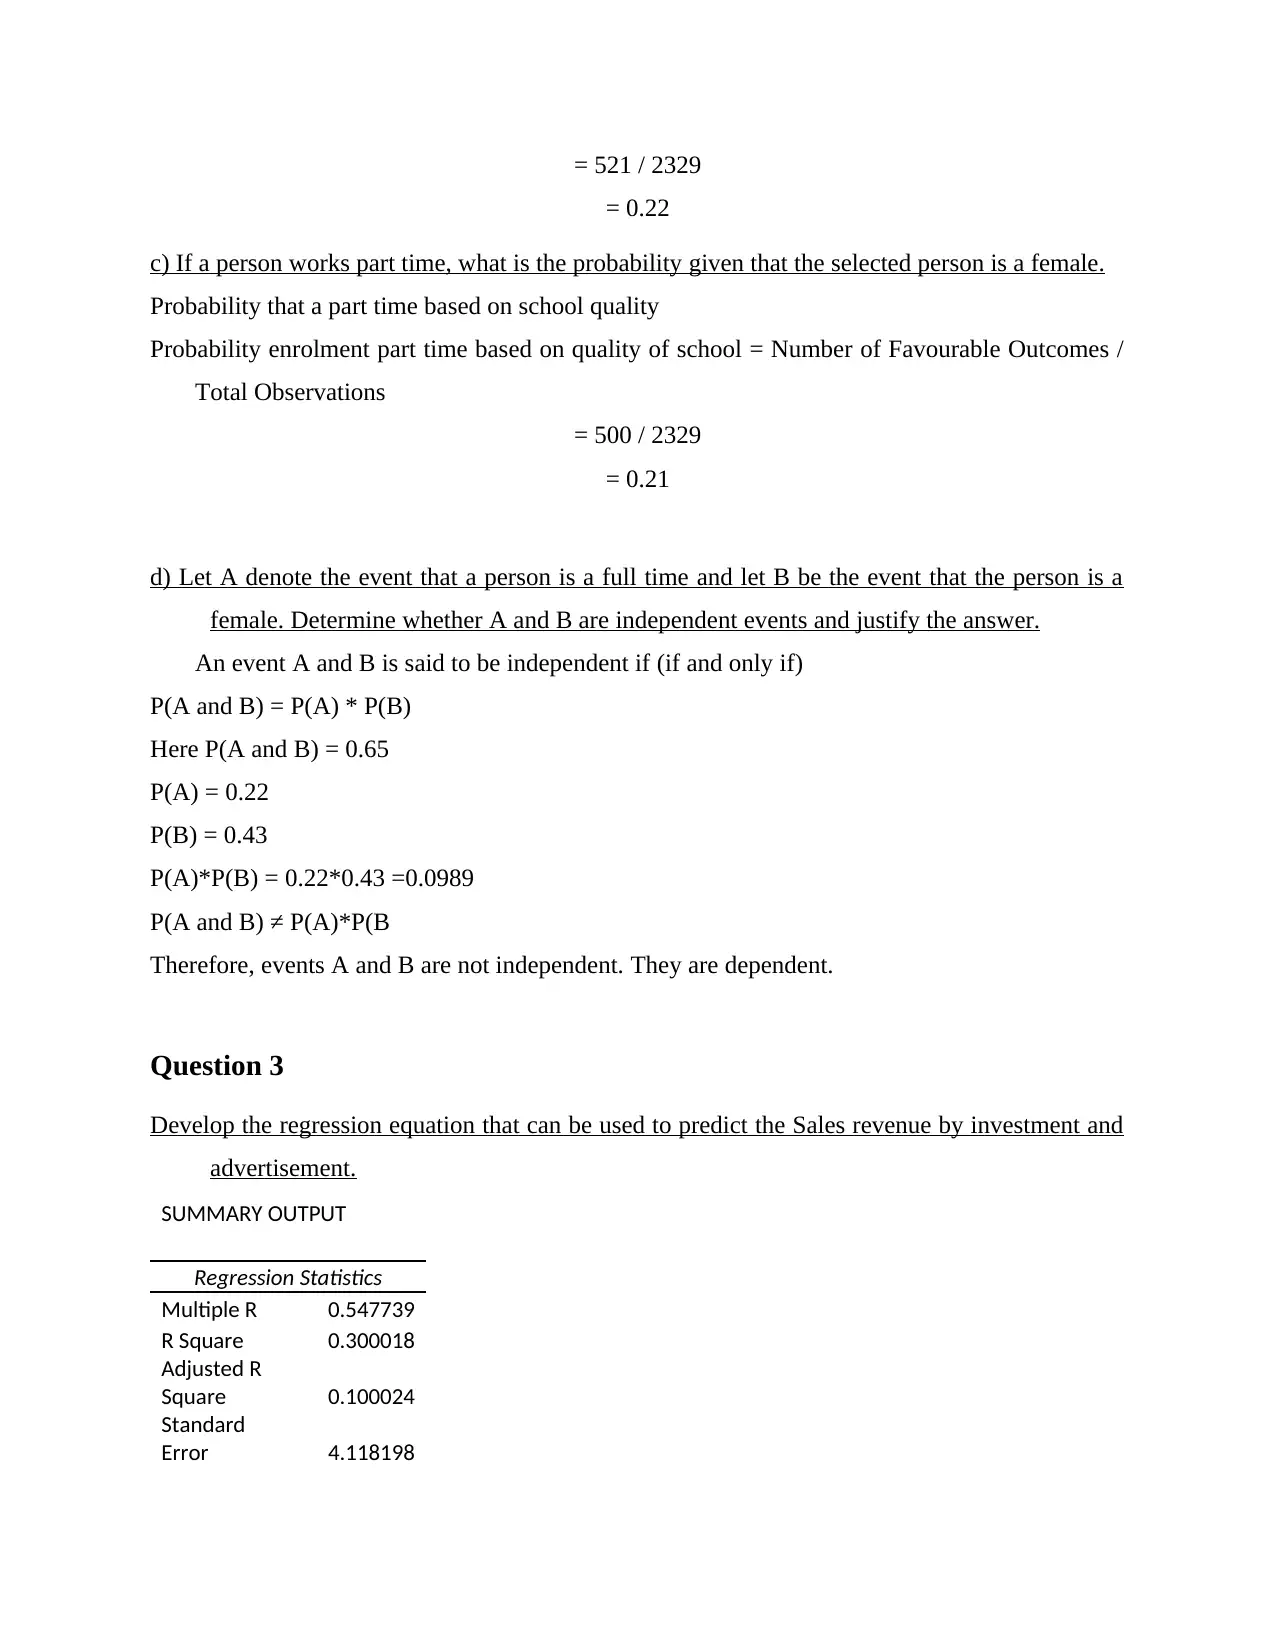
c) If a person works part time, what is the probability given that the selected person is a female.
Probability that a part time based on school quality
Probability enrolment part time based on quality of school = Number of Favourable Outcomes /
Total Observations
= 500 / 2329
= 0.21
d) Let A denote the event that a person is a full time and let B be the event that the person is a
female. Determine whether A and B are independent events and justify the answer.
An event A and B is said to be independent if (if and only if)
P(A and B) = P(A) * P(B)
Here P(A and B) = 0.65
P(A) = 0.22
P(B) = 0.43
P(A)*P(B) = 0.22*0.43 =0.0989
P(A and B) ≠ P(A)*P(B
Therefore, events A and B are not independent. They are dependent.
Question 3
Develop the regression equation that can be used to predict the Sales revenue by investment and
advertisement.
SUMMARY OUTPUT
Regression Statistics
Multiple R 0.547739
R Square 0.300018
Adjusted R
Square 0.100024
Standard
Error 4.118198
= 0.22
c) If a person works part time, what is the probability given that the selected person is a female.
Probability that a part time based on school quality
Probability enrolment part time based on quality of school = Number of Favourable Outcomes /
Total Observations
= 500 / 2329
= 0.21
d) Let A denote the event that a person is a full time and let B be the event that the person is a
female. Determine whether A and B are independent events and justify the answer.
An event A and B is said to be independent if (if and only if)
P(A and B) = P(A) * P(B)
Here P(A and B) = 0.65
P(A) = 0.22
P(B) = 0.43
P(A)*P(B) = 0.22*0.43 =0.0989
P(A and B) ≠ P(A)*P(B
Therefore, events A and B are not independent. They are dependent.
Question 3
Develop the regression equation that can be used to predict the Sales revenue by investment and
advertisement.
SUMMARY OUTPUT
Regression Statistics
Multiple R 0.547739
R Square 0.300018
Adjusted R
Square 0.100024
Standard
Error 4.118198
⊘ This is a preview!⊘
Do you want full access?
Subscribe today to unlock all pages.
Trusted by 1+ million students worldwide
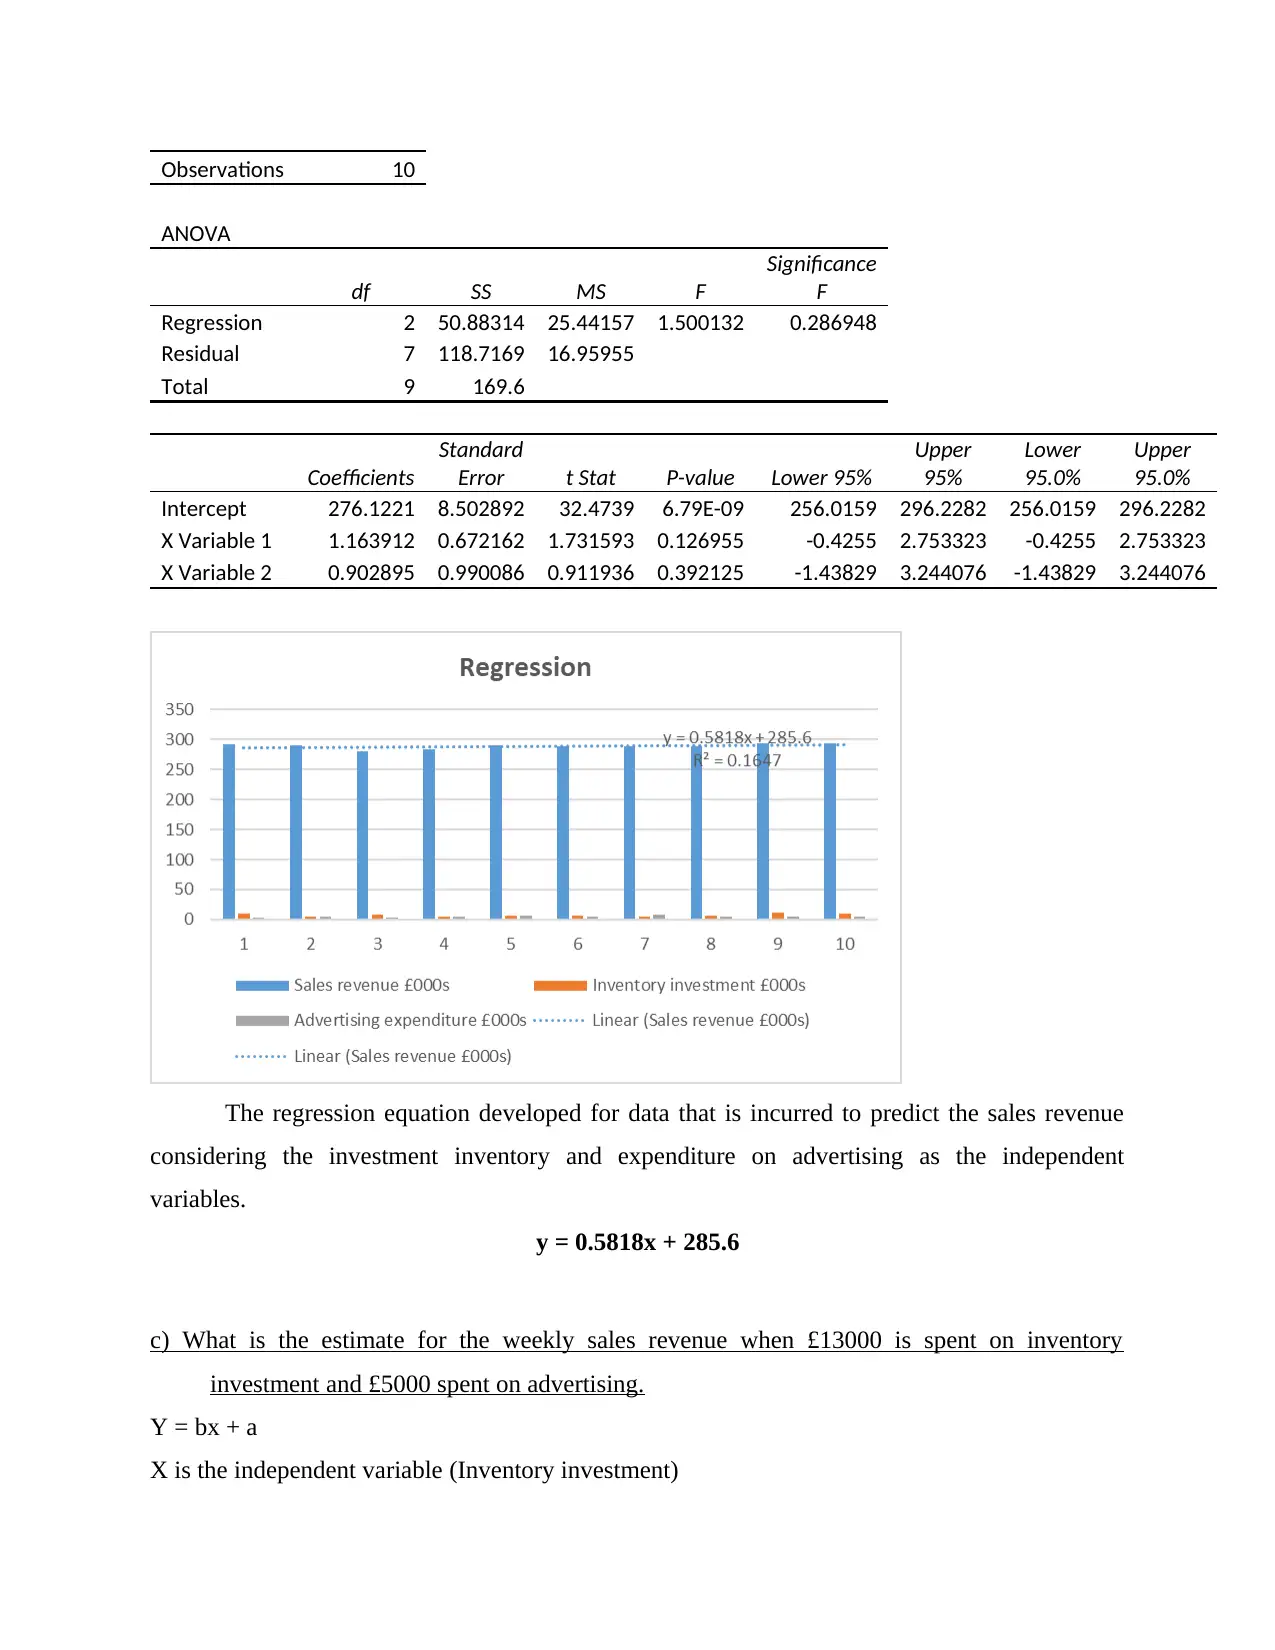
Observations 10
ANOVA
df SS MS F
Significance
F
Regression 2 50.88314 25.44157 1.500132 0.286948
Residual 7 118.7169 16.95955
Total 9 169.6
Coefficients
Standard
Error t Stat P-value Lower 95%
Upper
95%
Lower
95.0%
Upper
95.0%
Intercept 276.1221 8.502892 32.4739 6.79E-09 256.0159 296.2282 256.0159 296.2282
X Variable 1 1.163912 0.672162 1.731593 0.126955 -0.4255 2.753323 -0.4255 2.753323
X Variable 2 0.902895 0.990086 0.911936 0.392125 -1.43829 3.244076 -1.43829 3.244076
The regression equation developed for data that is incurred to predict the sales revenue
considering the investment inventory and expenditure on advertising as the independent
variables.
y = 0.5818x + 285.6
c) What is the estimate for the weekly sales revenue when £13000 is spent on inventory
investment and £5000 spent on advertising.
Y = bx + a
X is the independent variable (Inventory investment)
Paraphrase This Document
Need a fresh take? Get an instant paraphrase of this document with our AI Paraphraser
Y is the dependent variable (GDP)
b is the slope of the line
a is the point of interception, or what Y equals when X is zero
Estimation forecasted value for sales revenue for inventory investment:
Y = 0.5818x + 285.6
Y = (0.5818 * 13000) + 285.6
Y = 7563.4 + 285.6
Y = £ 7849
Estimation forecasted value for sales revenue for advertising expenditure:
Y = 0.5818x + 285.6
Y = (0.5818 * 5000) + 285.6
Y = 2909 + 285.6
Y = £ 3194.6
b) Provide an explanation for the regression coefficients b1 and b2 from the regression equation.
The regression coefficients for both the variables inventory investment and advertising
expenditure is 1.163912 and 0.902895.
The regression coefficient is the consistent "b" under the relapse condition, which tells the
adjustment of the value of the ward variable in relation to the unit change in the independent
variable.
Based on the above information, it is tempting to show that the recurrence coefficient will
be 2. In direct or different direct recurrences, the magnitude of the coefficient for each free factor
gives you the magnitude of the effect of that variable on your dependent variable, and the sign
(positive or negative) on the coefficient gives you a guide to the effect. When using a separate
free factor recurrence, the coefficient lets you know how much the dependent variable should
increase (assuming a positive coefficient) or decrease (assuming a negative coefficient) when the
independent variable increases by 1. In a recurrence with many autonomous factors, this
coefficient lets you know how much the dependent variable should increase when the free factor
increases by 1, keeping the broad range of the various free factors consistent.
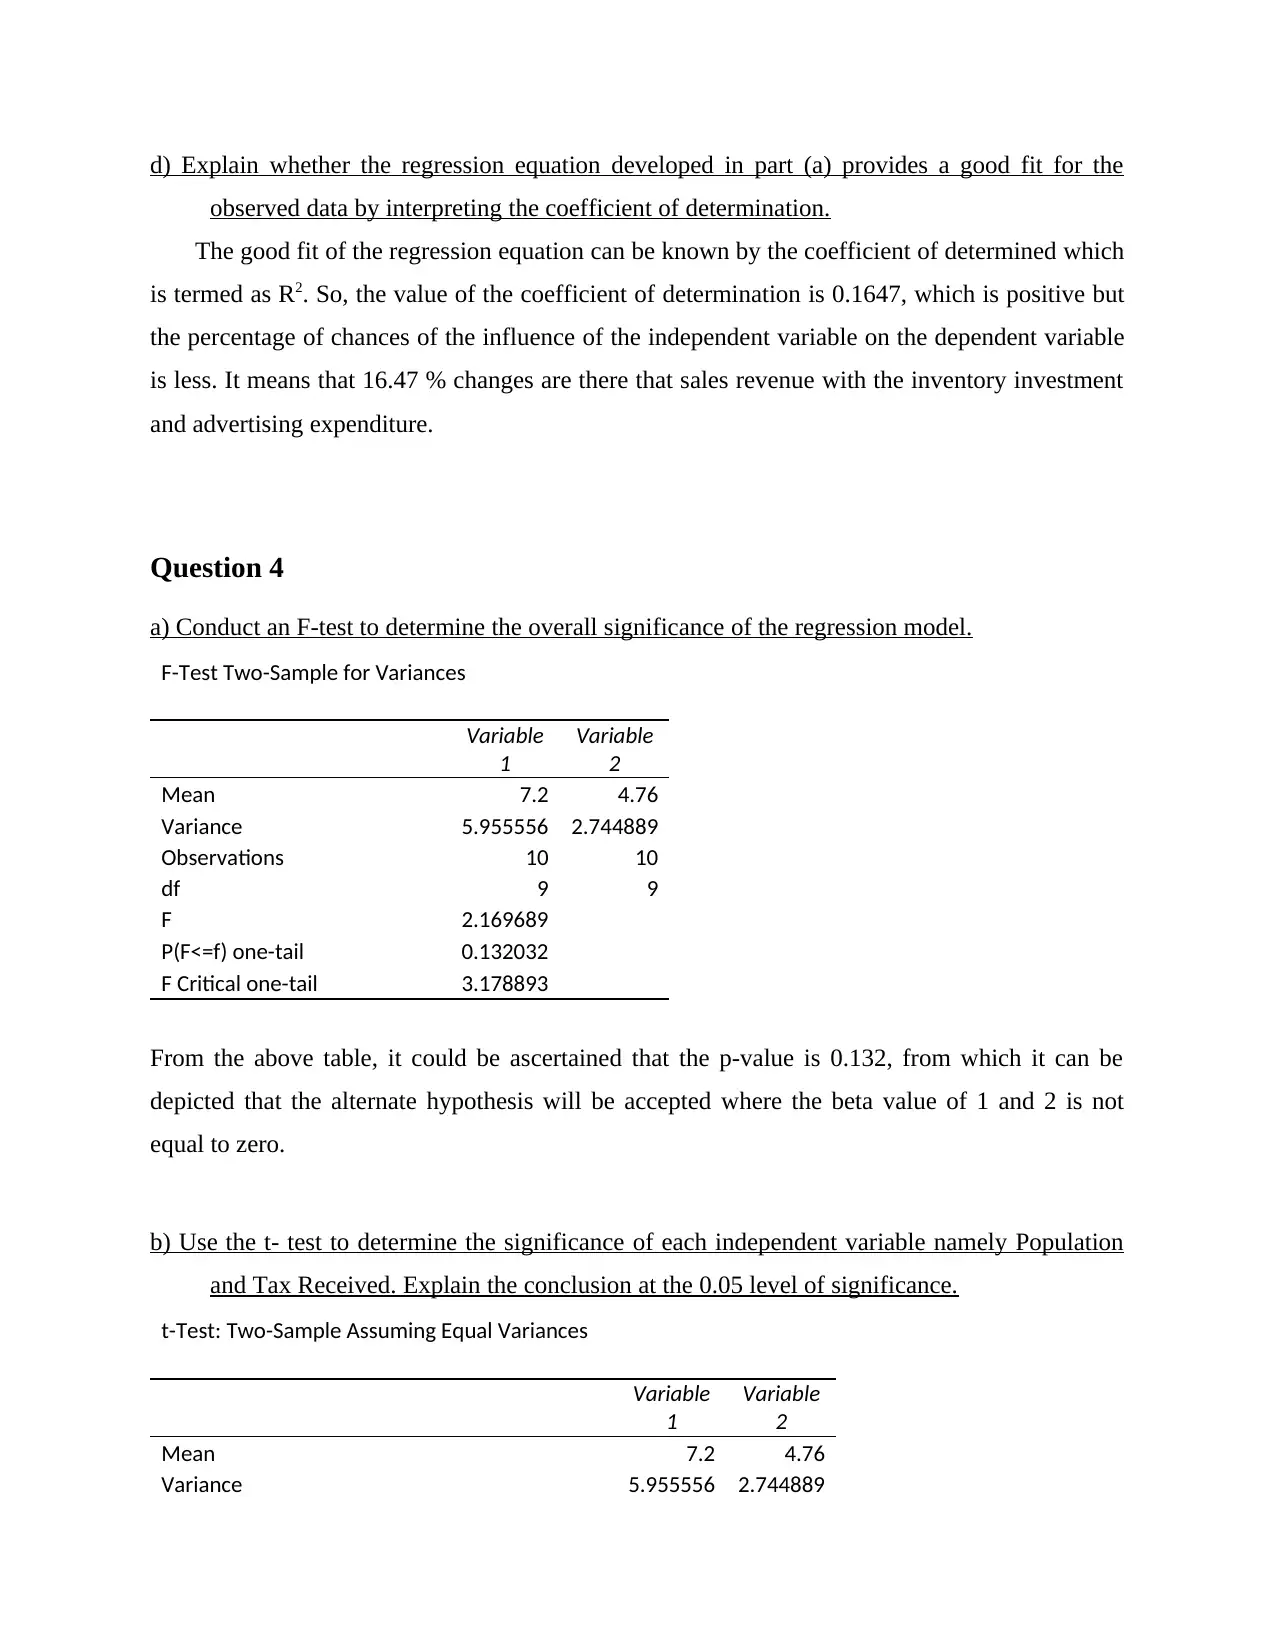
d) Explain whether the regression equation developed in part (a) provides a good fit for the
observed data by interpreting the coefficient of determination.
The good fit of the regression equation can be known by the coefficient of determined which
is termed as R2. So, the value of the coefficient of determination is 0.1647, which is positive but
the percentage of chances of the influence of the independent variable on the dependent variable
is less. It means that 16.47 % changes are there that sales revenue with the inventory investment
and advertising expenditure.
Question 4
a) Conduct an F-test to determine the overall significance of the regression model.
F-Test Two-Sample for Variances
Variable
1
Variable
2
Mean 7.2 4.76
Variance 5.955556 2.744889
Observations 10 10
df 9 9
F 2.169689
P(F<=f) one-tail 0.132032
F Critical one-tail 3.178893
From the above table, it could be ascertained that the p-value is 0.132, from which it can be
depicted that the alternate hypothesis will be accepted where the beta value of 1 and 2 is not
equal to zero.
b) Use the t- test to determine the significance of each independent variable namely Population
and Tax Received. Explain the conclusion at the 0.05 level of significance.
t-Test: Two-Sample Assuming Equal Variances
Variable
1
Variable
2
Mean 7.2 4.76
Variance 5.955556 2.744889
⊘ This is a preview!⊘
Do you want full access?
Subscribe today to unlock all pages.
Trusted by 1+ million students worldwide
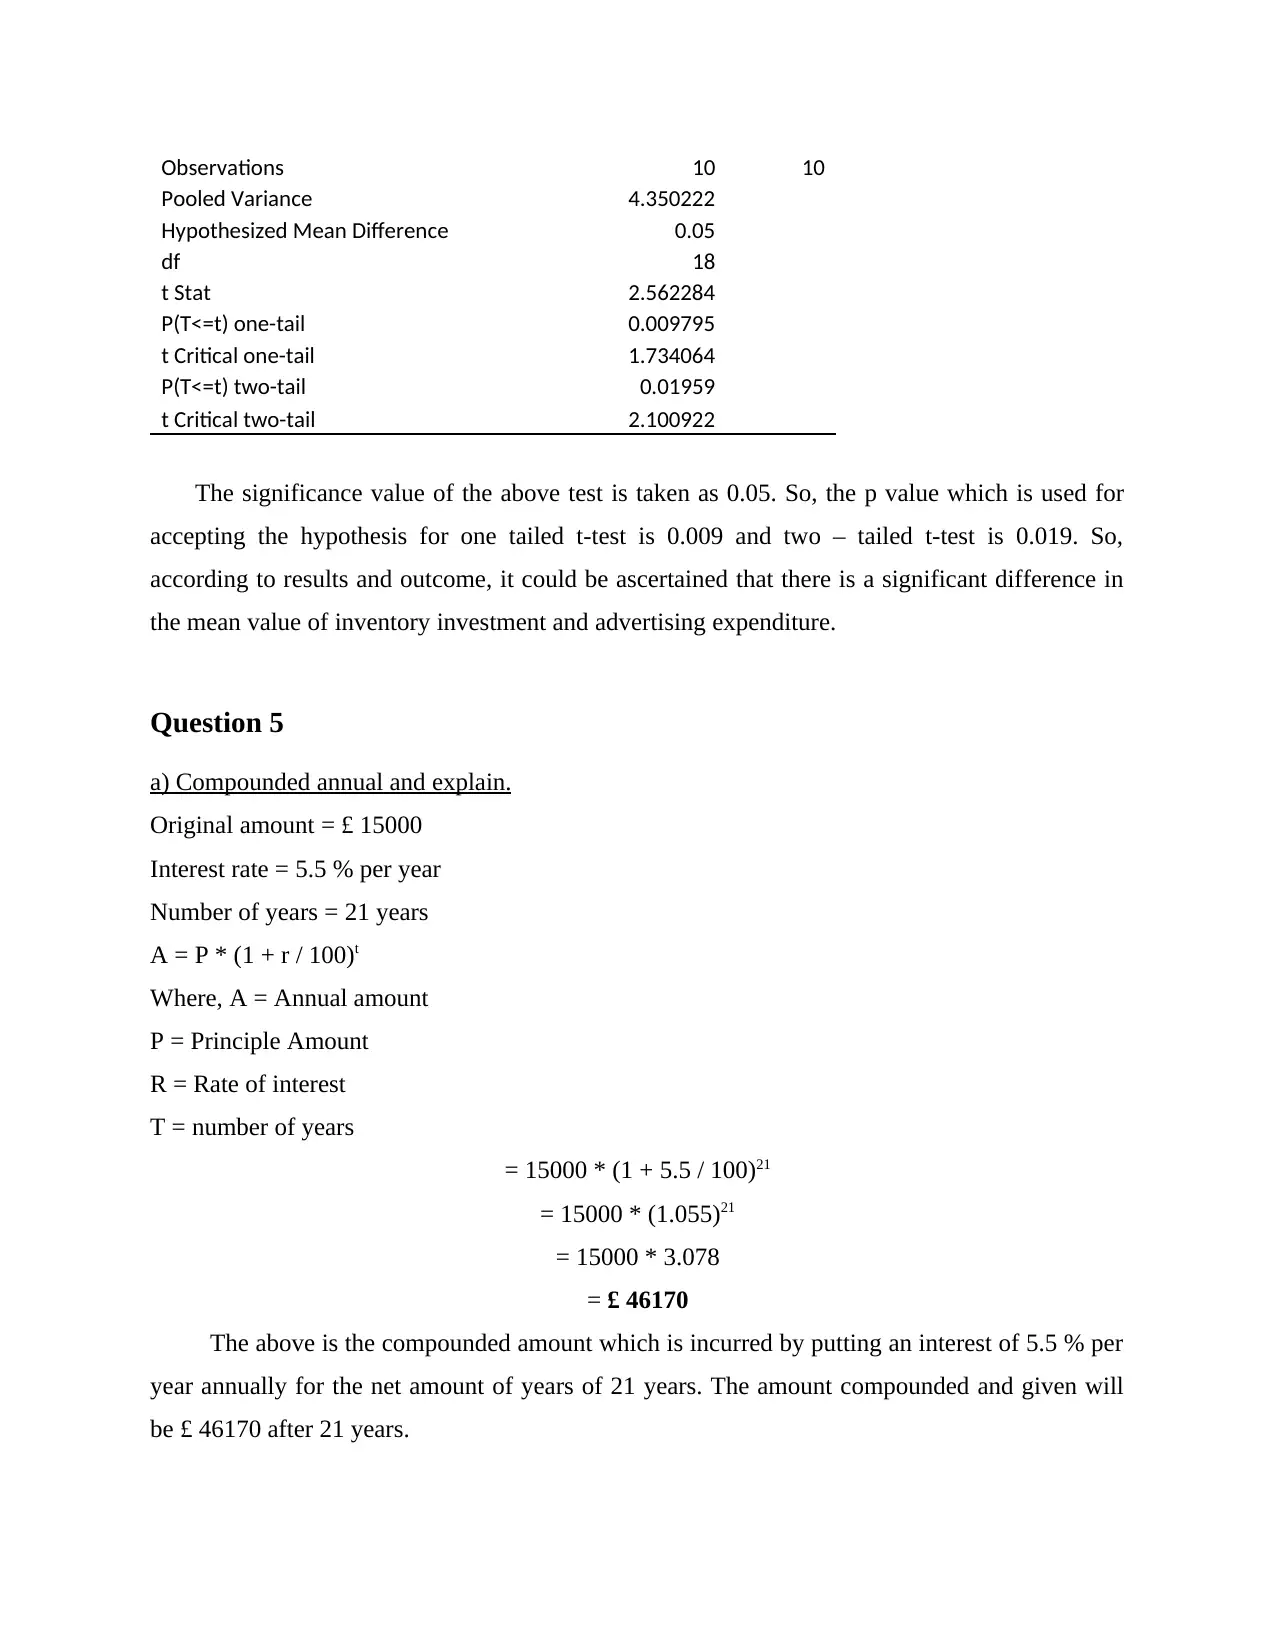
Observations 10 10
Pooled Variance 4.350222
Hypothesized Mean Difference 0.05
df 18
t Stat 2.562284
P(T<=t) one-tail 0.009795
t Critical one-tail 1.734064
P(T<=t) two-tail 0.01959
t Critical two-tail 2.100922
The significance value of the above test is taken as 0.05. So, the p value which is used for
accepting the hypothesis for one tailed t-test is 0.009 and two – tailed t-test is 0.019. So,
according to results and outcome, it could be ascertained that there is a significant difference in
the mean value of inventory investment and advertising expenditure.
Question 5
a) Compounded annual and explain.
Original amount = £ 15000
Interest rate = 5.5 % per year
Number of years = 21 years
A = P * (1 + r / 100)t
Where, A = Annual amount
P = Principle Amount
R = Rate of interest
T = number of years
= 15000 * (1 + 5.5 / 100)21
= 15000 * (1.055)21
= 15000 * 3.078
= £ 46170
The above is the compounded amount which is incurred by putting an interest of 5.5 % per
year annually for the net amount of years of 21 years. The amount compounded and given will
be £ 46170 after 21 years.
Paraphrase This Document
Need a fresh take? Get an instant paraphrase of this document with our AI Paraphraser
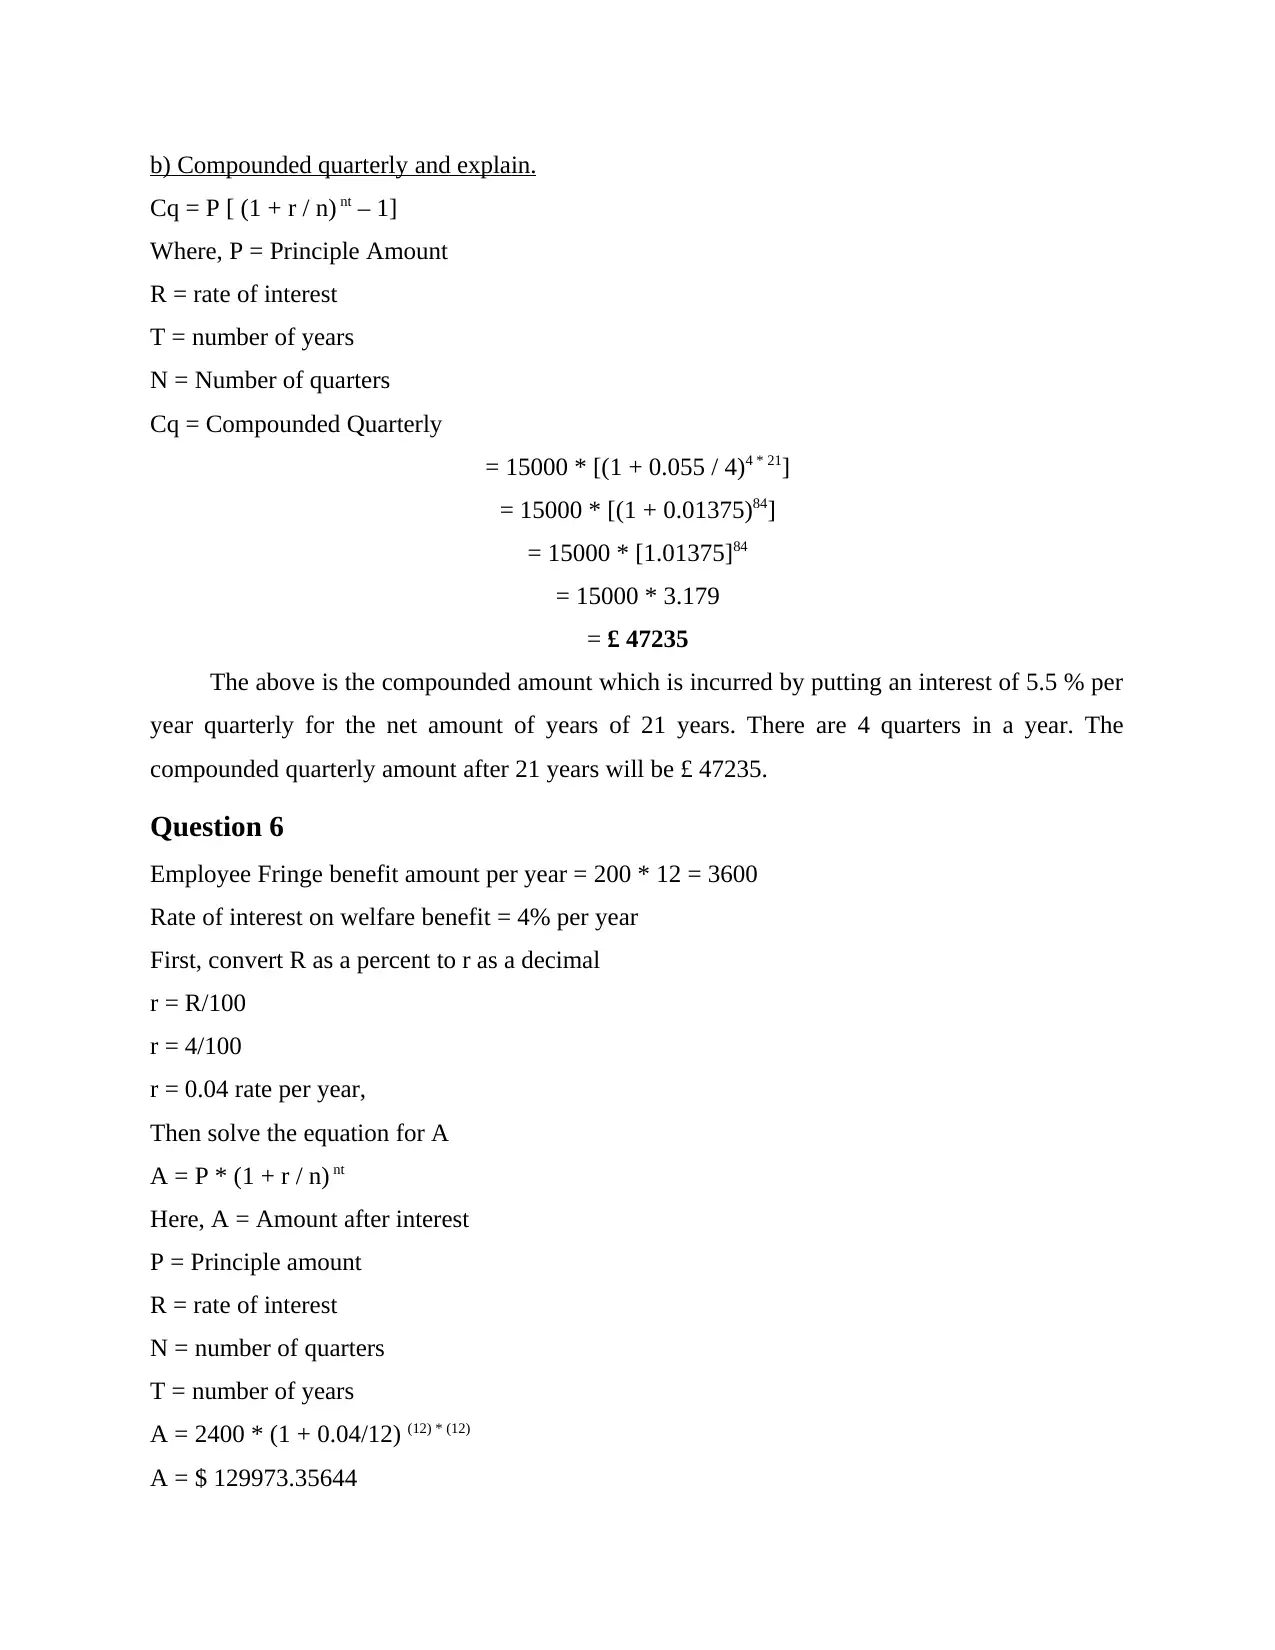
b) Compounded quarterly and explain.
Cq = P [ (1 + r / n) nt – 1]
Where, P = Principle Amount
R = rate of interest
T = number of years
N = Number of quarters
Cq = Compounded Quarterly
= 15000 * [(1 + 0.055 / 4)4 * 21]
= 15000 * [(1 + 0.01375)84]
= 15000 * [1.01375]84
= 15000 * 3.179
= £ 47235
The above is the compounded amount which is incurred by putting an interest of 5.5 % per
year quarterly for the net amount of years of 21 years. There are 4 quarters in a year. The
compounded quarterly amount after 21 years will be £ 47235.
Question 6
Employee Fringe benefit amount per year = 200 * 12 = 3600
Rate of interest on welfare benefit = 4% per year
First, convert R as a percent to r as a decimal
r = R/100
r = 4/100
r = 0.04 rate per year,
Then solve the equation for A
A = P * (1 + r / n) nt
Here, A = Amount after interest
P = Principle amount
R = rate of interest
N = number of quarters
T = number of years
A = 2400 * (1 + 0.04/12) (12) * (12)
A = $ 129973.35644
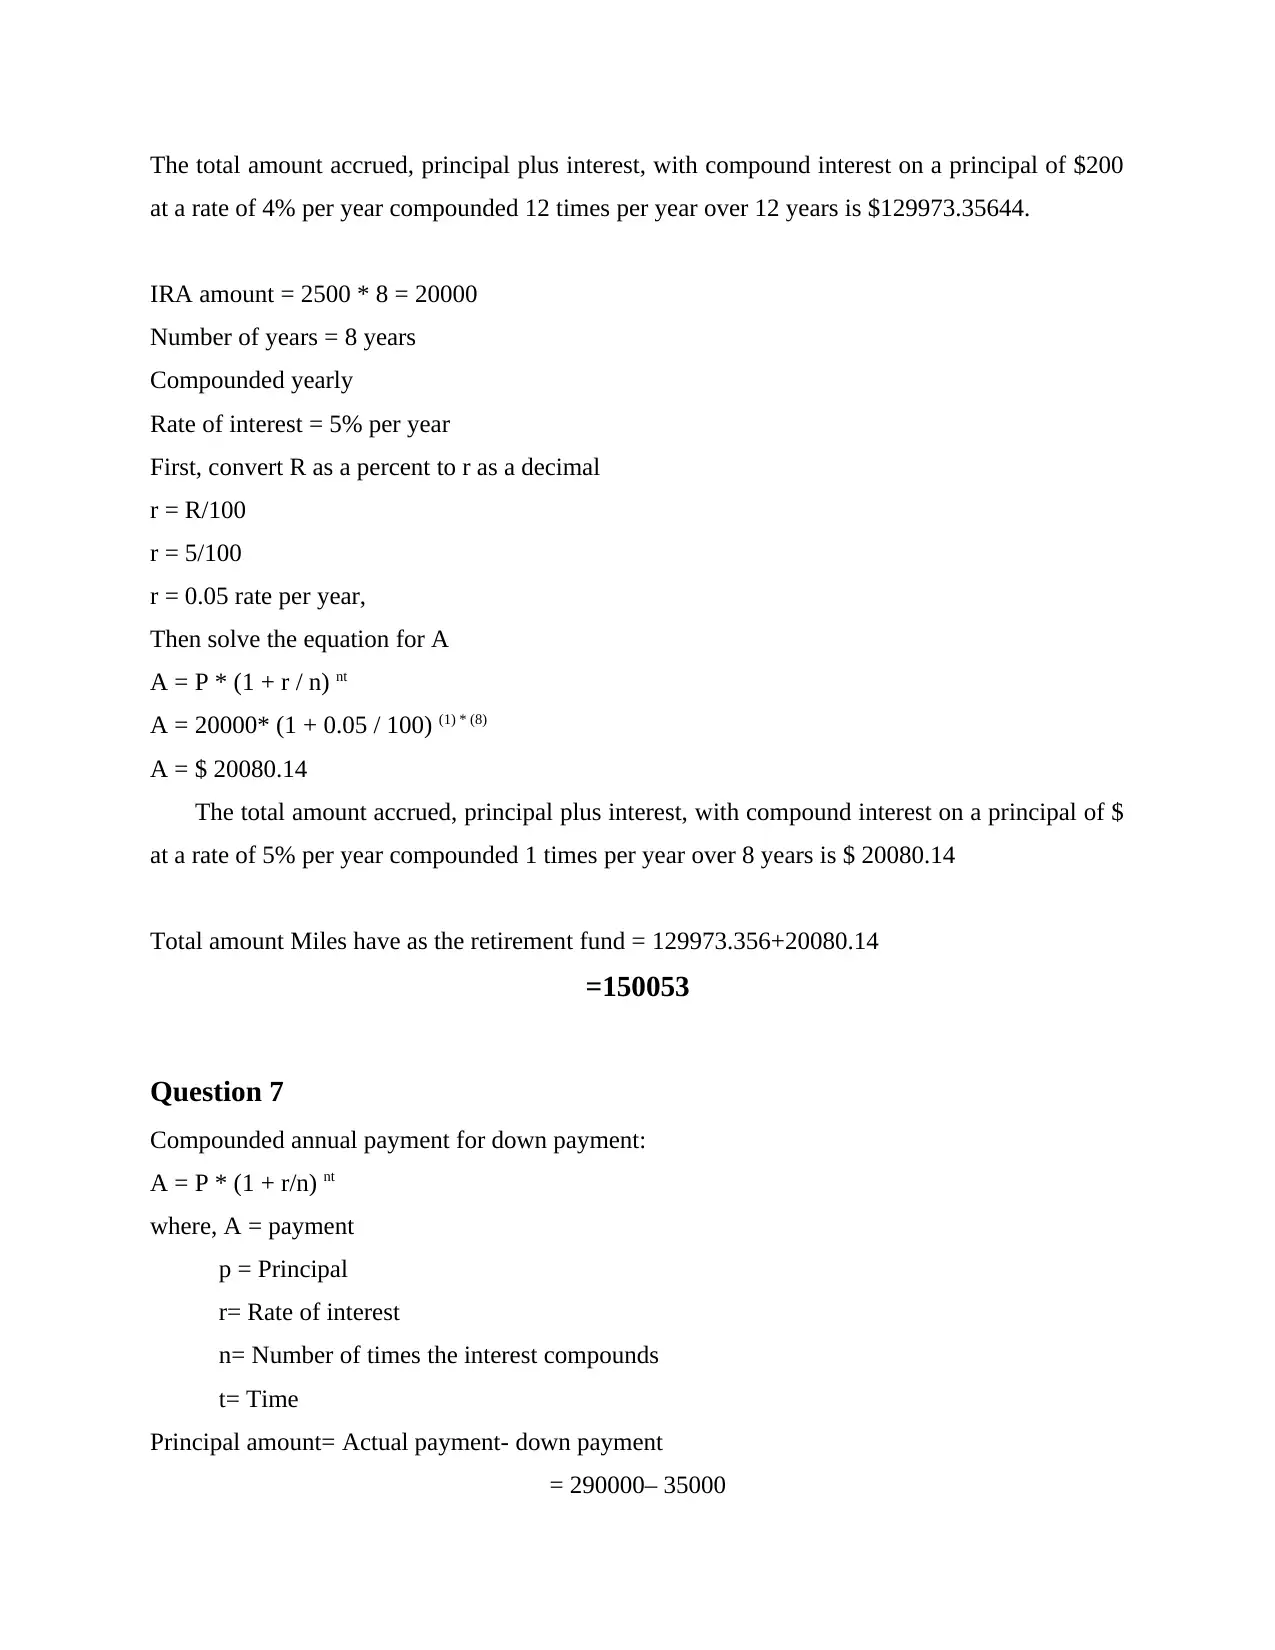
The total amount accrued, principal plus interest, with compound interest on a principal of $200
at a rate of 4% per year compounded 12 times per year over 12 years is $129973.35644.
IRA amount = 2500 * 8 = 20000
Number of years = 8 years
Compounded yearly
Rate of interest = 5% per year
First, convert R as a percent to r as a decimal
r = R/100
r = 5/100
r = 0.05 rate per year,
Then solve the equation for A
A = P * (1 + r / n) nt
A = 20000* (1 + 0.05 / 100) (1) * (8)
A = $ 20080.14
The total amount accrued, principal plus interest, with compound interest on a principal of $
at a rate of 5% per year compounded 1 times per year over 8 years is $ 20080.14
Total amount Miles have as the retirement fund = 129973.356+20080.14
=150053
Question 7
Compounded annual payment for down payment:
A = P * (1 + r/n) nt
where, A = payment
p = Principal
r= Rate of interest
n= Number of times the interest compounds
t= Time
Principal amount= Actual payment- down payment
= 290000– 35000
⊘ This is a preview!⊘
Do you want full access?
Subscribe today to unlock all pages.
Trusted by 1+ million students worldwide
1 out of 14
Related Documents


![HA1011 Applied Quantitative Methods Assignment Solution - [Date]](/_next/image/?url=https%3A%2F%2Fdesklib.com%2Fmedia%2Fimages%2Fqz%2Fdfe58fc0a1774dbb8e3fa05e31ee0273.jpg&w=256&q=75)


Your All-in-One AI-Powered Toolkit for Academic Success.
+13062052269
info@desklib.com
Available 24*7 on WhatsApp / Email
![[object Object]](/_next/static/media/star-bottom.7253800d.svg)
Unlock your academic potential
Copyright © 2020–2025 A2Z Services. All Rights Reserved. Developed and managed by ZUCOL.