Statistical Methods II Assignment: Confidence Intervals & Hypothesis

Verified

Added on  2023/02/01

|11
|1338
|88
Homework Assignment
AI Summary
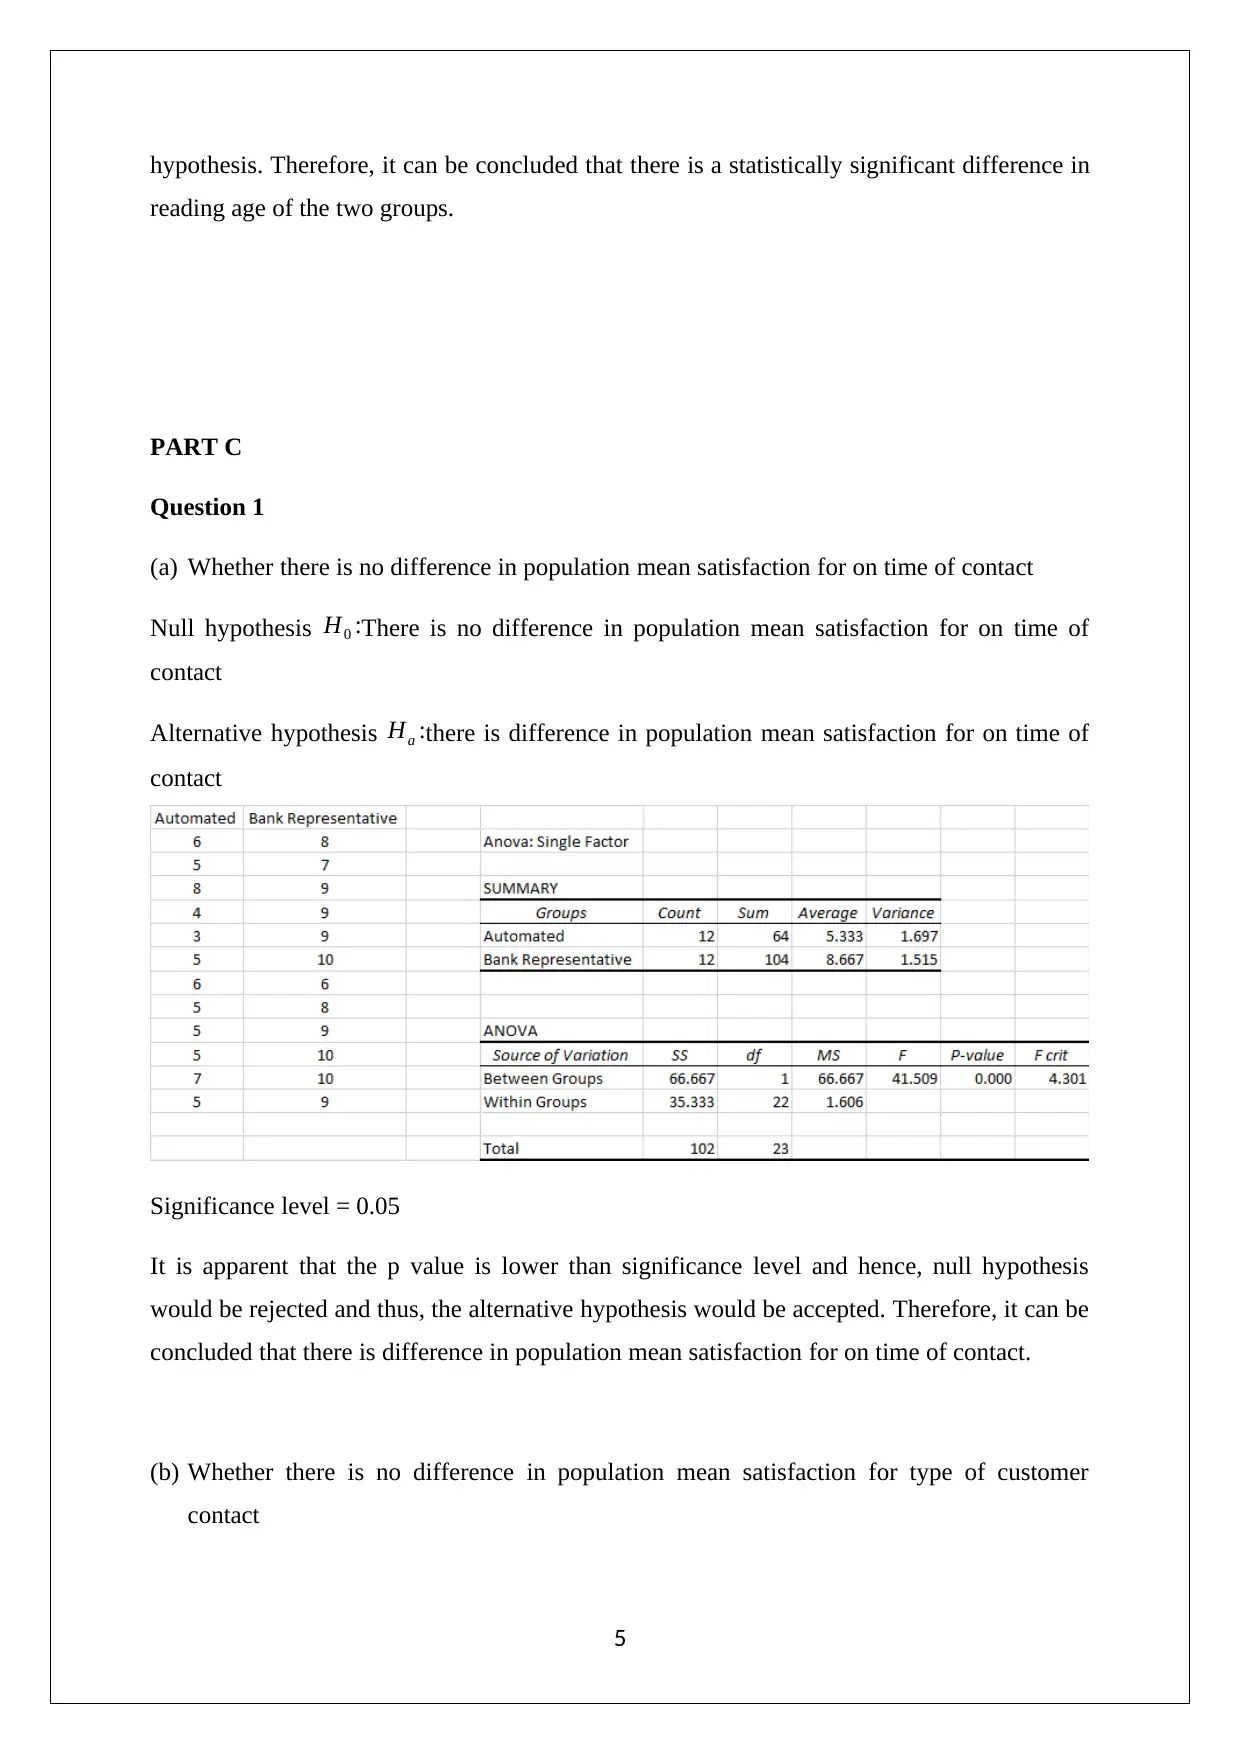
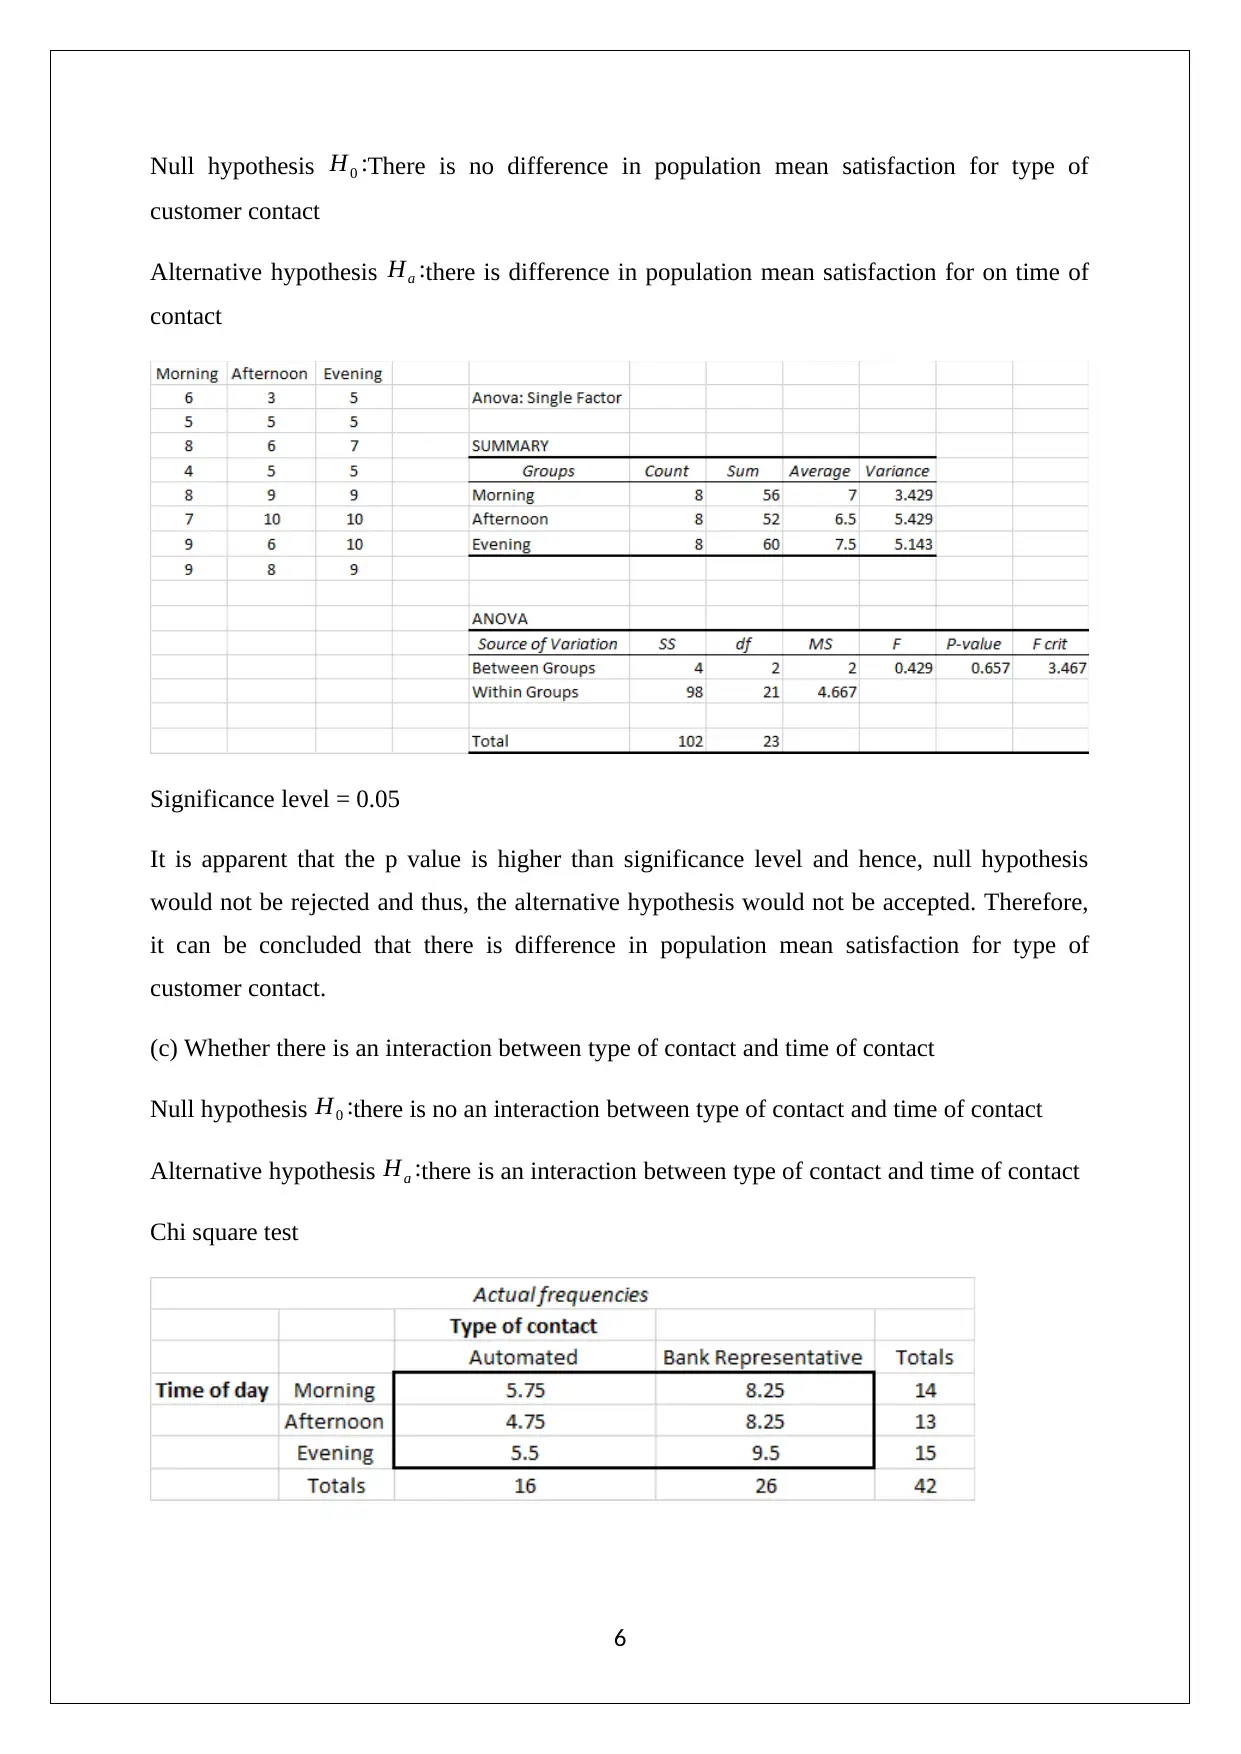
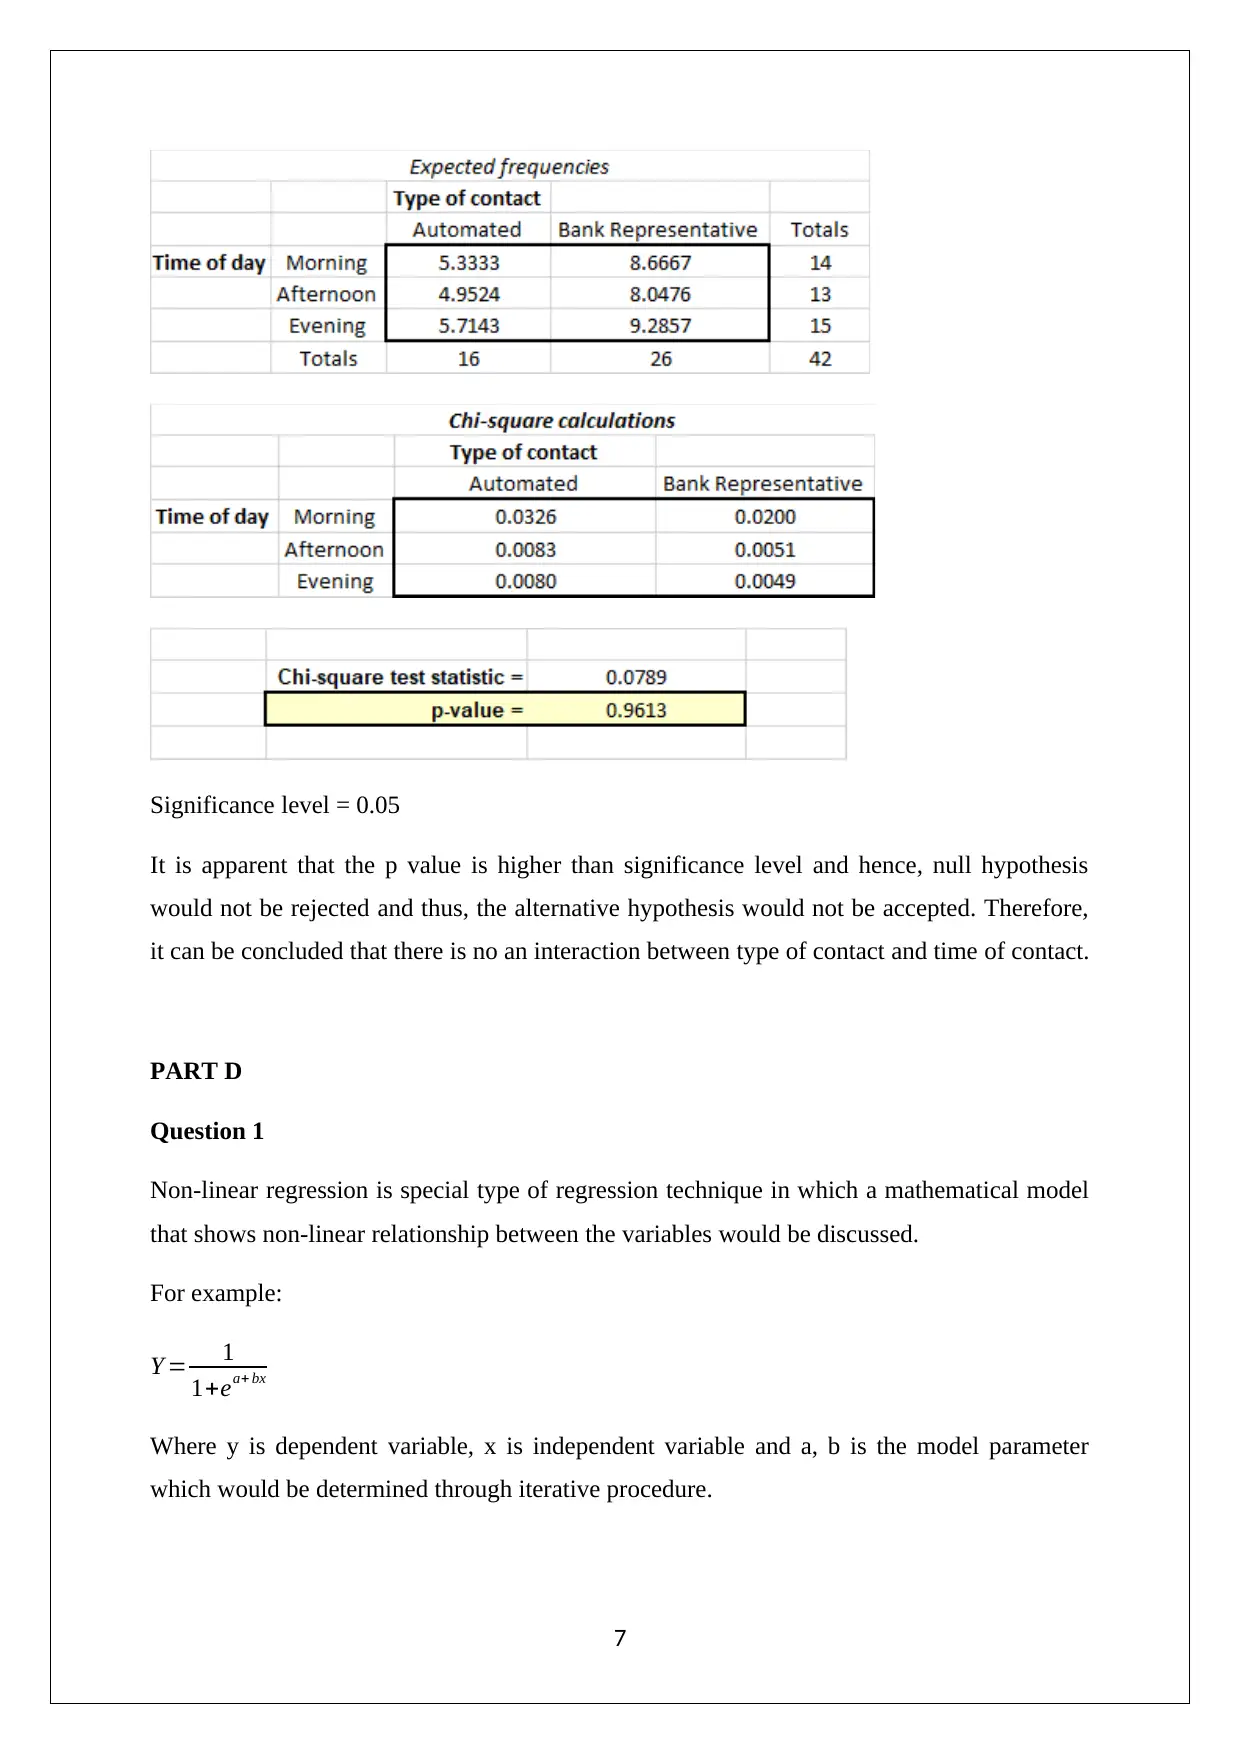
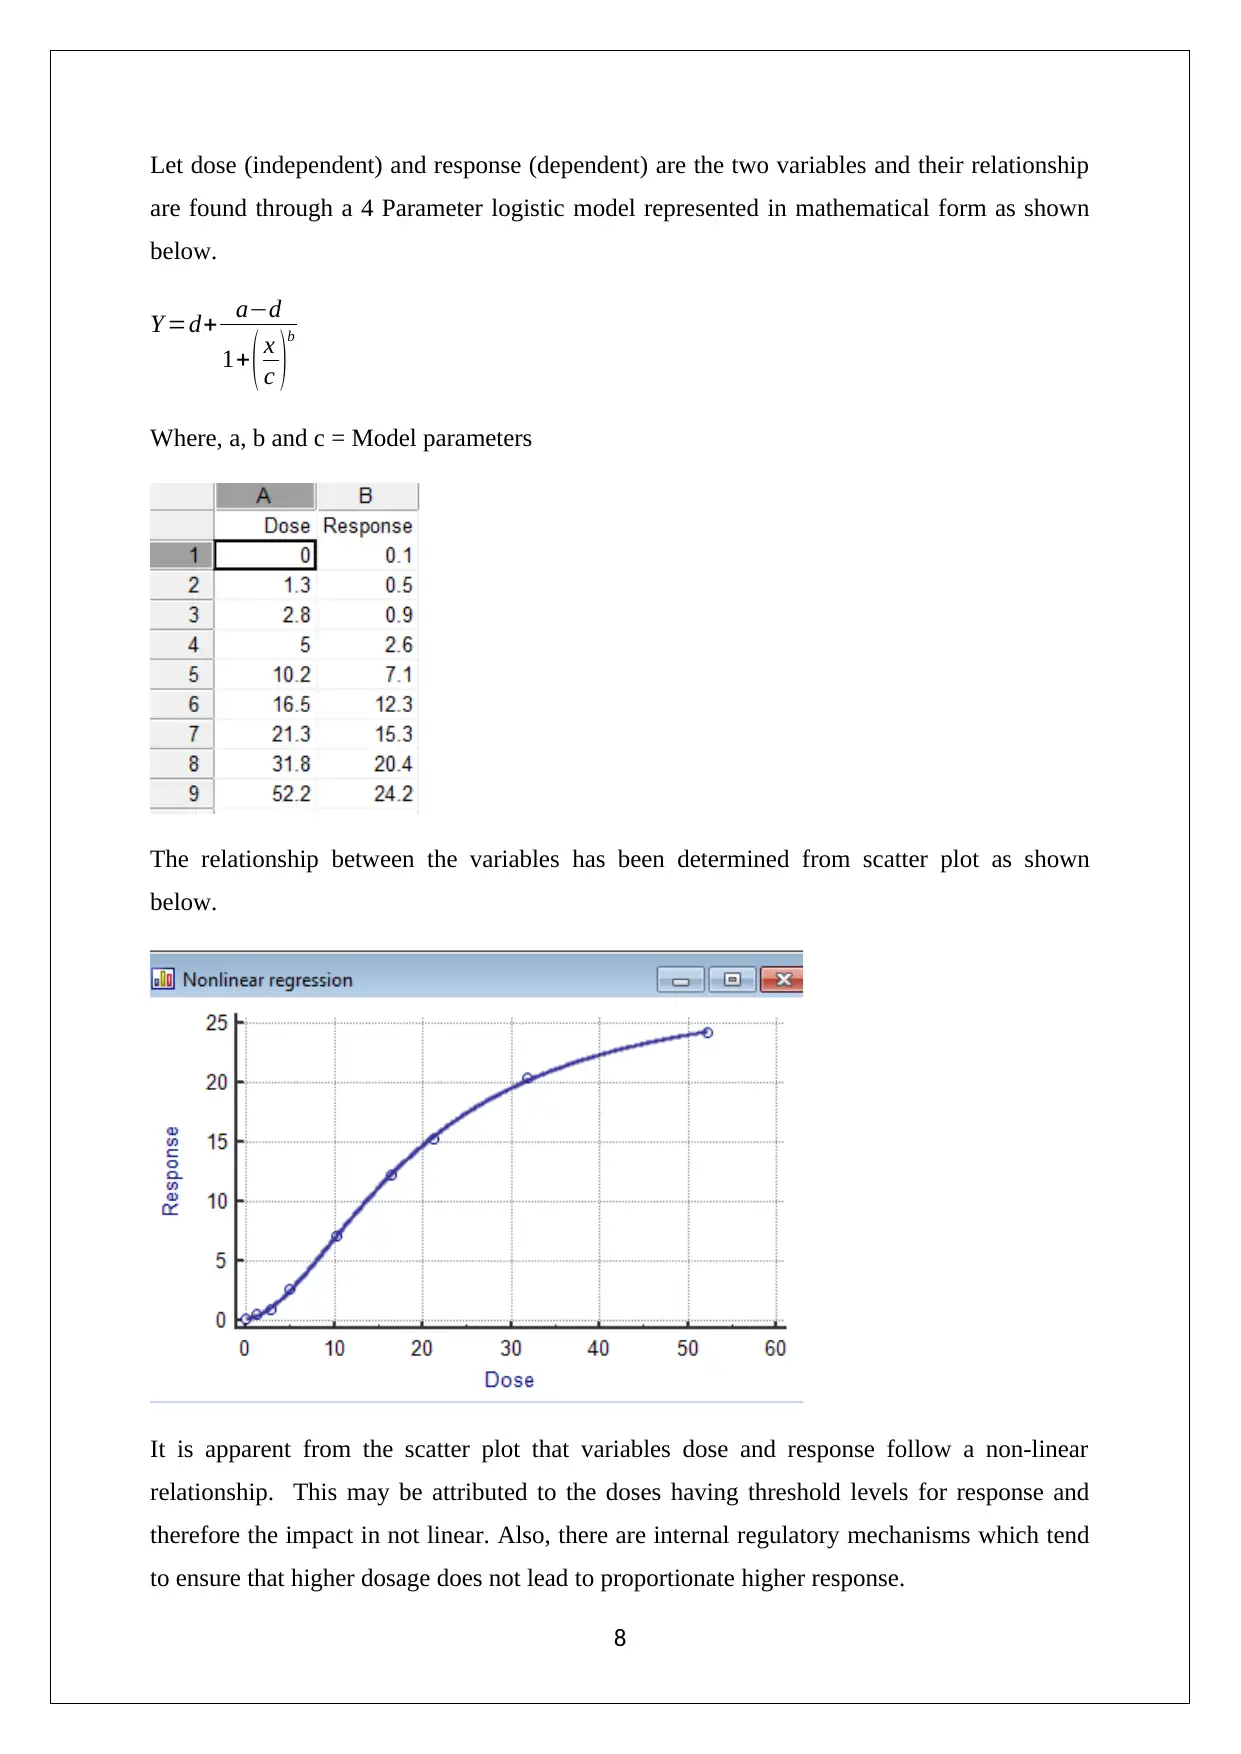
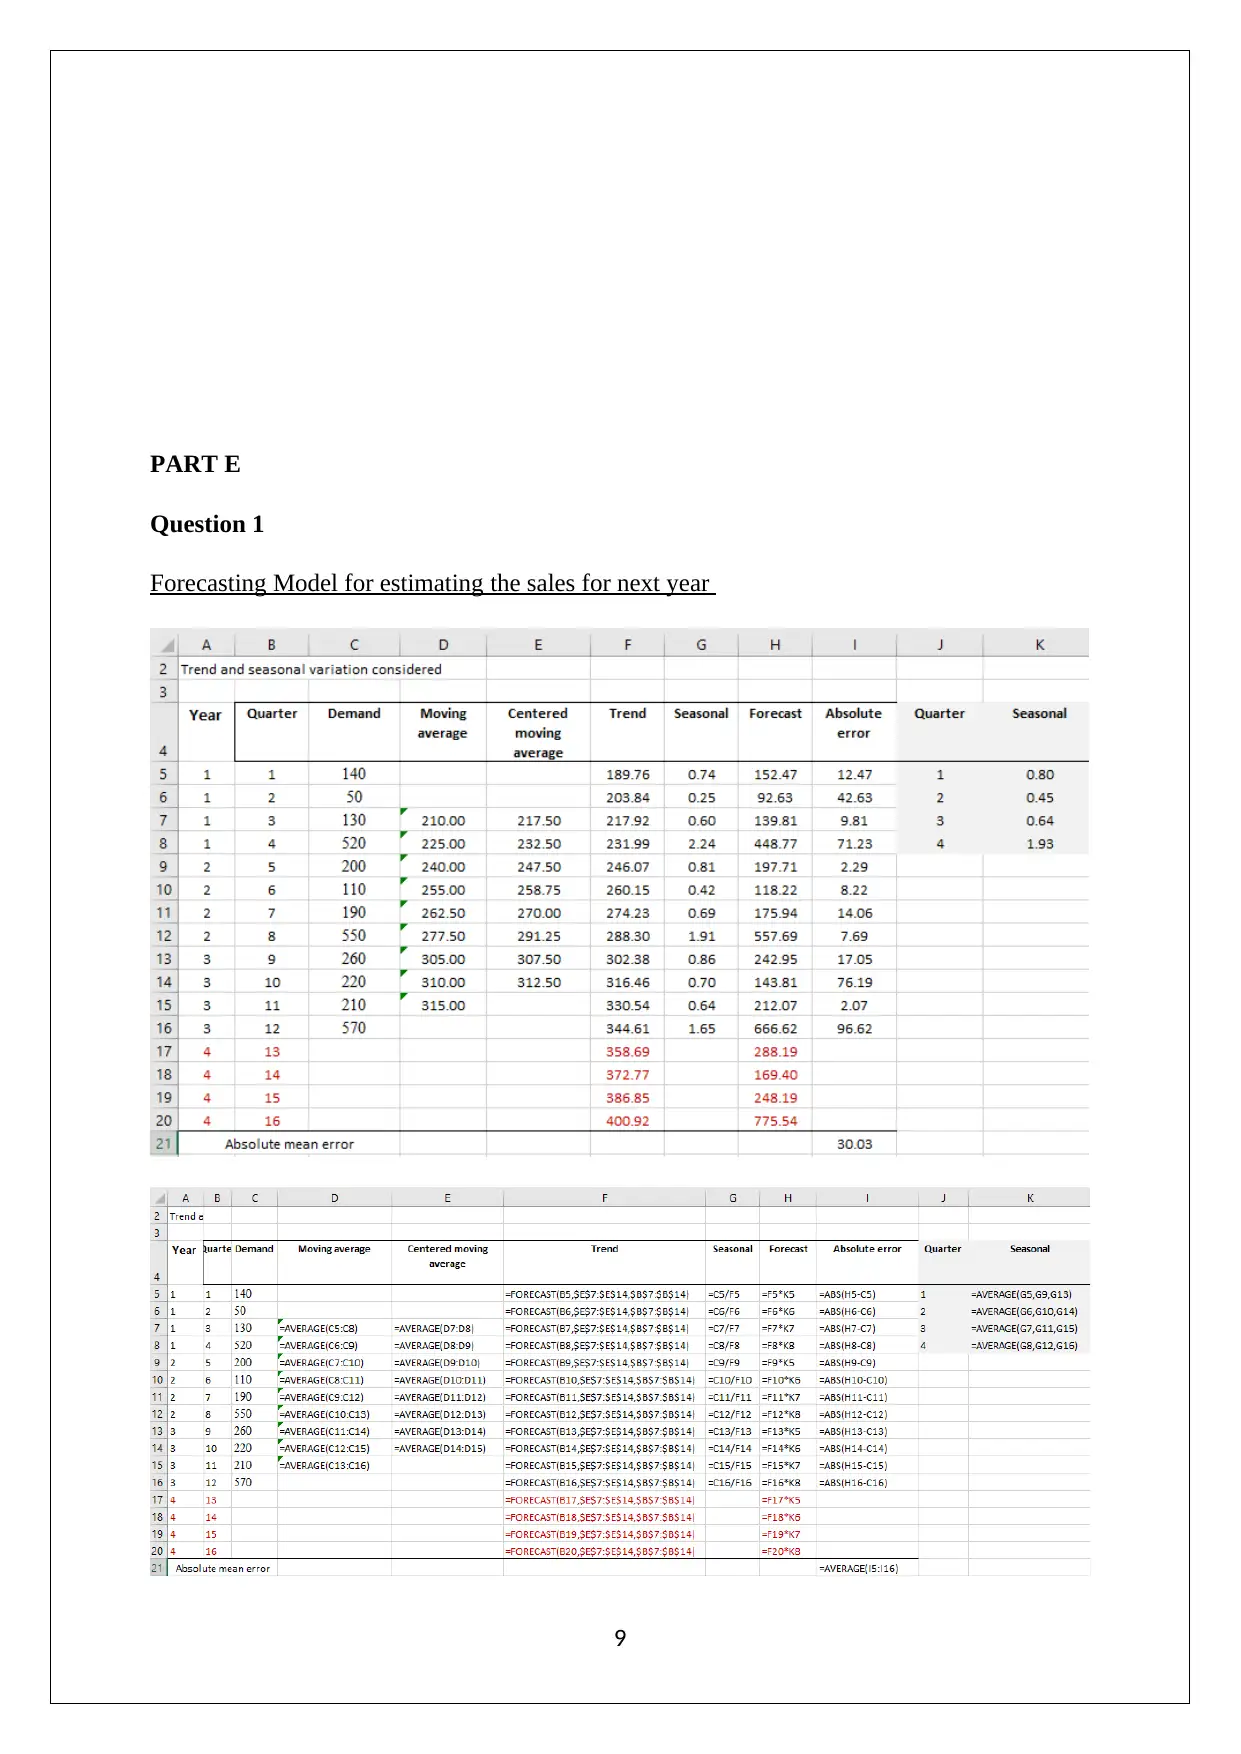
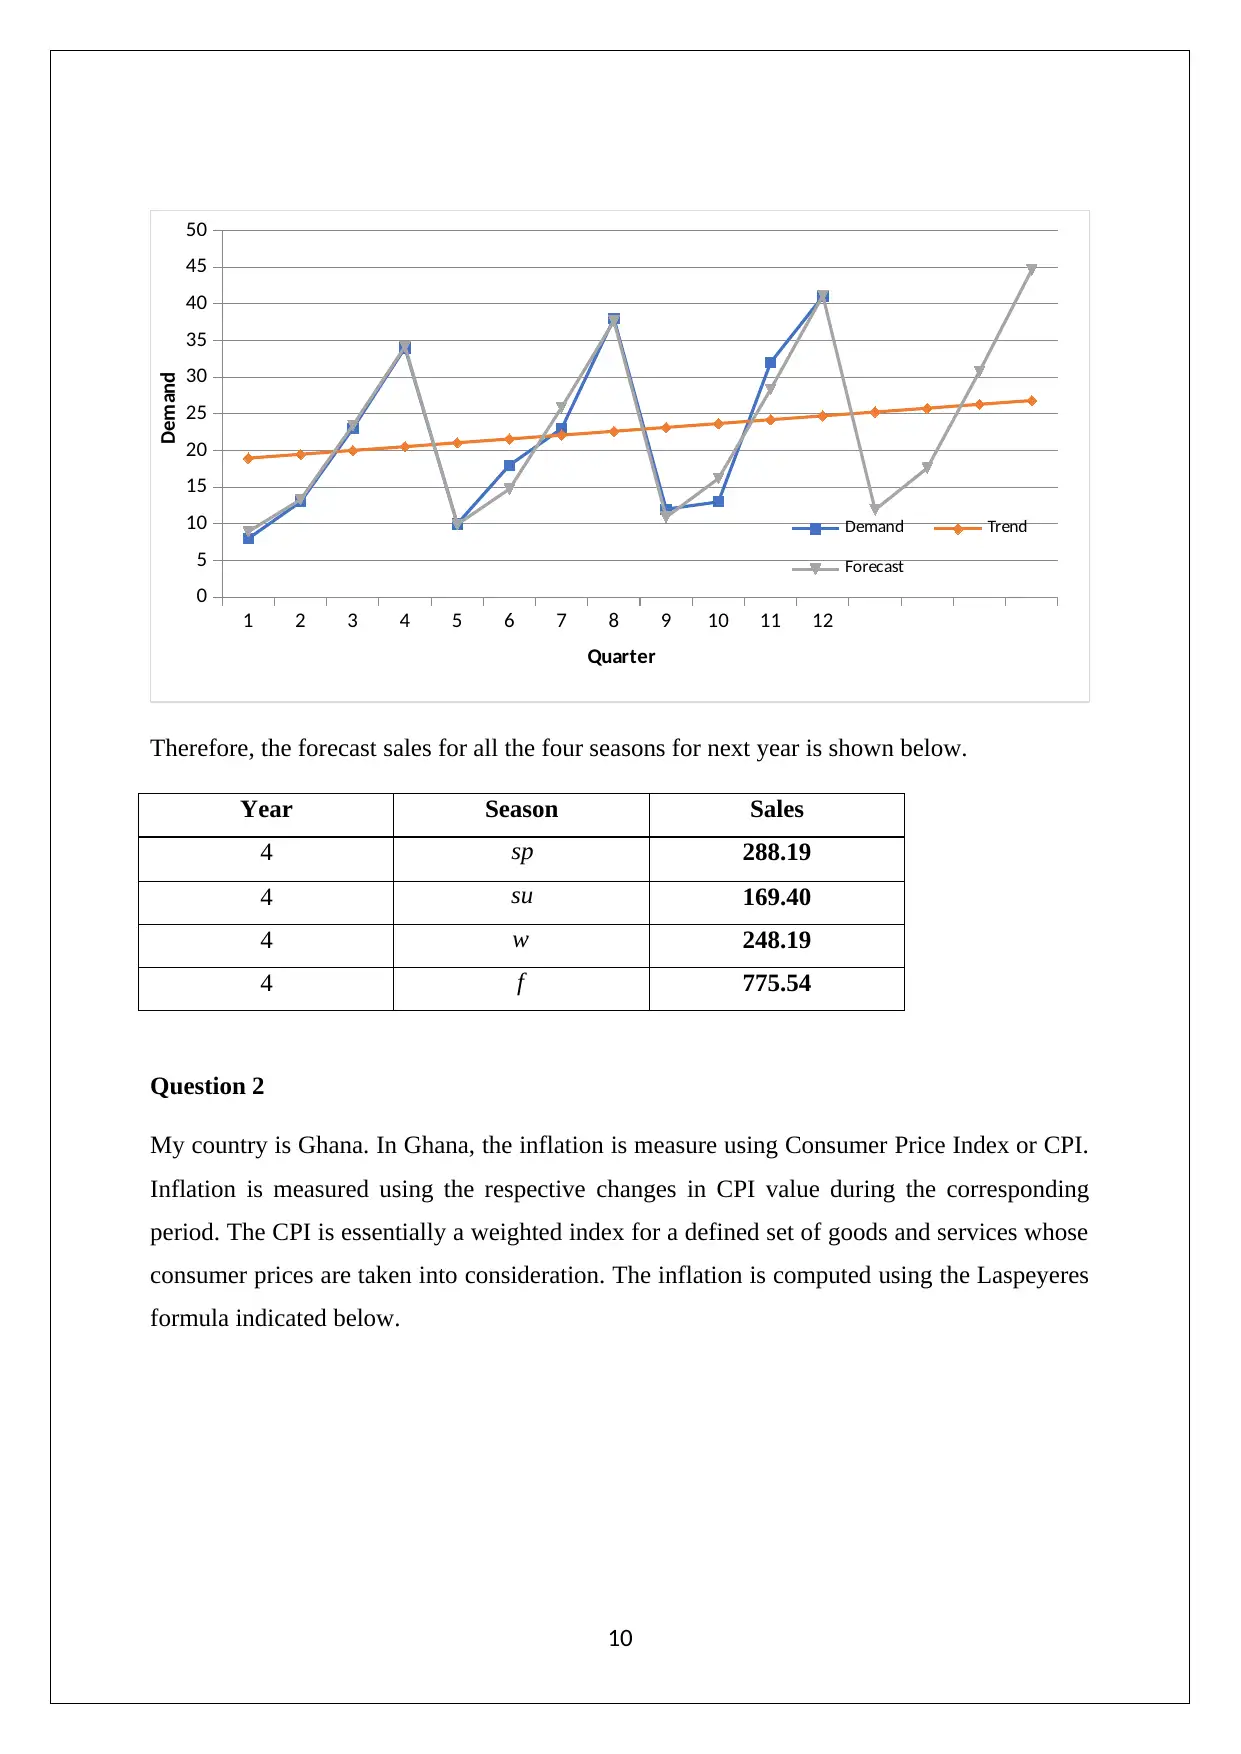
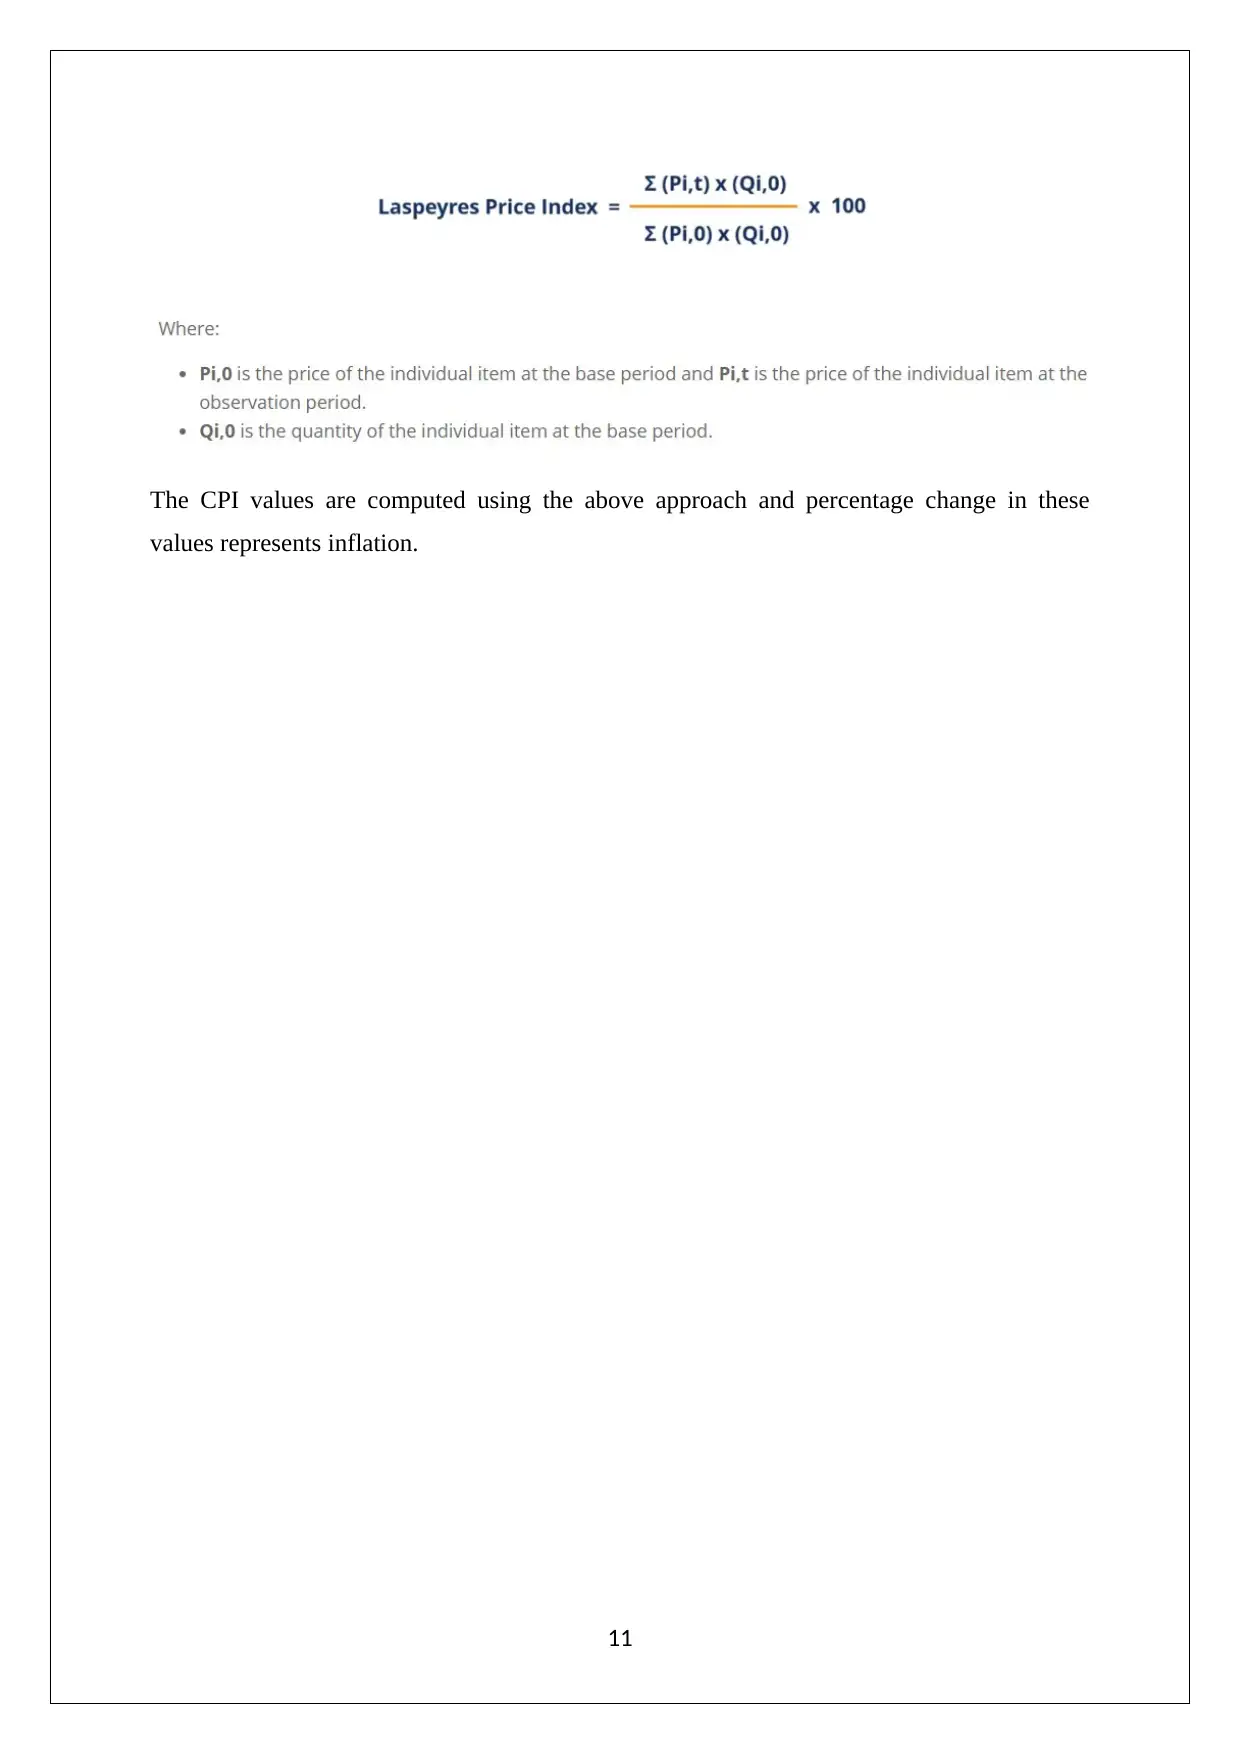
This document presents a comprehensive solution to a Statistical Methods II assignment, covering topics such as confidence intervals, hypothesis testing, and non-linear regression. Part A focuses on constructing a 99% confidence interval for the number of calories in French fries and conducting a hypothesis test to determine if a female patient's red blood cell count is lower than normal. Part B examines whether there is a statistically significant difference in the reading age of two groups using a t-test. Part C involves analyzing population mean satisfaction based on contact time and type using ANOVA and Chi-square tests. Part D explains non-linear regression with an example of dose-response relationship, and Part E includes forecasting sales for the next year and a brief overview of how inflation is measured in Ghana using the Consumer Price Index (CPI). Desklib is a platform where students can find more solved assignments and past papers.
tabler-icon-diamond-filled.svg

Contribute Materials

Your contribution can guide someone’s learning journey. Share your documents today.
Document Page
MATHS
STUDENT ID:
[Pick the date]
tabler-icon-diamond-filled.svg

Secure Best Marks with AI Grader

Need help grading? Try our AI Grader for instant feedback on your assignments.
Document Page
PART A
Question 1
99% confidence interval
Samples size = 8
Mean of sample = 244.5
Standard deviation of sample = 21.7
Here, population standard deviation is not given and also, the sample size is lower than 30
and hence, as per the central limit theorem the t test would be taken into account.
Degree of freedom = Sample size – 1 = 8 -1 = 7
The t stat for 99% confidence interval and 7 degree of freedom = 3.4995
Standard error = Standard deviation
¿ ¿
Margin of error = t value * standard error = 3.4995 * 7.6721 = 26.848
Now,
Lower limit of 99% confidence interval = Mean - Margin of error = 244.5 – 26.848 = 217.65
Upper limit of 99% confidence interval = Mean + Margin of error =244.5 +26.848 = 271.35
99% confidence interval = [ 217.65 271.35]
It can be said with 99% confidence that the sample mean i.e. number of calories in 3 ounces
of French fries would fall within the range of 217.65 and 271.35.
Question 2
Claim: Female adults blood cell count is lower than normal i.e. 4.8.
Step 1: Null and alternative hypotheses
Null hypothesis H0 : μ 4.8
Alternative hypothesis Ha : μ<4.8
2
Document Page
Step 2: Test statistic
Samples size = 6
Mean of sample = 4.4
Standard deviation of sample = 0.28
Here, population standard deviation is not given and also, the sample size is lower than 30
and hence, as per the central limit theorem the t test would be taken into account.
t= Meanhypothesized mean
Standard deviation
sample ¿ ¿= 4.44.8
0.28
6
=3.4993 ¿
¿
Step 3: The p value
It is a left tailed hypothesis.
Degree of freedom = Sample size – 1 = 6 -1 = 5
The p value corresponding to degree of freedom and t stat = 0.0086
Step 4: Significance level
Significance level (alpha) = 0.05
Step 5: Conclusion
It is apparent that the p value is lower than significance level and therefore, sufficient
evidence is present to reject the null hypothesis and to accept the alternative hypothesis.
Therefore, it can be concluded that the red blood cell count of the patient is lower than
normal i.e. 4.8.
PART B
Question 1
3
Document Page
Claim: Whether there is a statistically significant difference in reading age of the two groups.
Step 1: Null and alternative hypotheses
Null hypothesis H0 : μD=0
Alternative hypothesis Ha : μD 0
Step 2: Test statistic
Samples size = 6
Difference in sample mean = -2.33 months
Difference in sample standard deviation = 2.16 months
Here, population standard deviation is not given and also, the sample size is lower than 30
and hence, as per the central limit theorem the t test would be taken into account.
t= Differencesample mean
Differencesample standard deviation
sample ¿ ¿=2.33
2.16
6
=2.64 ¿
¿
Step 3: The p value
It is a two tailed hypothesis test.
Degree of freedom = Sample size – 1 = 6 -1 = 5
The p value corresponding to degree of freedom and t stat = 0.046
Step 4: Significance level
Significance level (alpha) = 0.05
Step 5: Conclusion
It is apparent that the p value (0.046) is lower than significance level (0.05) and therefore,
sufficient evidence is present to reject the null hypothesis and to accept the alternative
4
tabler-icon-diamond-filled.svg

Secure Best Marks with AI Grader

Need help grading? Try our AI Grader for instant feedback on your assignments.
Document Page
hypothesis. Therefore, it can be concluded that there is a statistically significant difference in
reading age of the two groups.
PART C
Question 1
(a) Whether there is no difference in population mean satisfaction for on time of contact
Null hypothesis H0 :There is no difference in population mean satisfaction for on time of
contact
Alternative hypothesis Ha :there is difference in population mean satisfaction for on time of
contact
Significance level = 0.05
It is apparent that the p value is lower than significance level and hence, null hypothesis
would be rejected and thus, the alternative hypothesis would be accepted. Therefore, it can be
concluded that there is difference in population mean satisfaction for on time of contact.
(b) Whether there is no difference in population mean satisfaction for type of customer
contact
5
Document Page
Null hypothesis H0 :There is no difference in population mean satisfaction for type of
customer contact
Alternative hypothesis Ha :there is difference in population mean satisfaction for on time of
contact
Significance level = 0.05
It is apparent that the p value is higher than significance level and hence, null hypothesis
would not be rejected and thus, the alternative hypothesis would not be accepted. Therefore,
it can be concluded that there is difference in population mean satisfaction for type of
customer contact.
(c) Whether there is an interaction between type of contact and time of contact
Null hypothesis H0 :there is no an interaction between type of contact and time of contact
Alternative hypothesis Ha :there is an interaction between type of contact and time of contact
Chi square test
6
Document Page
Significance level = 0.05
It is apparent that the p value is higher than significance level and hence, null hypothesis
would not be rejected and thus, the alternative hypothesis would not be accepted. Therefore,
it can be concluded that there is no an interaction between type of contact and time of contact.
PART D
Question 1
Non-linear regression is special type of regression technique in which a mathematical model
that shows non-linear relationship between the variables would be discussed.
For example:
Y = 1
1+ea+ bx
Where y is dependent variable, x is independent variable and a, b is the model parameter
which would be determined through iterative procedure.
7
tabler-icon-diamond-filled.svg

Paraphrase This Document

Need a fresh take? Get an instant paraphrase of this document with our AI Paraphraser
Document Page
Let dose (independent) and response (dependent) are the two variables and their relationship
are found through a 4 Parameter logistic model represented in mathematical form as shown
below.
Y =d+ ad
1+ ( x
c )b
Where, a, b and c = Model parameters
The relationship between the variables has been determined from scatter plot as shown
below.
It is apparent from the scatter plot that variables dose and response follow a non-linear
relationship. This may be attributed to the doses having threshold levels for response and
therefore the impact in not linear. Also, there are internal regulatory mechanisms which tend
to ensure that higher dosage does not lead to proportionate higher response.
8
Document Page
PART E
Question 1
Forecasting Model for estimating the sales for next year
9
Document Page
1 2 3 4 5 6 7 8 9 10 11 12
0
5
10
15
20
25
30
35
40
45
50
Demand Trend
Forecast
Quarter
Demand
Therefore, the forecast sales for all the four seasons for next year is shown below.
Year Season Sales
4 sp 288.19
4 su 169.40
4 w 248.19
4 f 775.54
Question 2
My country is Ghana. In Ghana, the inflation is measure using Consumer Price Index or CPI.
Inflation is measured using the respective changes in CPI value during the corresponding
period. The CPI is essentially a weighted index for a defined set of goods and services whose
consumer prices are taken into consideration. The inflation is computed using the Laspeyeres
formula indicated below.
10
tabler-icon-diamond-filled.svg

Secure Best Marks with AI Grader

Need help grading? Try our AI Grader for instant feedback on your assignments.
Document Page
The CPI values are computed using the above approach and percentage change in these
values represents inflation.
11
chevron_up_icon
1 out of 11
circle_padding
hide_on_mobile
zoom_out_icon
logo.png

Your All-in-One AI-Powered Toolkit for Academic Success.

Available 24*7 on WhatsApp / Email

[object Object]