Statistical Analysis Assignment: Descriptive Stats & Correlation
VerifiedAdded on 2023/04/21
|9
|1067
|338
Homework Assignment
AI Summary
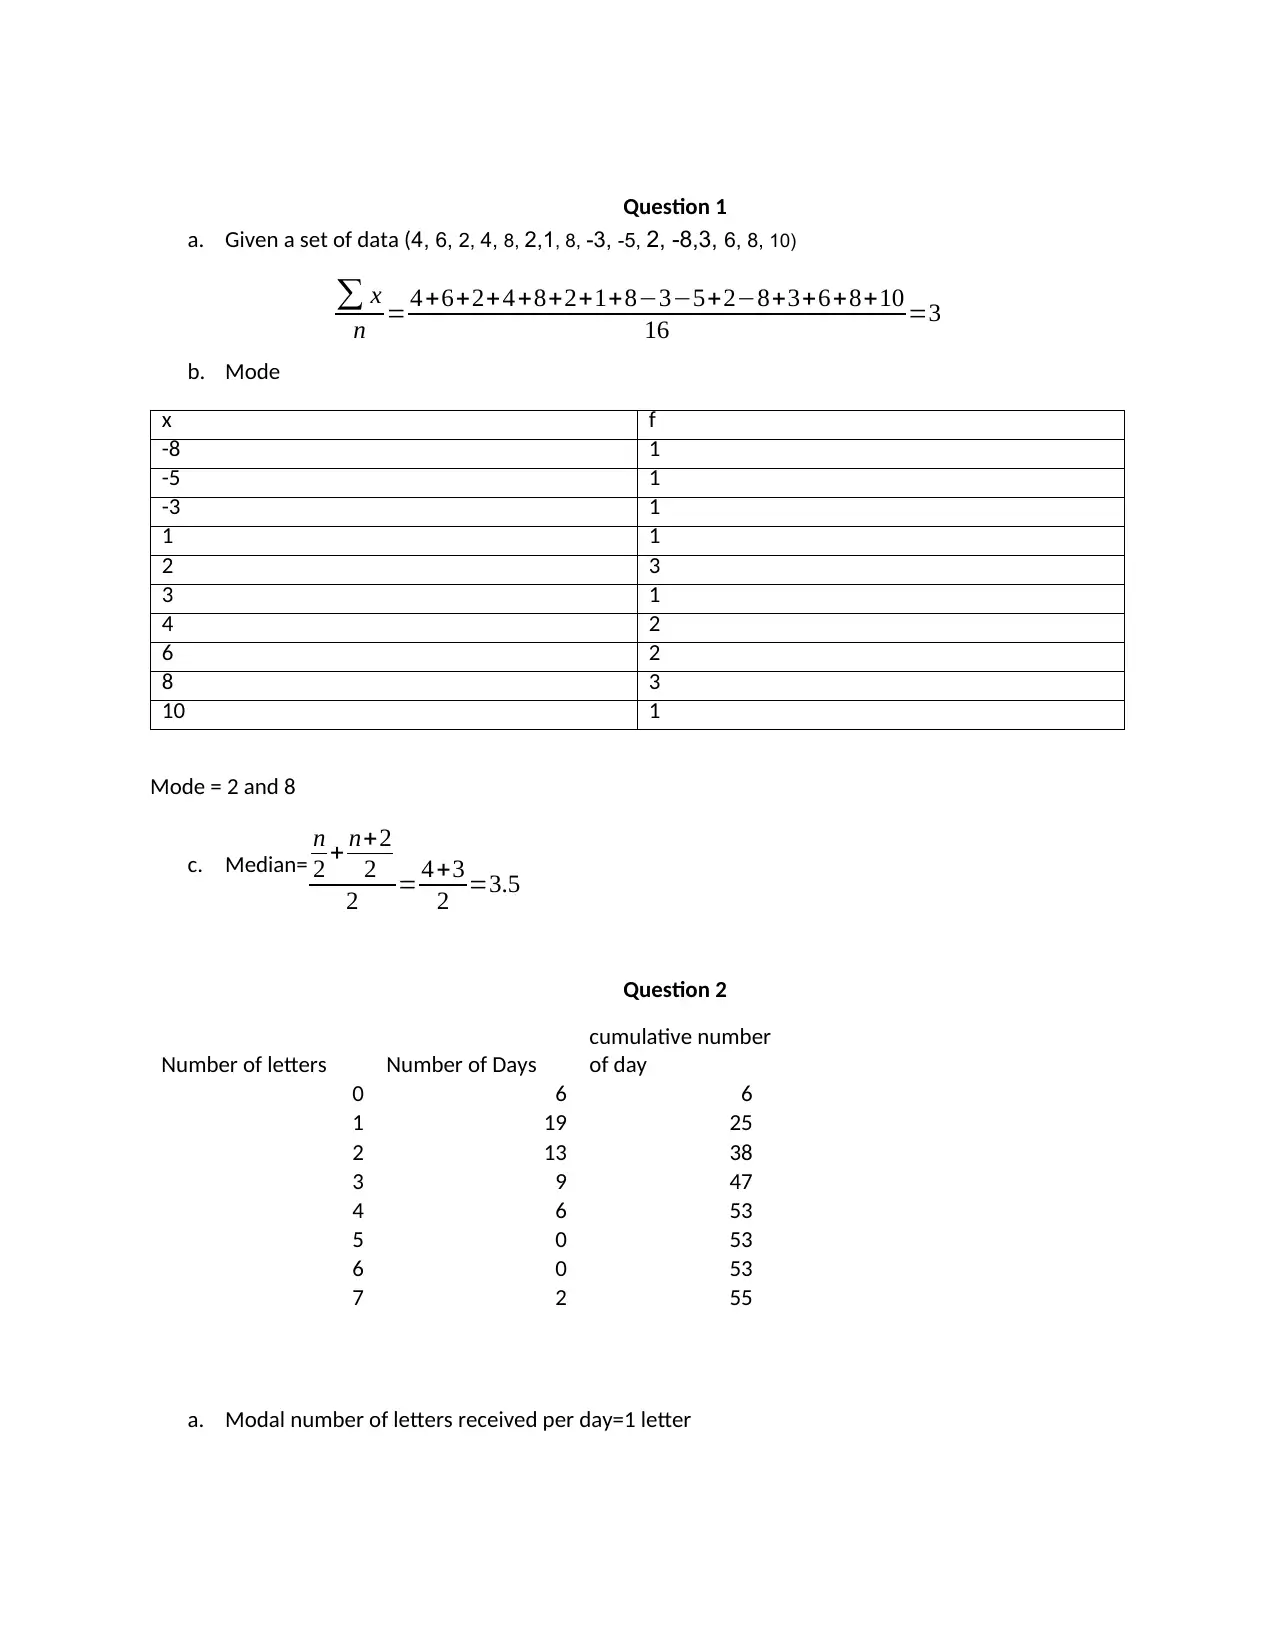
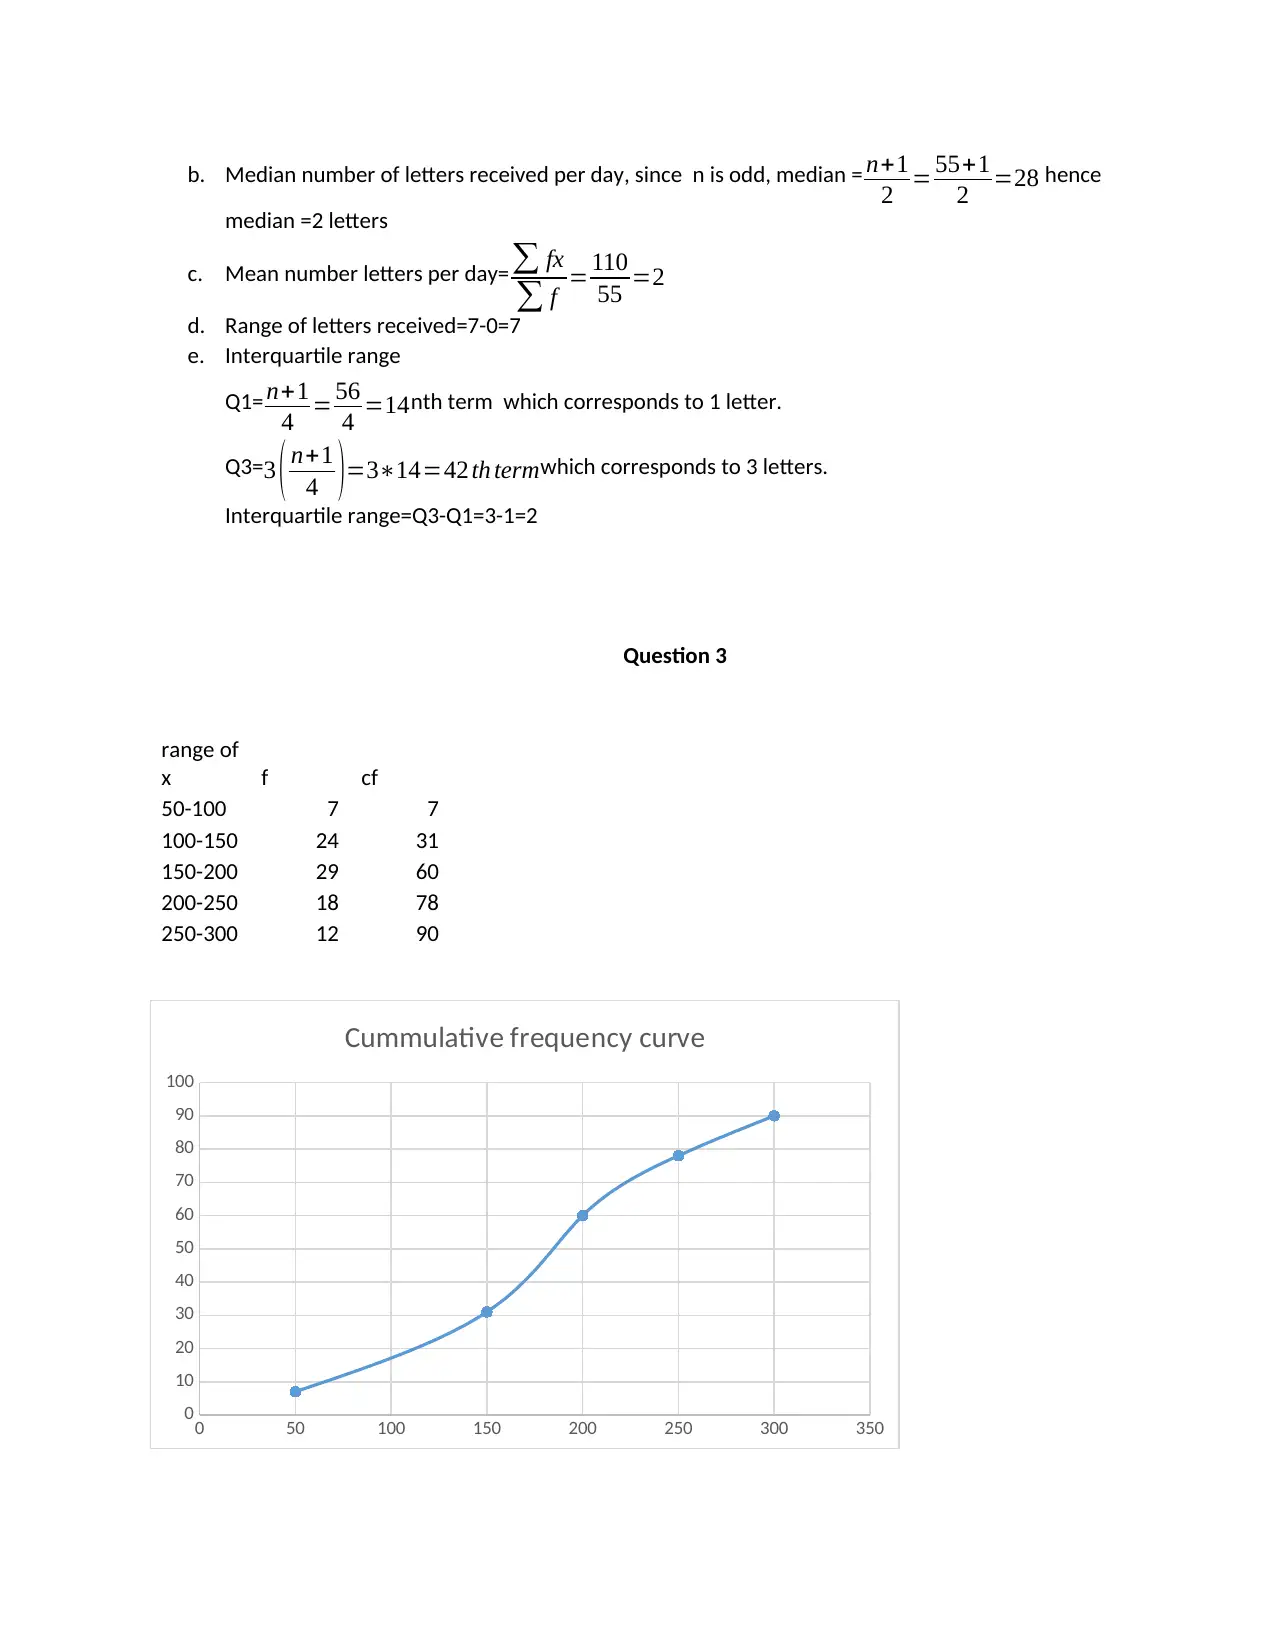
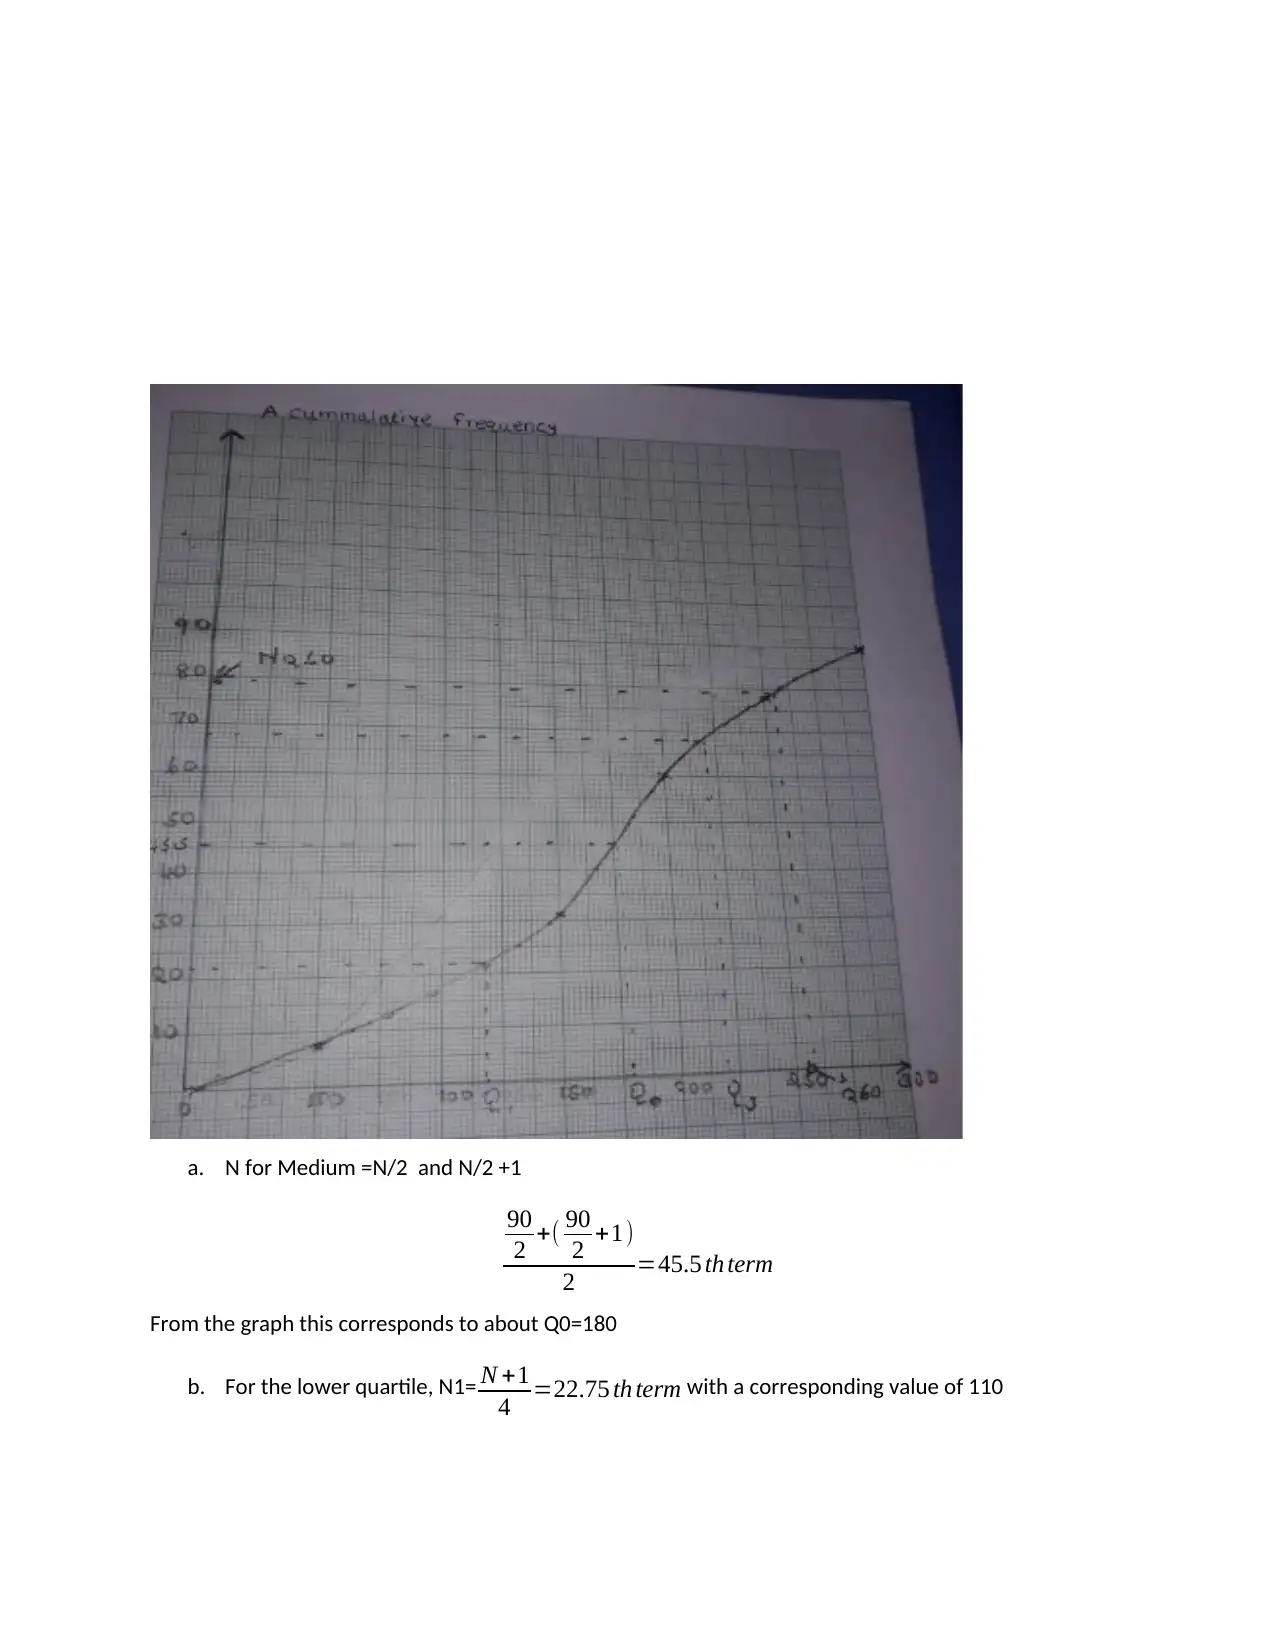
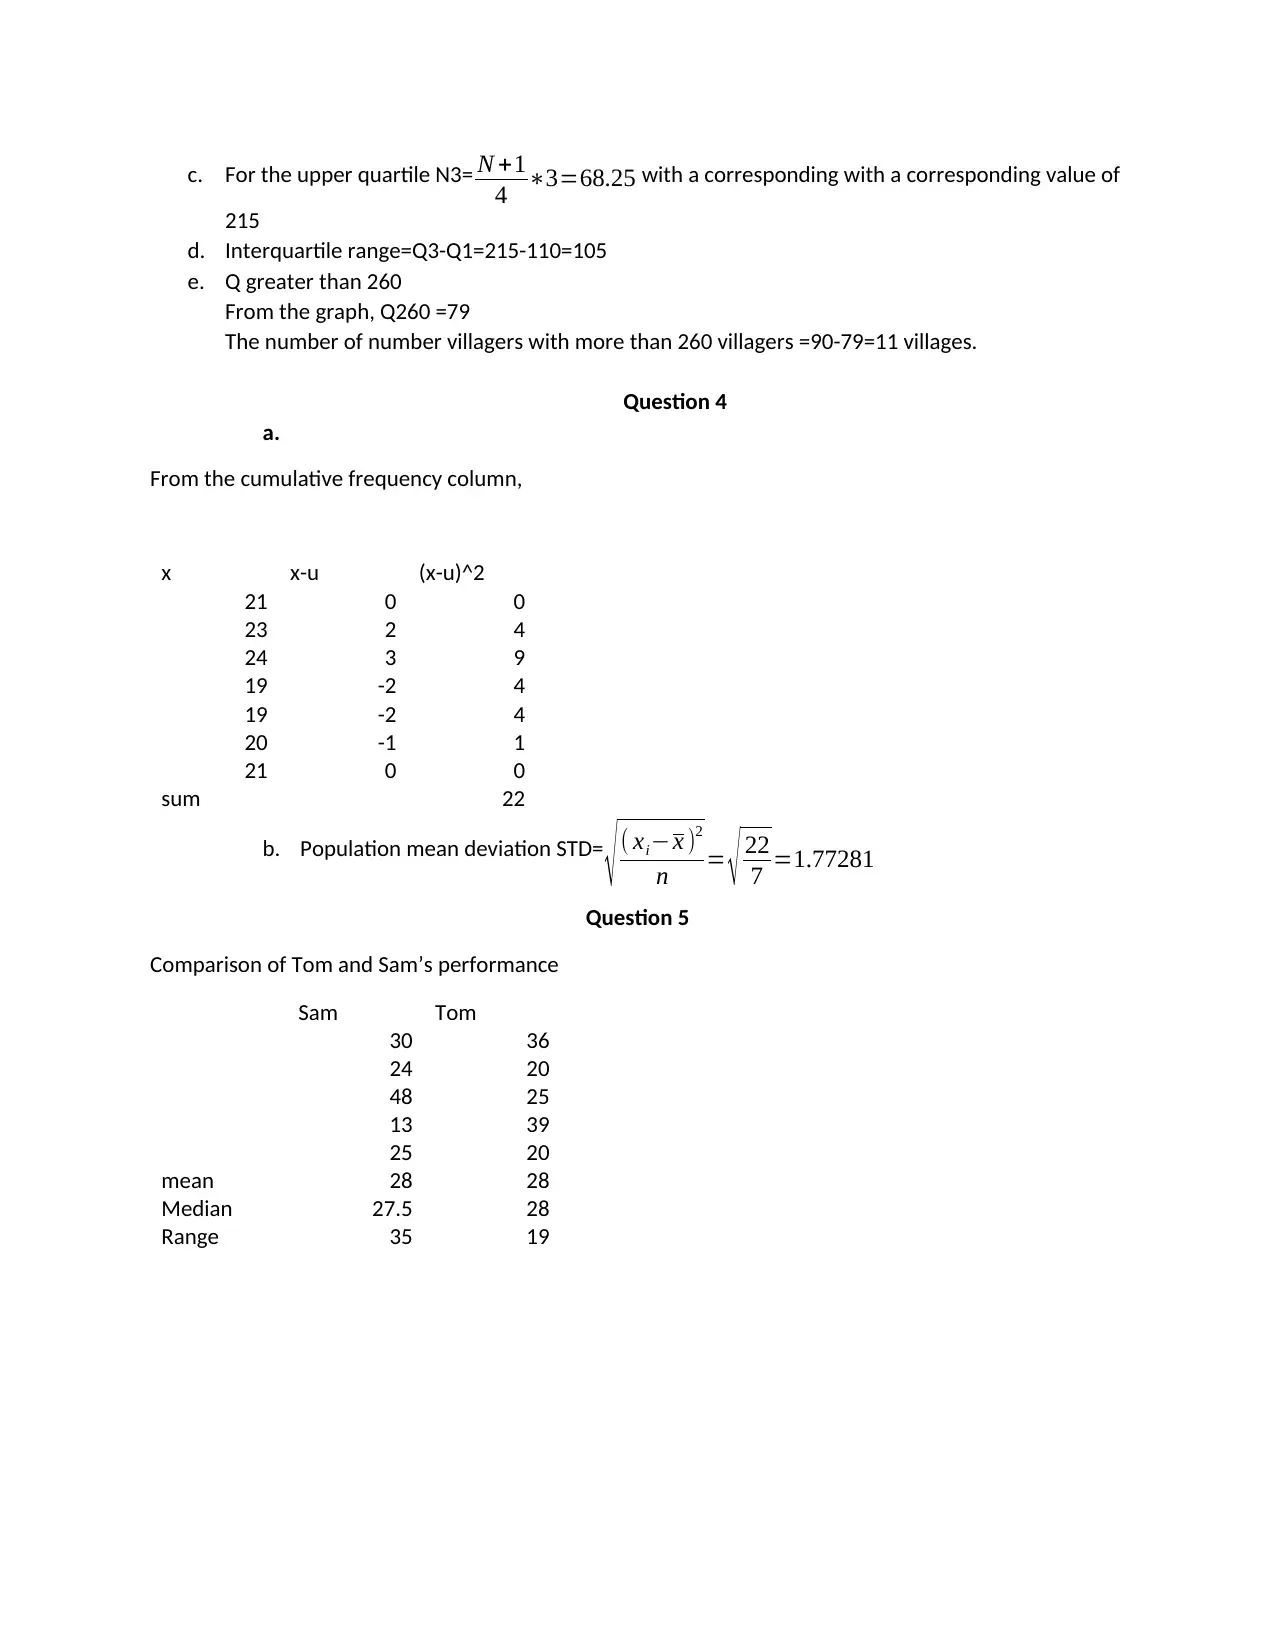
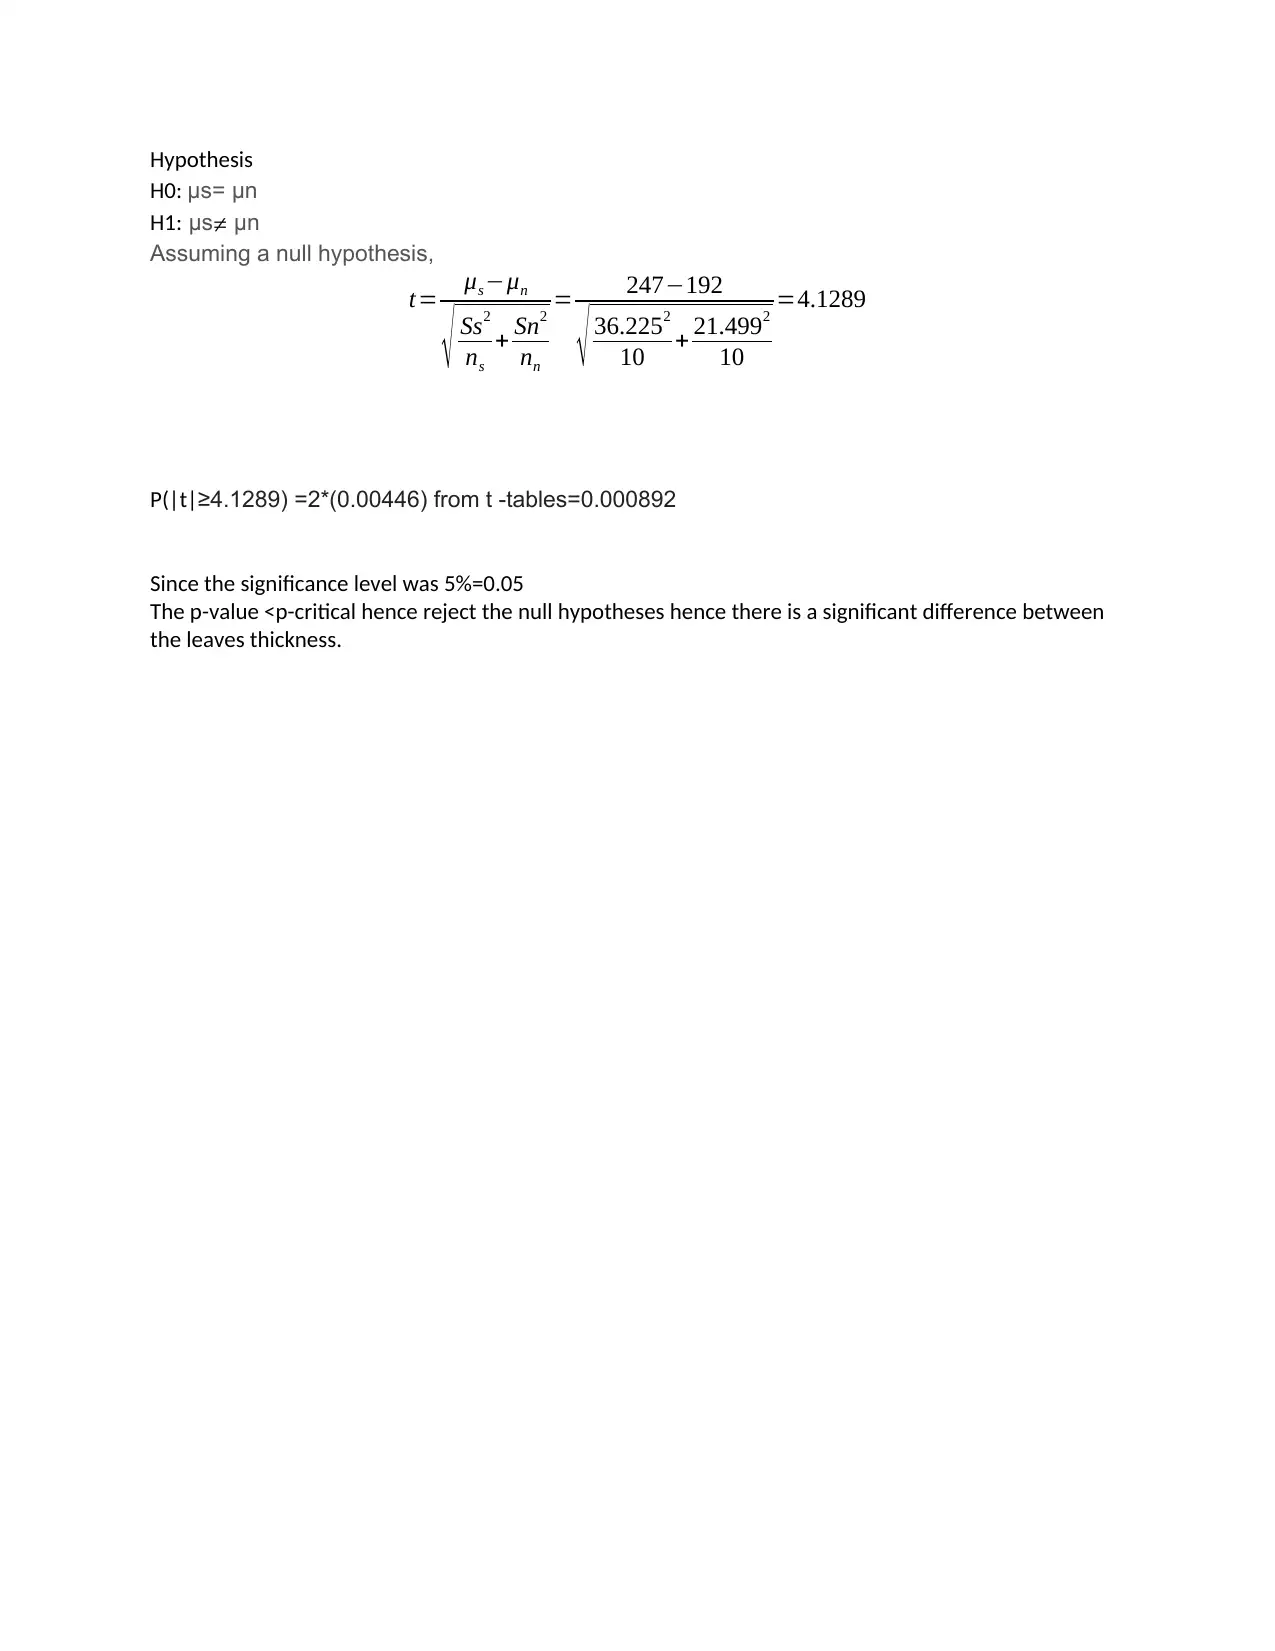
This assignment solution covers a range of statistical concepts and techniques. It includes calculating measures of central tendency (mean, median, mode, and range) for a given dataset, analyzing the number of letters received per day using descriptive statistics, and constructing a cumulative frequency curve to determine quartiles and the number of villages exceeding a certain population threshold. Further, the assignment involves calculating variance, standard deviation, and mean deviation for temperature data. A comparison of two datasets is conducted using mean, median, and range. The impact of a charge on car occupancy is evaluated using mean calculations. Correlation analysis is performed on tyre data, including plotting a scatter diagram, determining the line of best fit, and interpreting the slope and intercept. Spearman's rank correlation coefficient is calculated and interpreted for judge rankings. Finally, a t-test is conducted to determine if there is a significant difference in leaf thickness between north and south-facing walls, and a conclusion is drawn based on the p-value.
1 out of 9
Related Documents


Your All-in-One AI-Powered Toolkit for Academic Success.
+13062052269
info@desklib.com
Available 24*7 on WhatsApp / Email
![[object Object]](/_next/static/media/star-bottom.7253800d.svg)
Copyright © 2020–2026 A2Z Services. All Rights Reserved. Developed and managed by ZUCOL.