Statistics Assignment: Data Analysis, Regression, and Model Evaluation

Verified

Added on  2020/03/16

|13
|1605
|225
Homework Assignment
AI Summary
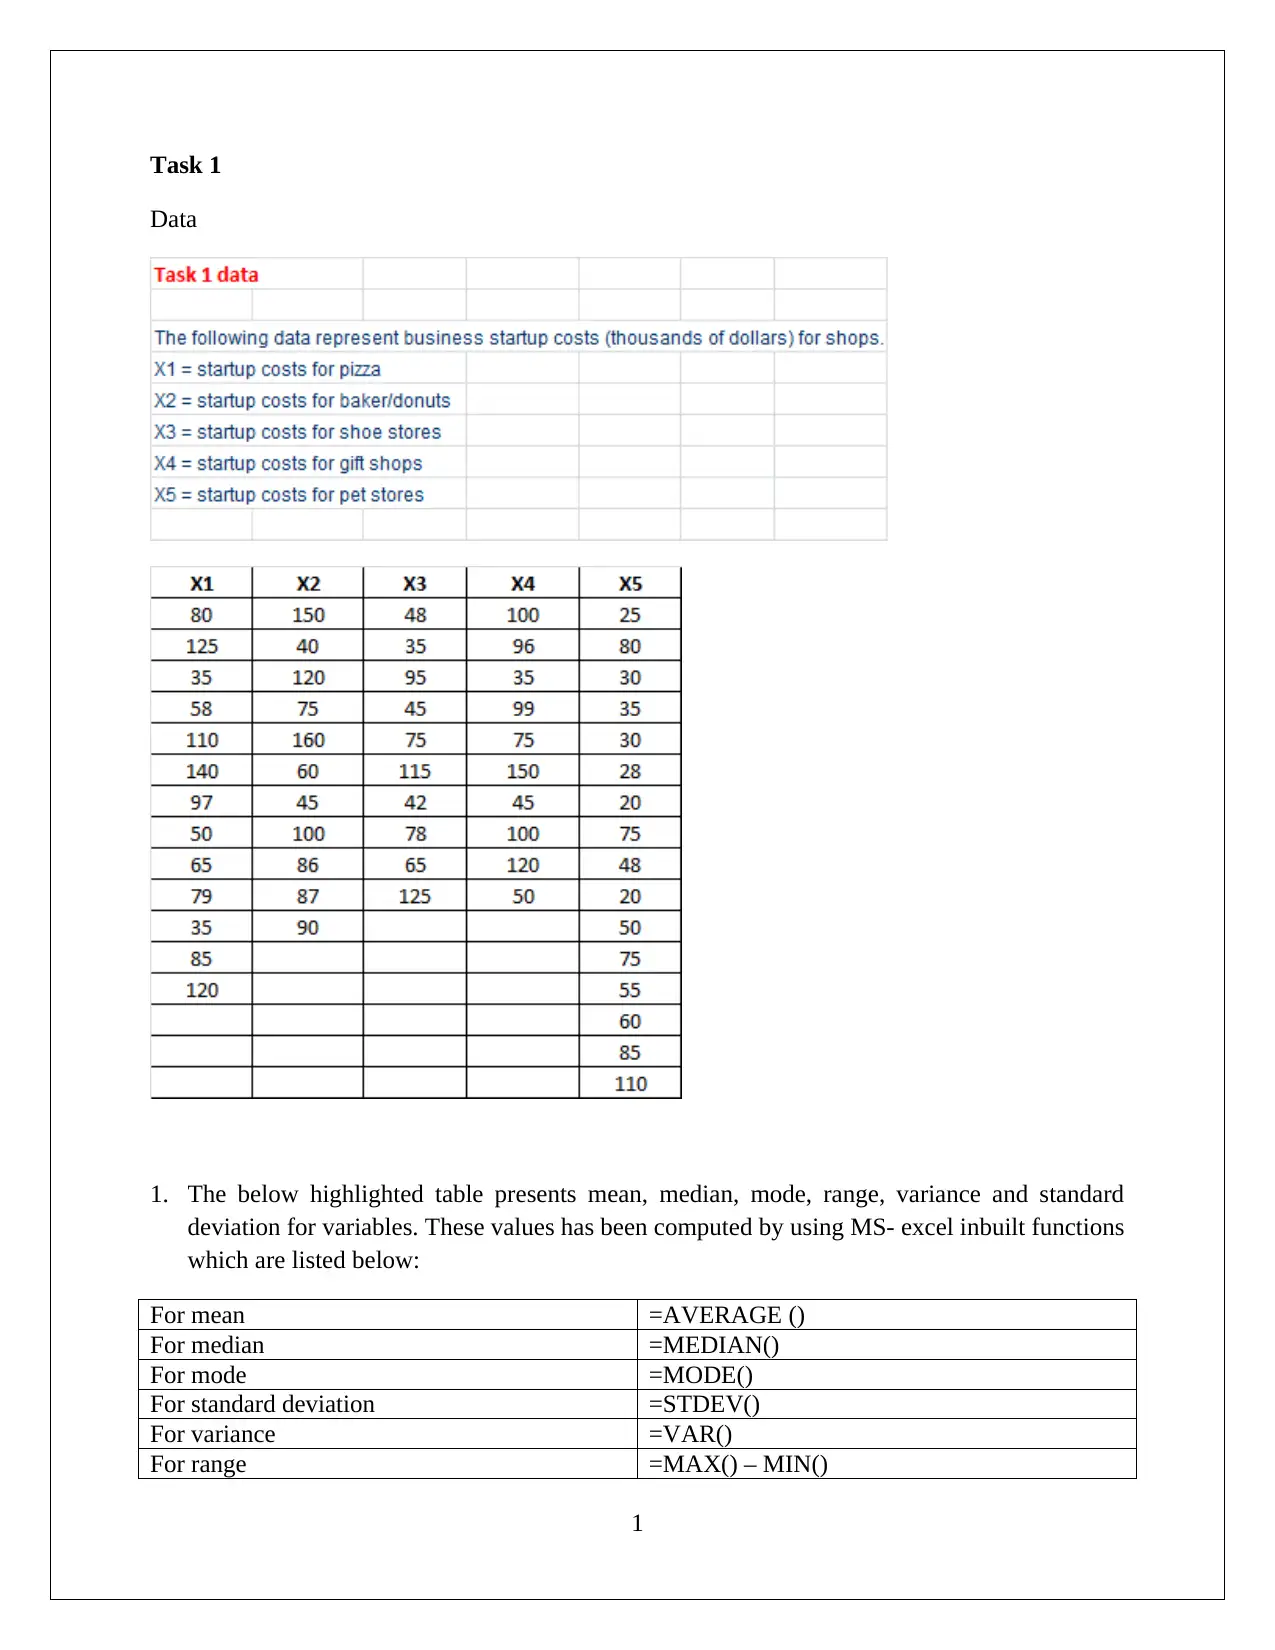
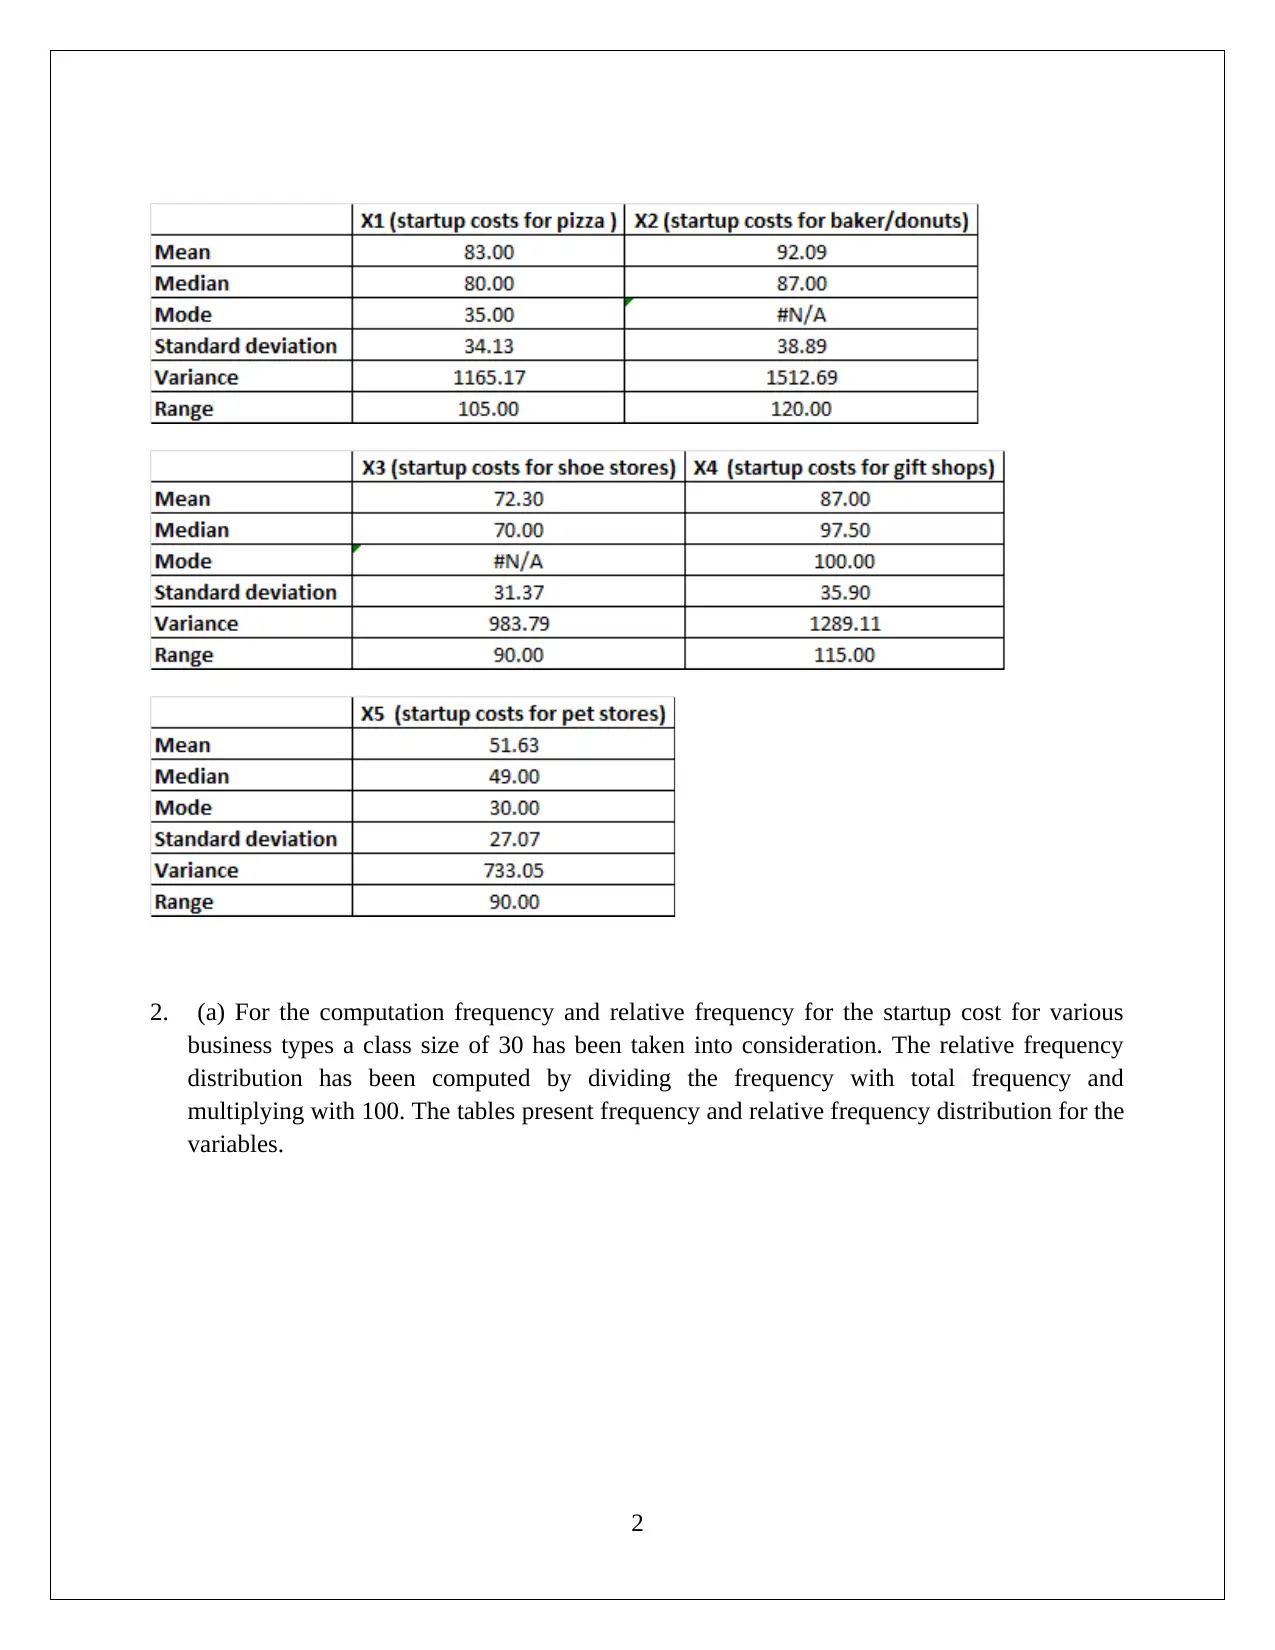
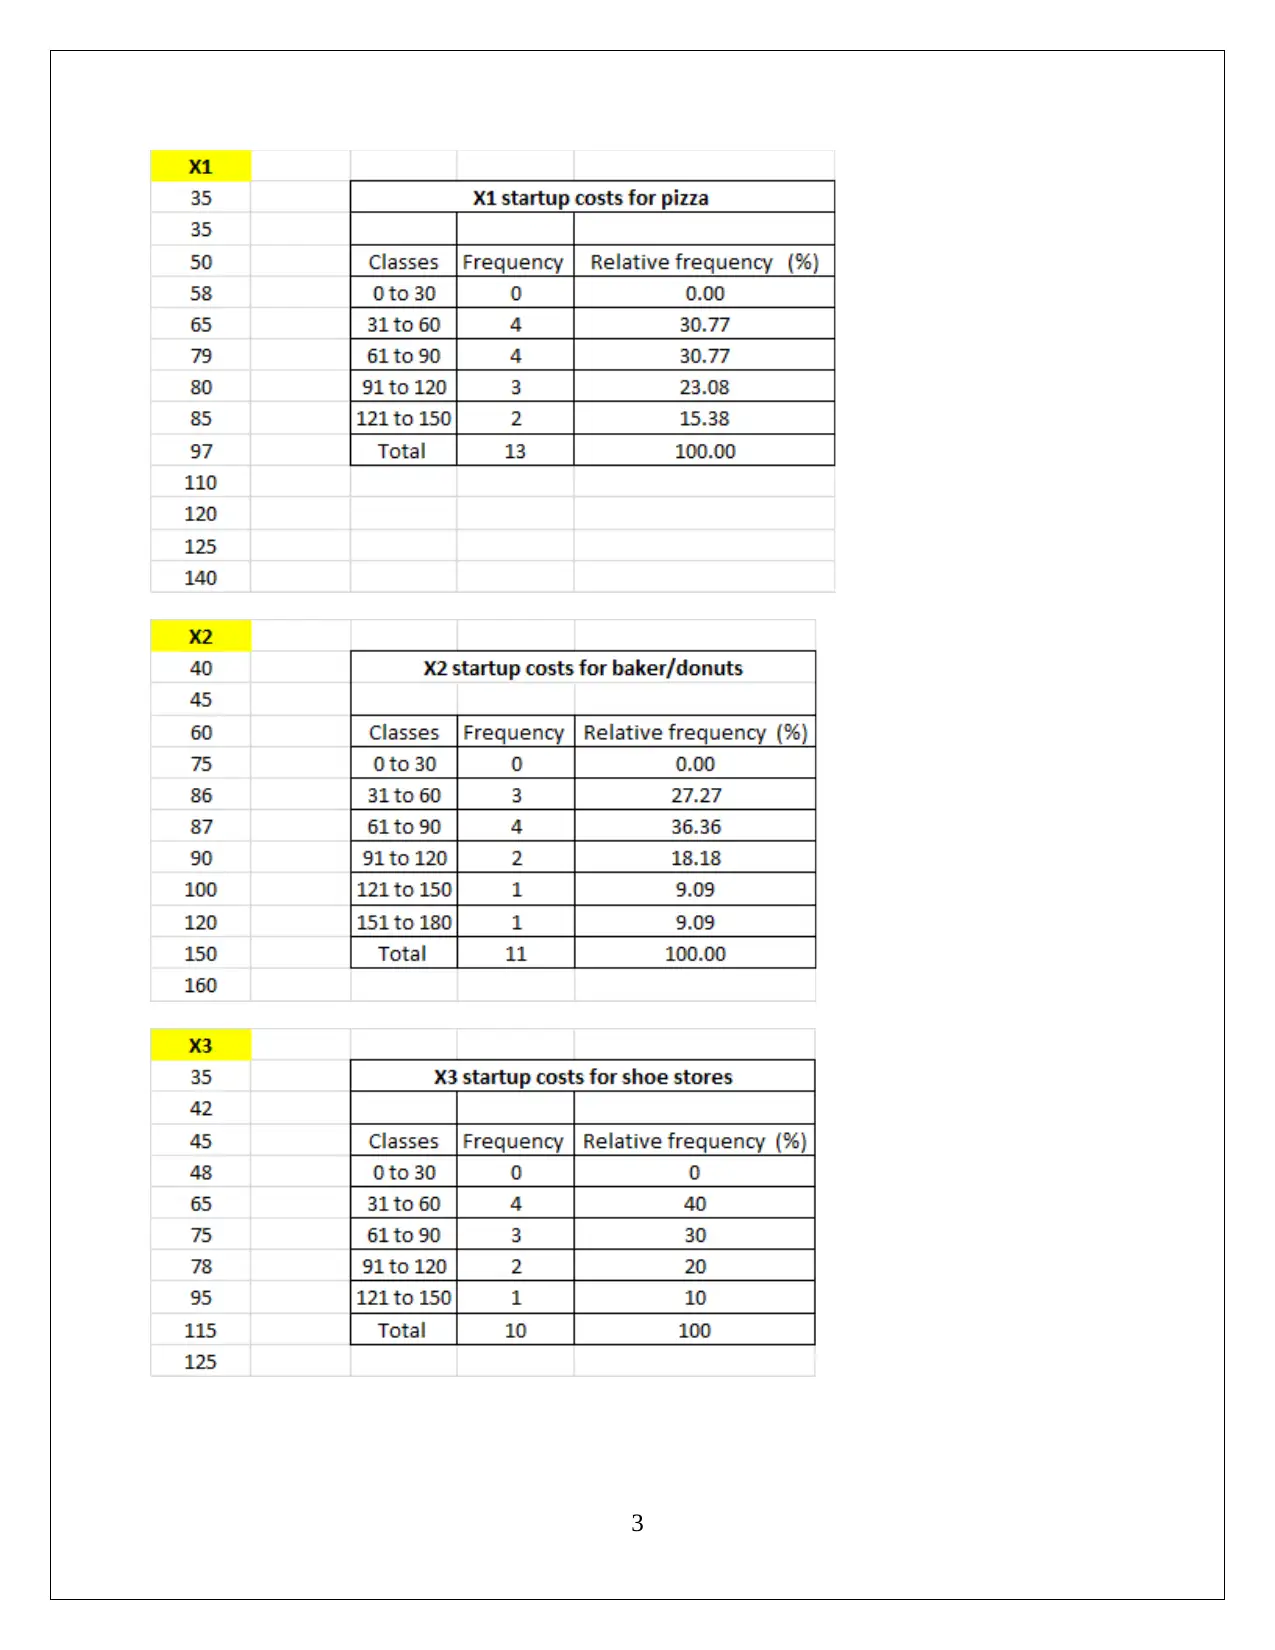
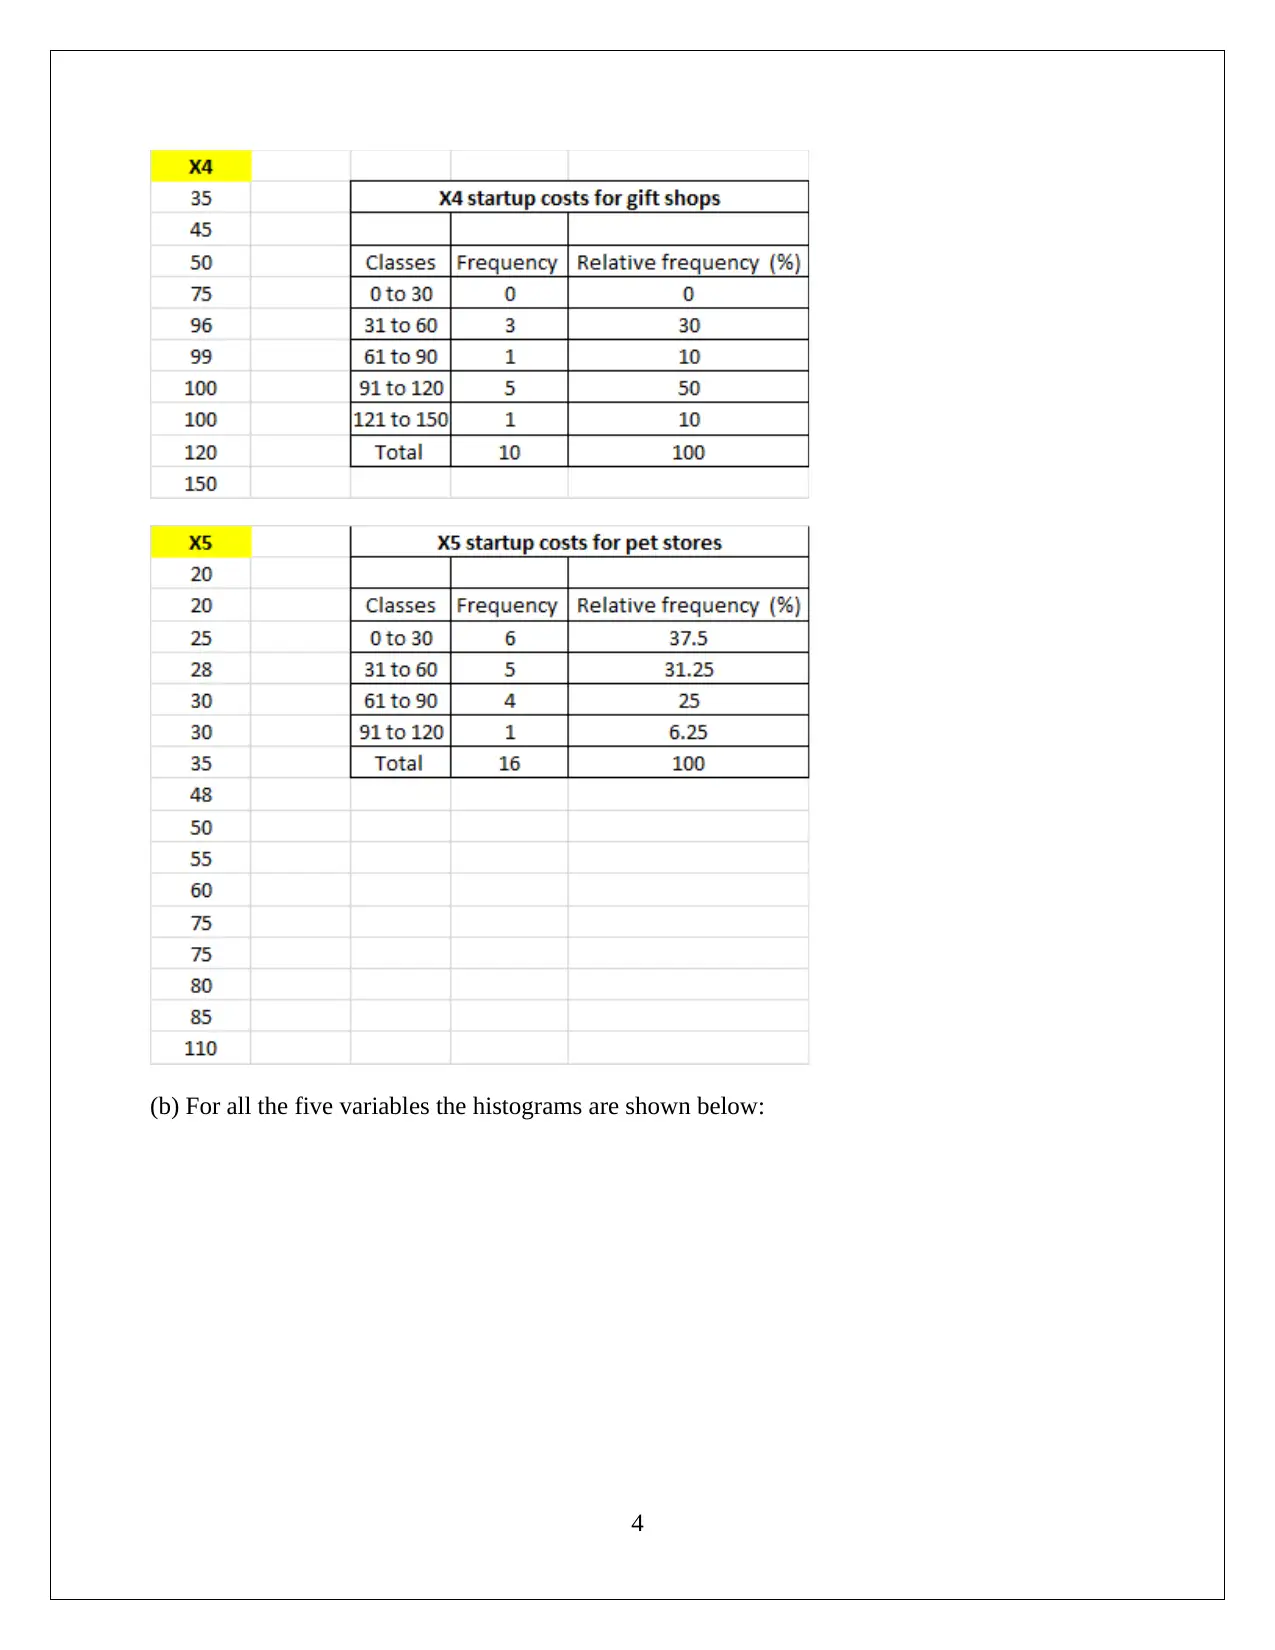
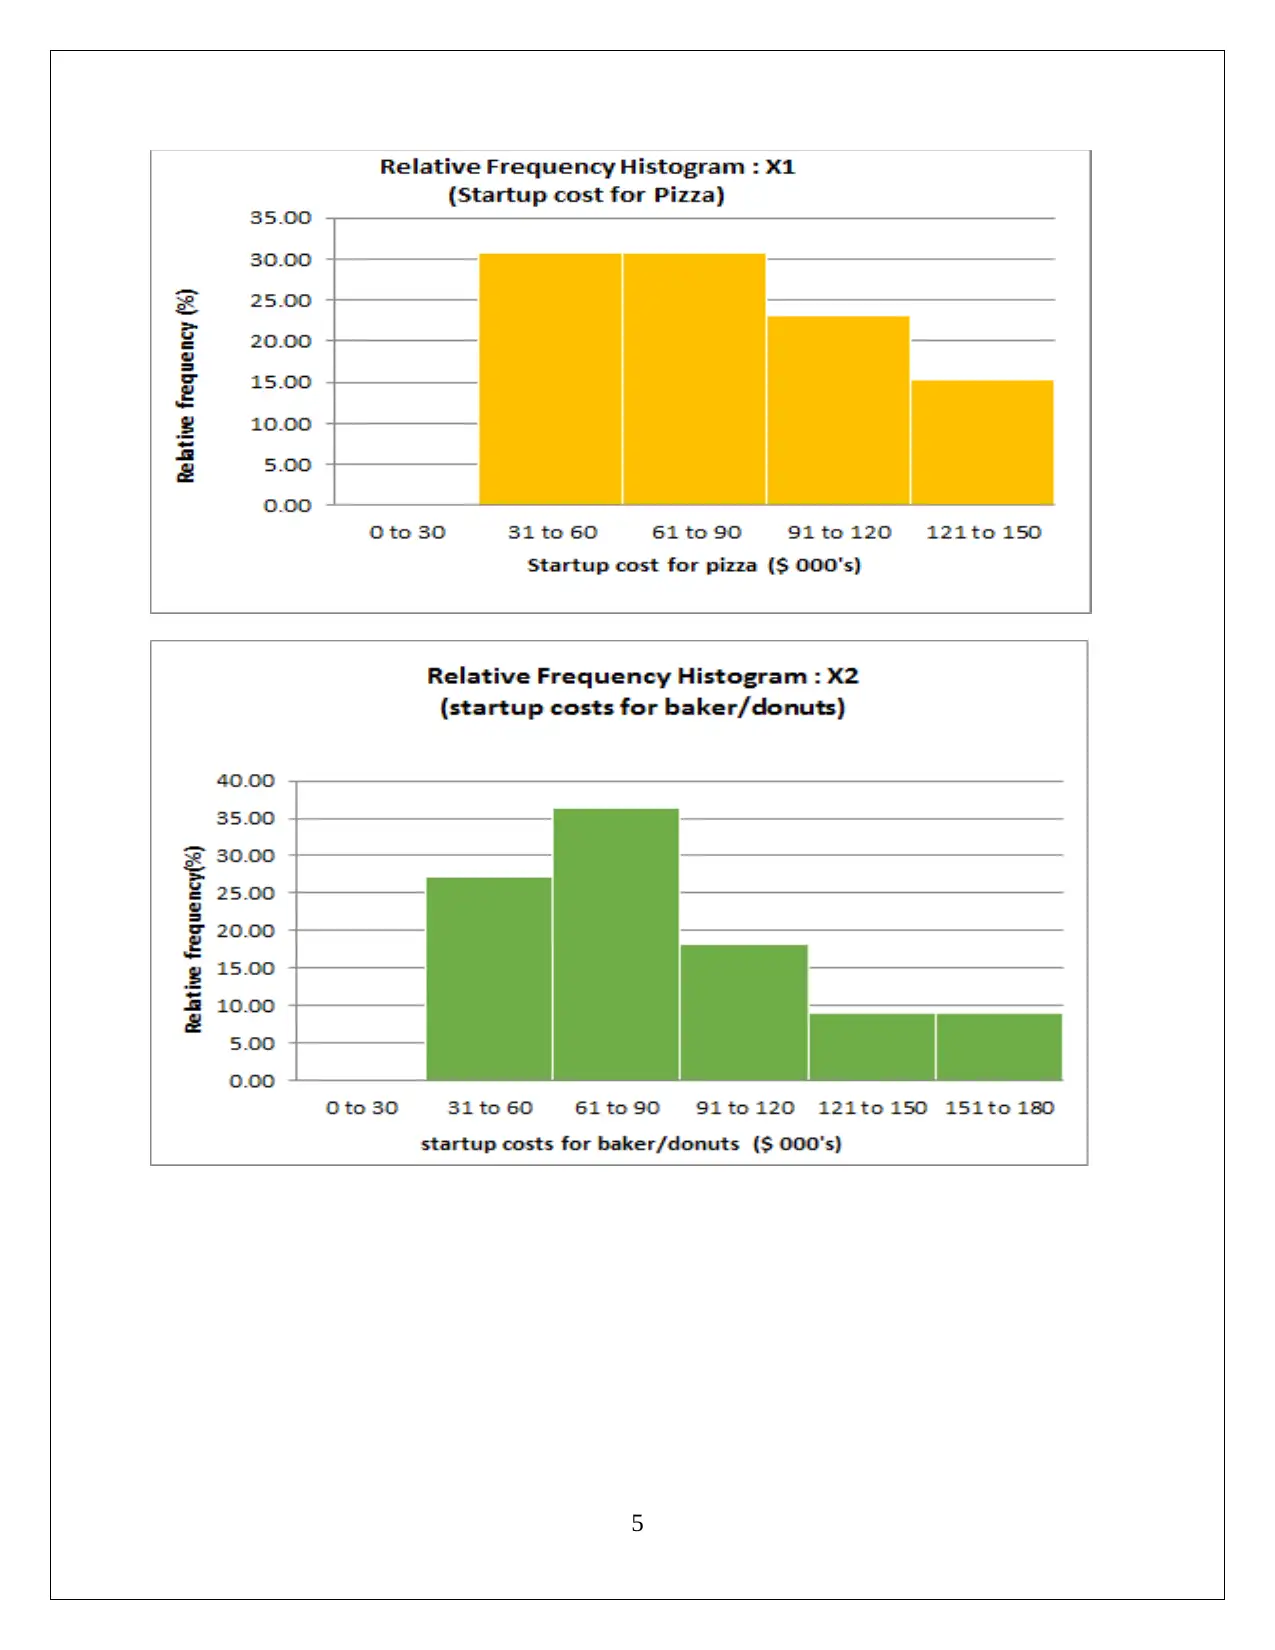
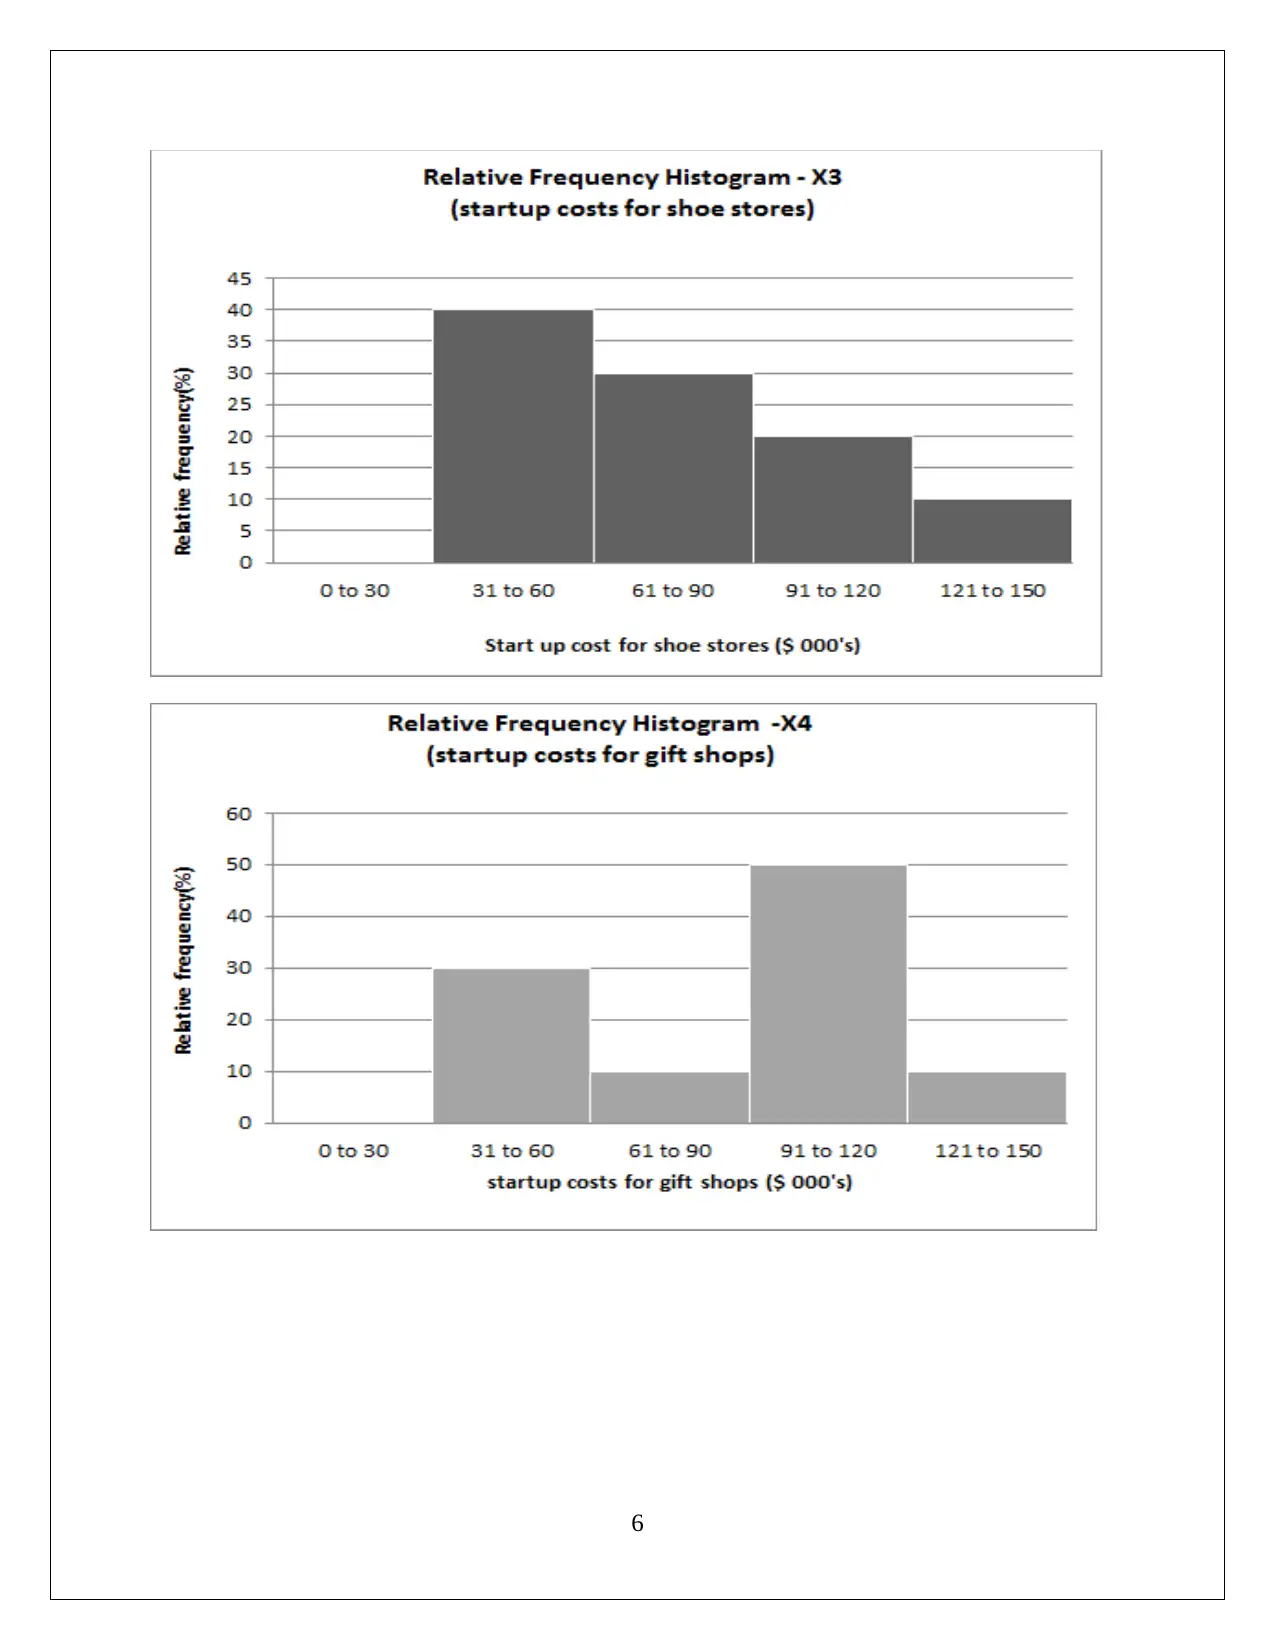
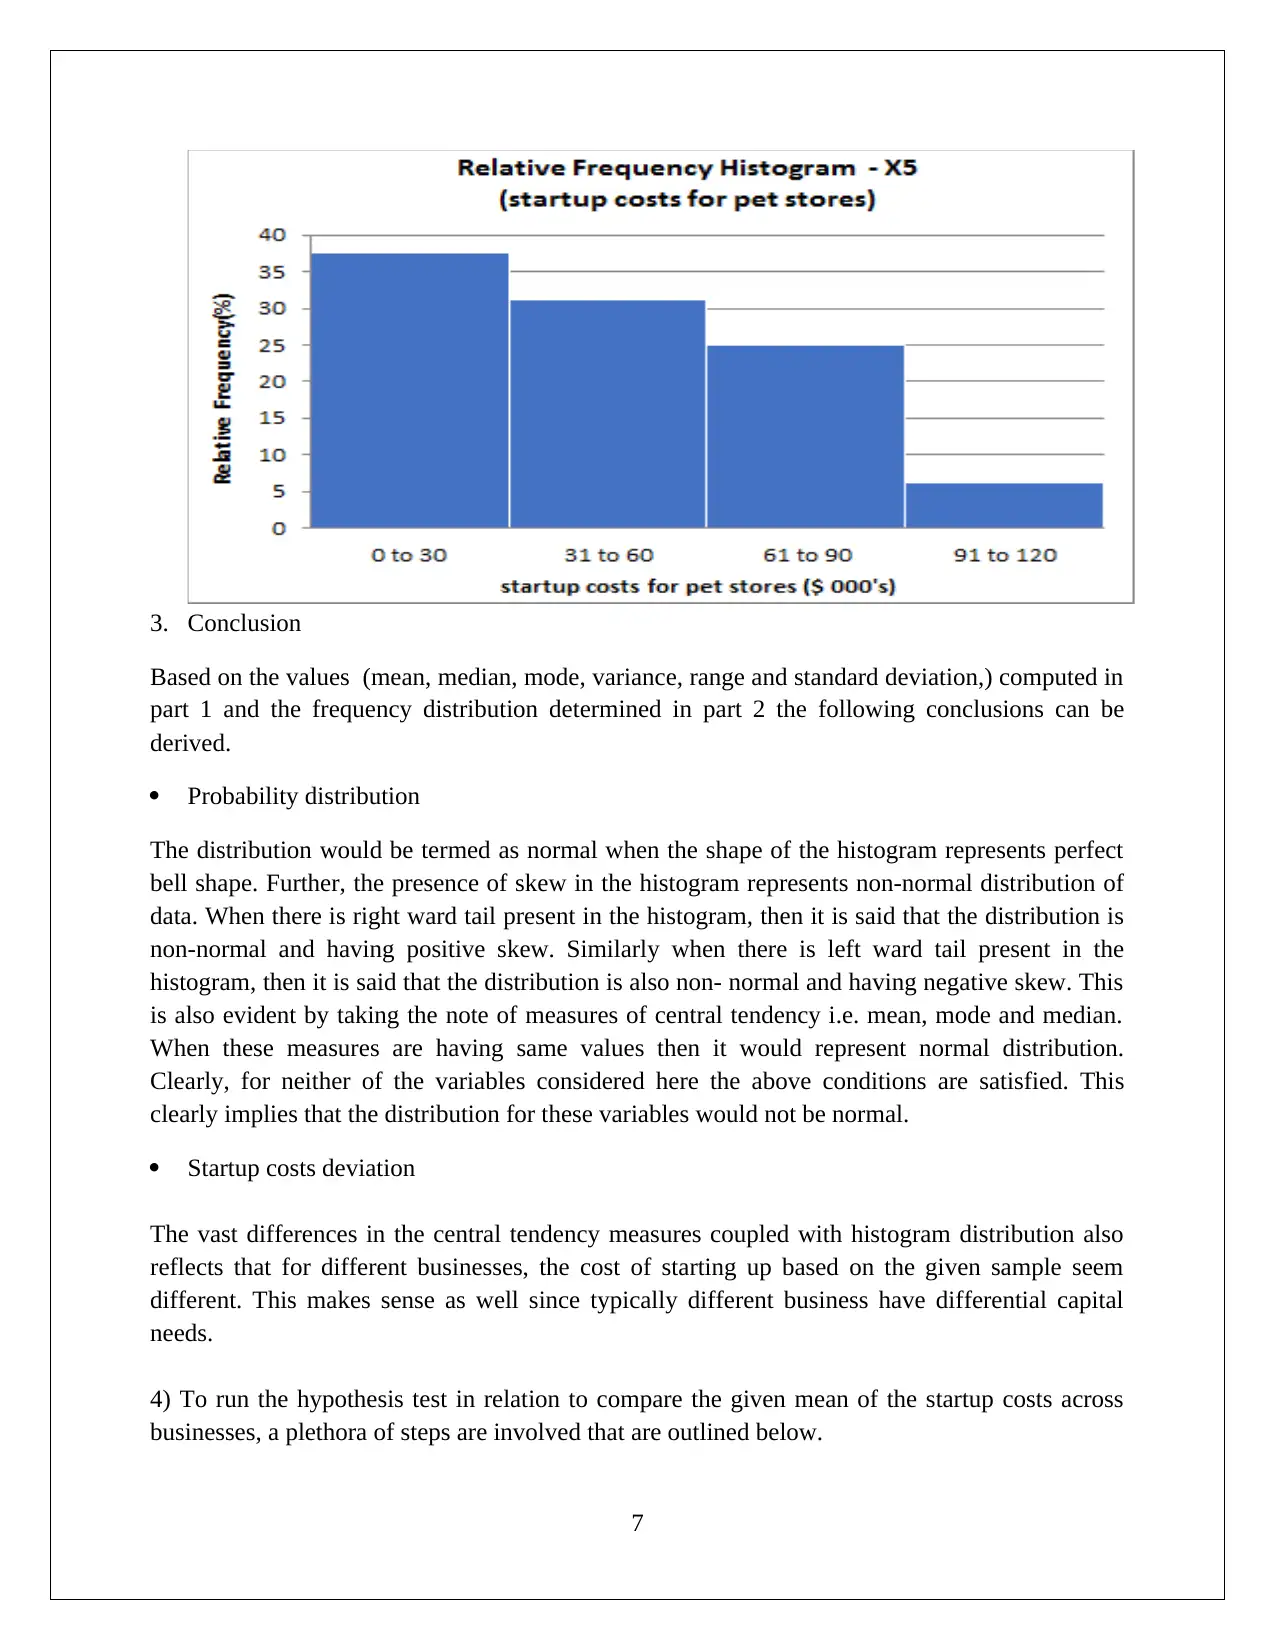
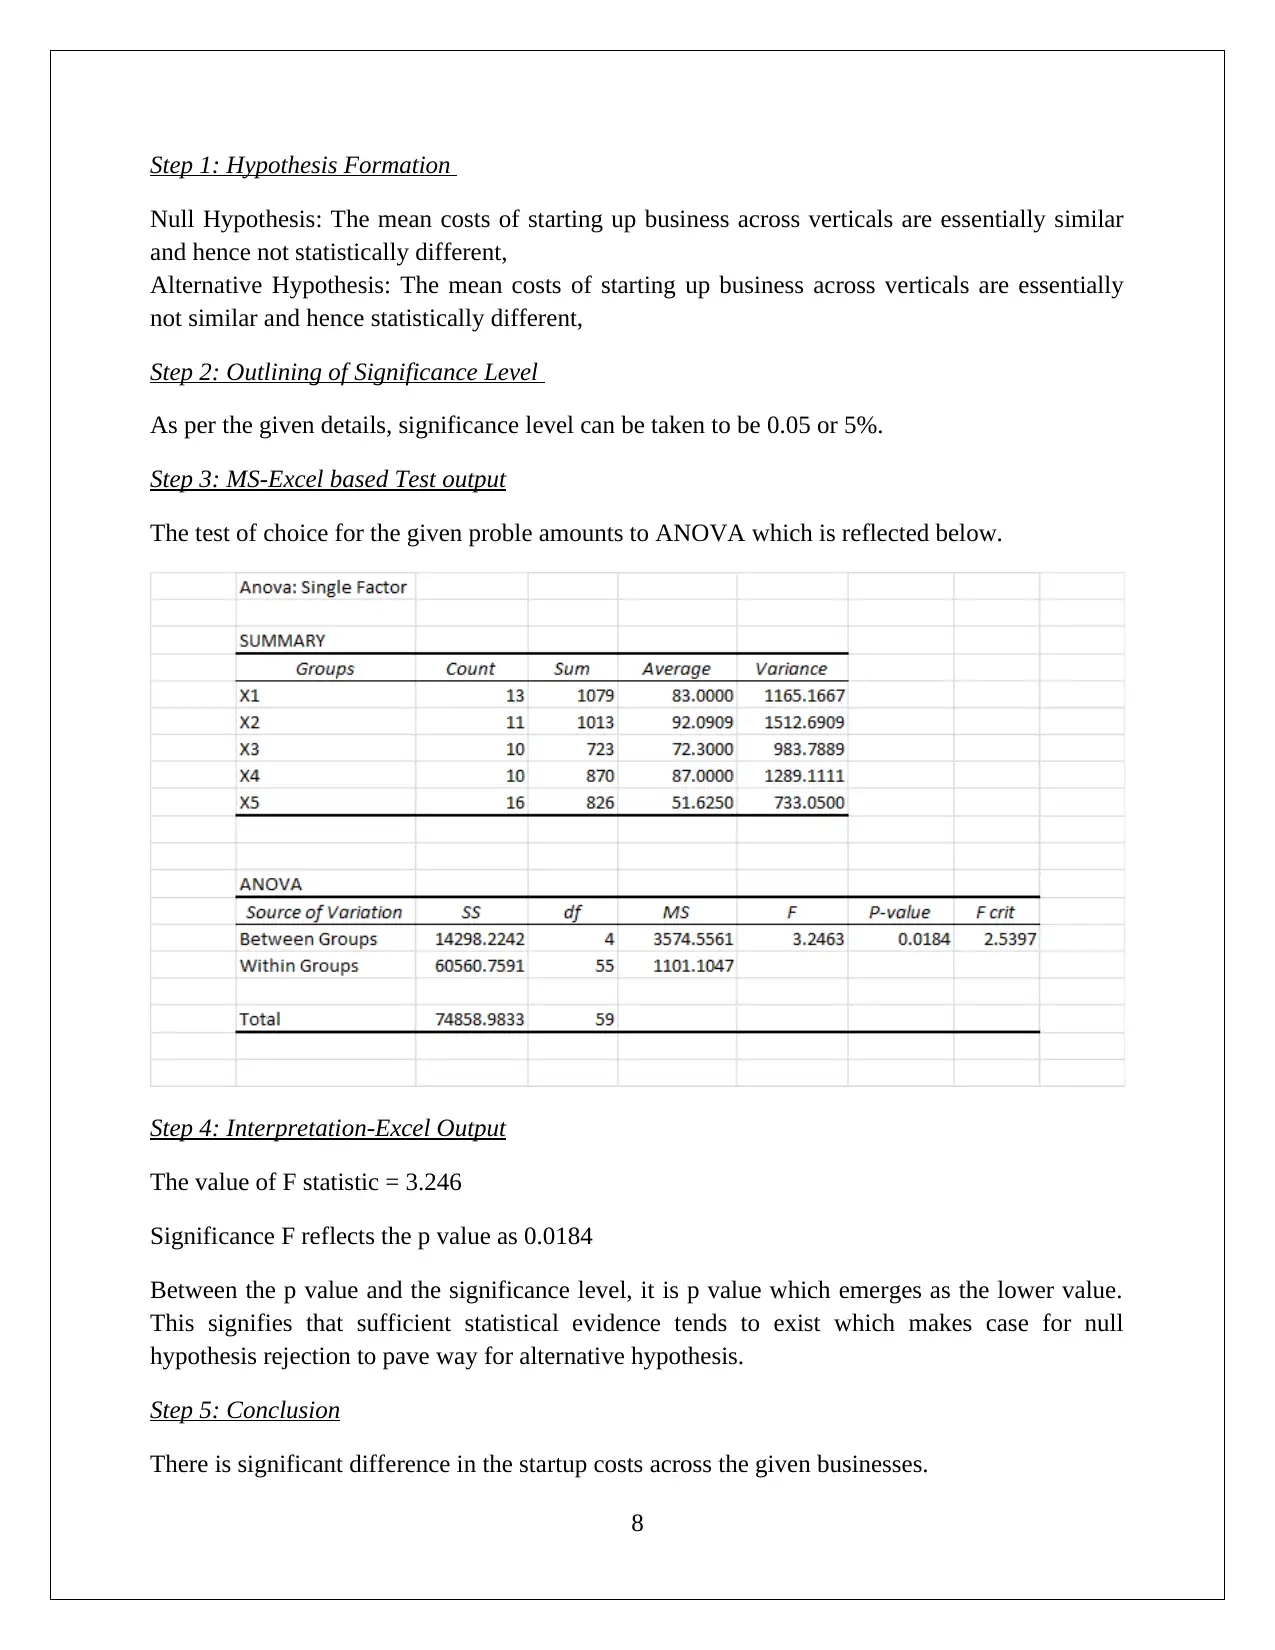
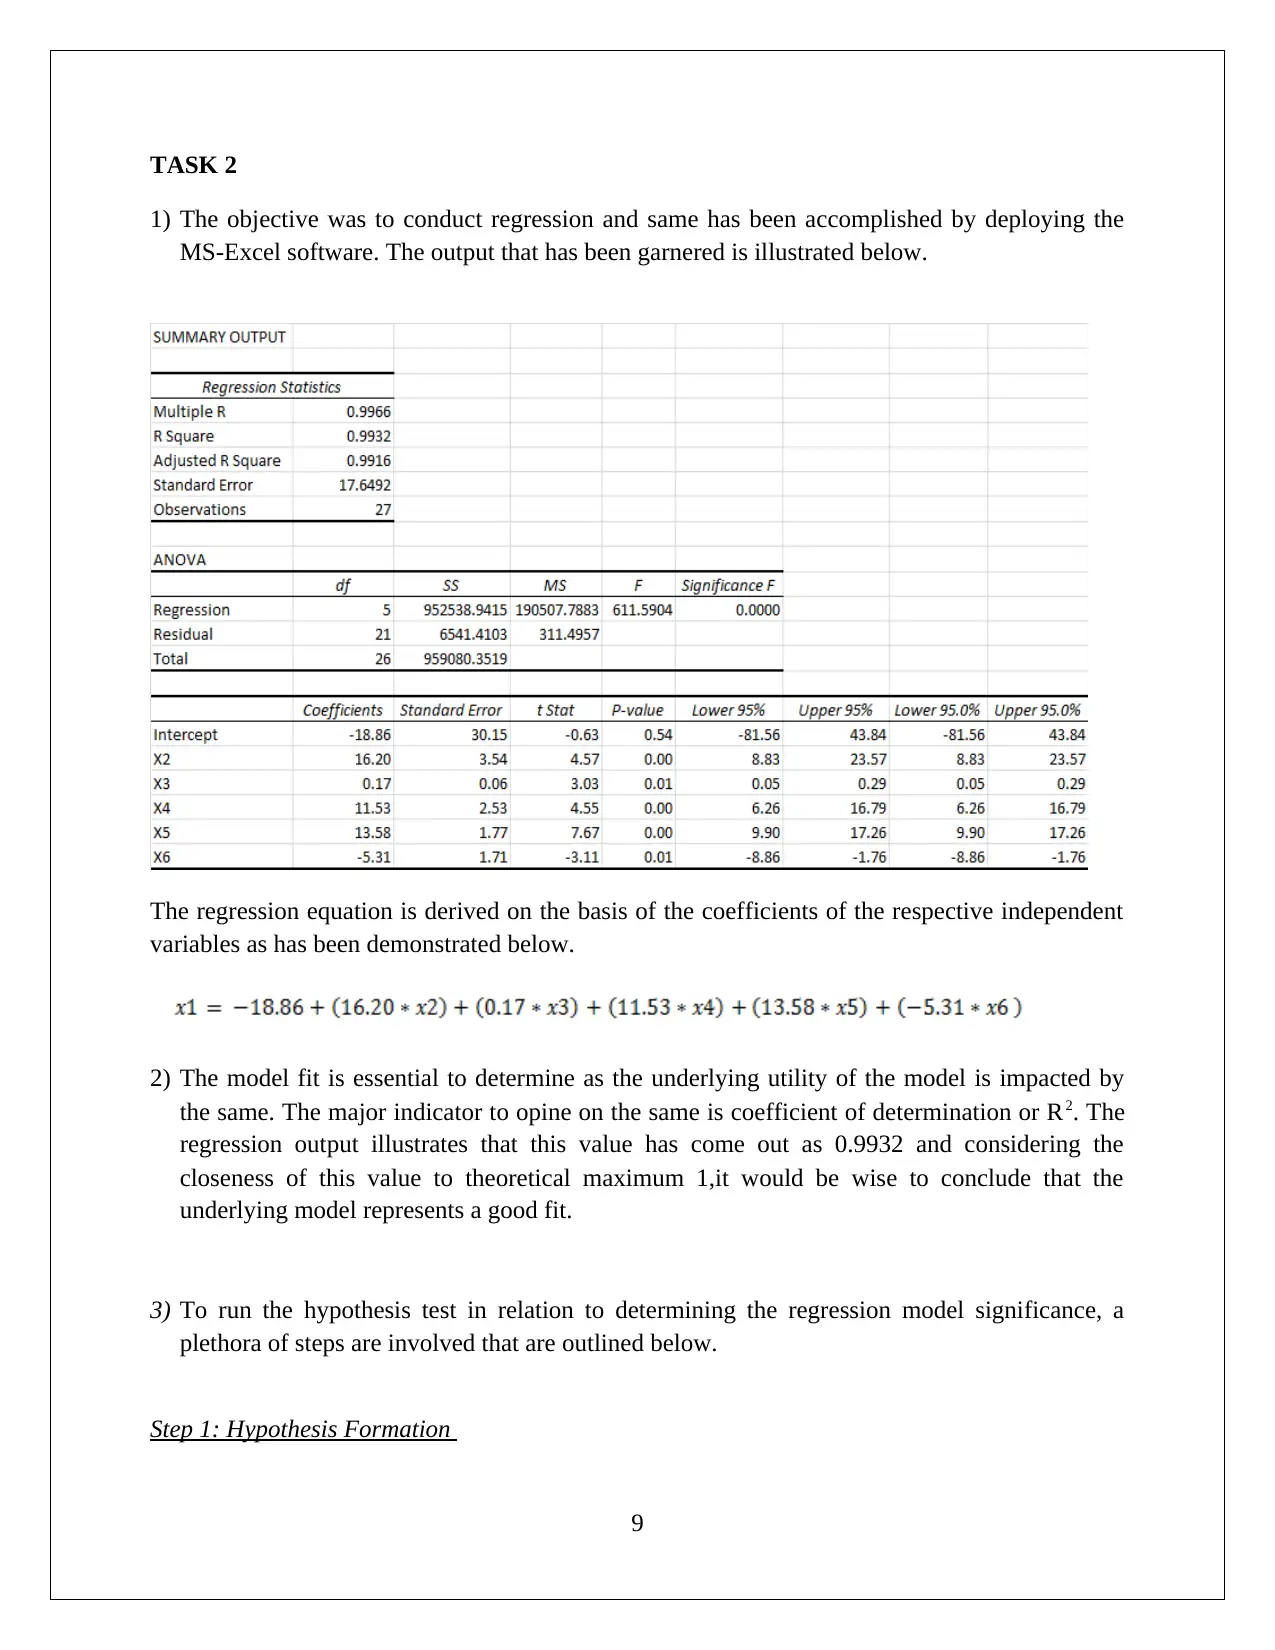
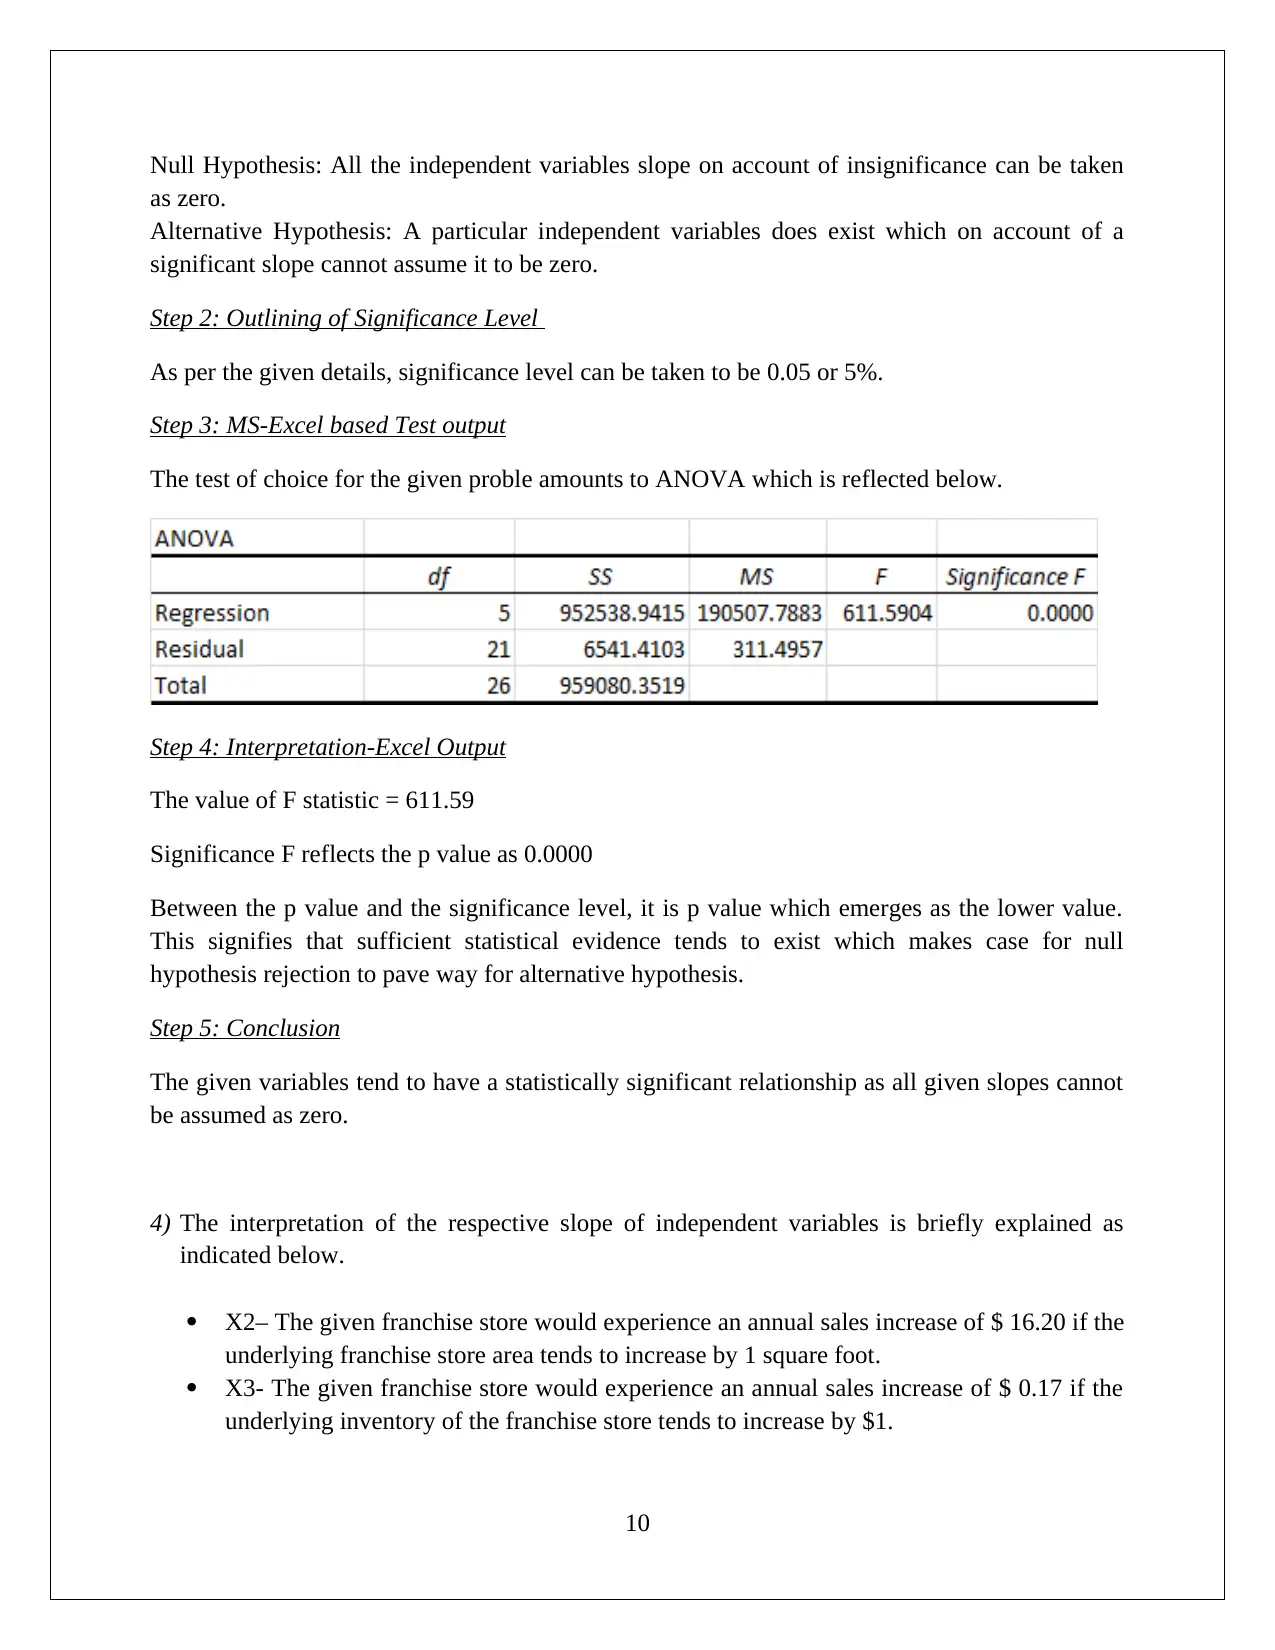
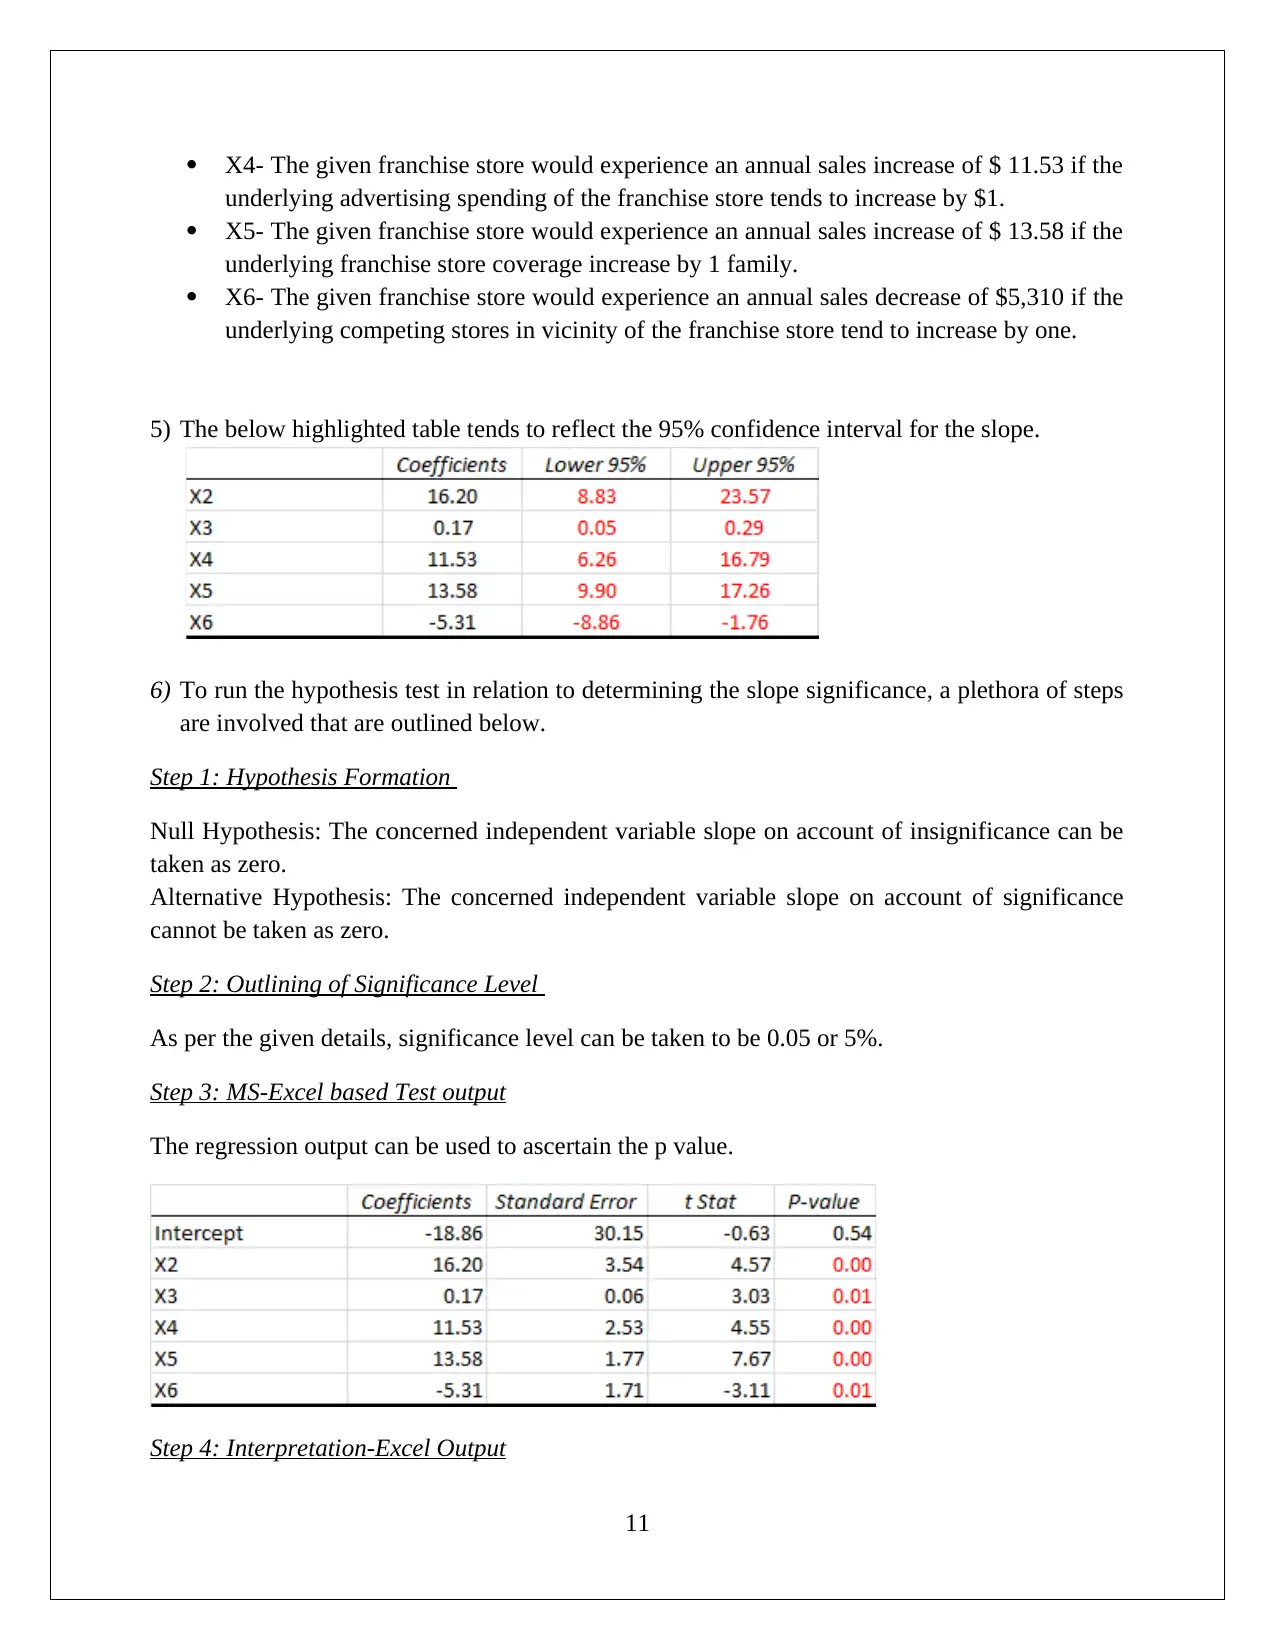
This statistics assignment presents a comprehensive analysis of data, encompassing descriptive statistics, hypothesis testing, and regression analysis. The assignment begins with the computation of descriptive statistics (mean, median, mode, range, variance, and standard deviation) using MS Excel, followed by frequency and relative frequency distributions and the creation of histograms. The first task focuses on comparing startup costs across different business types, including ANOVA and hypothesis testing to determine if there are significant differences in startup costs. The second task delves into regression analysis, utilizing MS Excel to develop a regression model. The solution includes the regression equation, model fit assessment, and hypothesis testing for both the overall model and individual slopes of the independent variables. The interpretation of coefficients, confidence intervals, and conclusions regarding variable significance are also provided. The conclusion affirms the significance of each slope, supporting the inclusion of all independent variables in the regression model.
Document Page
STATISTICS
Student id
[Pick the date]
tabler-icon-diamond-filled.svg

Paraphrase This Document

Need a fresh take? Get an instant paraphrase of this document with our AI Paraphraser
Document Page
Task 1
Data
1. The below highlighted table presents mean, median, mode, range, variance and standard
deviation for variables. These values has been computed by using MS- excel inbuilt functions
which are listed below:
For mean =AVERAGE ()
For median =MEDIAN()
For mode =MODE()
For standard deviation =STDEV()
For variance =VAR()
For range =MAX() – MIN()
1
Document Page
2. (a) For the computation frequency and relative frequency for the startup cost for various
business types a class size of 30 has been taken into consideration. The relative frequency
distribution has been computed by dividing the frequency with total frequency and
multiplying with 100. The tables present frequency and relative frequency distribution for the
variables.
2
Document Page
3
tabler-icon-diamond-filled.svg

Paraphrase This Document

Need a fresh take? Get an instant paraphrase of this document with our AI Paraphraser
Document Page
(b) For all the five variables the histograms are shown below:
4
Document Page
5
Document Page
6
tabler-icon-diamond-filled.svg

Paraphrase This Document

Need a fresh take? Get an instant paraphrase of this document with our AI Paraphraser
Document Page
3. Conclusion
Based on the values (mean, median, mode, variance, range and standard deviation,) computed in
part 1 and the frequency distribution determined in part 2 the following conclusions can be
derived.
Probability distribution
The distribution would be termed as normal when the shape of the histogram represents perfect
bell shape. Further, the presence of skew in the histogram represents non-normal distribution of
data. When there is right ward tail present in the histogram, then it is said that the distribution is
non-normal and having positive skew. Similarly when there is left ward tail present in the
histogram, then it is said that the distribution is also non- normal and having negative skew. This
is also evident by taking the note of measures of central tendency i.e. mean, mode and median.
When these measures are having same values then it would represent normal distribution.
Clearly, for neither of the variables considered here the above conditions are satisfied. This
clearly implies that the distribution for these variables would not be normal.
Startup costs deviation
The vast differences in the central tendency measures coupled with histogram distribution also
reflects that for different businesses, the cost of starting up based on the given sample seem
different. This makes sense as well since typically different business have differential capital
needs.
4) To run the hypothesis test in relation to compare the given mean of the startup costs across
businesses, a plethora of steps are involved that are outlined below.
7
Document Page
Step 1: Hypothesis Formation
Null Hypothesis: The mean costs of starting up business across verticals are essentially similar
and hence not statistically different,
Alternative Hypothesis: The mean costs of starting up business across verticals are essentially
not similar and hence statistically different,
Step 2: Outlining of Significance Level
As per the given details, significance level can be taken to be 0.05 or 5%.
Step 3: MS-Excel based Test output
The test of choice for the given proble amounts to ANOVA which is reflected below.
Step 4: Interpretation-Excel Output
The value of F statistic = 3.246
Significance F reflects the p value as 0.0184
Between the p value and the significance level, it is p value which emerges as the lower value.
This signifies that sufficient statistical evidence tends to exist which makes case for null
hypothesis rejection to pave way for alternative hypothesis.
Step 5: Conclusion
There is significant difference in the startup costs across the given businesses.
8
Document Page
TASK 2
1) The objective was to conduct regression and same has been accomplished by deploying the
MS-Excel software. The output that has been garnered is illustrated below.
The regression equation is derived on the basis of the coefficients of the respective independent
variables as has been demonstrated below.
2) The model fit is essential to determine as the underlying utility of the model is impacted by
the same. The major indicator to opine on the same is coefficient of determination or R2. The
regression output illustrates that this value has come out as 0.9932 and considering the
closeness of this value to theoretical maximum 1,it would be wise to conclude that the
underlying model represents a good fit.
3) To run the hypothesis test in relation to determining the regression model significance, a
plethora of steps are involved that are outlined below.
Step 1: Hypothesis Formation
9
tabler-icon-diamond-filled.svg

Paraphrase This Document

Need a fresh take? Get an instant paraphrase of this document with our AI Paraphraser
Document Page
Null Hypothesis: All the independent variables slope on account of insignificance can be taken
as zero.
Alternative Hypothesis: A particular independent variables does exist which on account of a
significant slope cannot assume it to be zero.
Step 2: Outlining of Significance Level
As per the given details, significance level can be taken to be 0.05 or 5%.
Step 3: MS-Excel based Test output
The test of choice for the given proble amounts to ANOVA which is reflected below.
Step 4: Interpretation-Excel Output
The value of F statistic = 611.59
Significance F reflects the p value as 0.0000
Between the p value and the significance level, it is p value which emerges as the lower value.
This signifies that sufficient statistical evidence tends to exist which makes case for null
hypothesis rejection to pave way for alternative hypothesis.
Step 5: Conclusion
The given variables tend to have a statistically significant relationship as all given slopes cannot
be assumed as zero.
4) The interpretation of the respective slope of independent variables is briefly explained as
indicated below.
X2– The given franchise store would experience an annual sales increase of $ 16.20 if the
underlying franchise store area tends to increase by 1 square foot.
X3- The given franchise store would experience an annual sales increase of $ 0.17 if the
underlying inventory of the franchise store tends to increase by $1.
10
Document Page
X4- The given franchise store would experience an annual sales increase of $ 11.53 if the
underlying advertising spending of the franchise store tends to increase by $1.
X5- The given franchise store would experience an annual sales increase of $ 13.58 if the
underlying franchise store coverage increase by 1 family.
X6- The given franchise store would experience an annual sales decrease of $5,310 if the
underlying competing stores in vicinity of the franchise store tend to increase by one.
5) The below highlighted table tends to reflect the 95% confidence interval for the slope.
6) To run the hypothesis test in relation to determining the slope significance, a plethora of steps
are involved that are outlined below.
Step 1: Hypothesis Formation
Null Hypothesis: The concerned independent variable slope on account of insignificance can be
taken as zero.
Alternative Hypothesis: The concerned independent variable slope on account of significance
cannot be taken as zero.
Step 2: Outlining of Significance Level
As per the given details, significance level can be taken to be 0.05 or 5%.
Step 3: MS-Excel based Test output
The regression output can be used to ascertain the p value.
Step 4: Interpretation-Excel Output
11
chevron_up_icon
1 out of 13
circle_padding
hide_on_mobile
zoom_out_icon
[object Object]