Statistical Analysis and Data Interpretation Assignment, Fall 2024
VerifiedAdded on 2020/04/01
|18
|530
|78
Homework Assignment
AI Summary
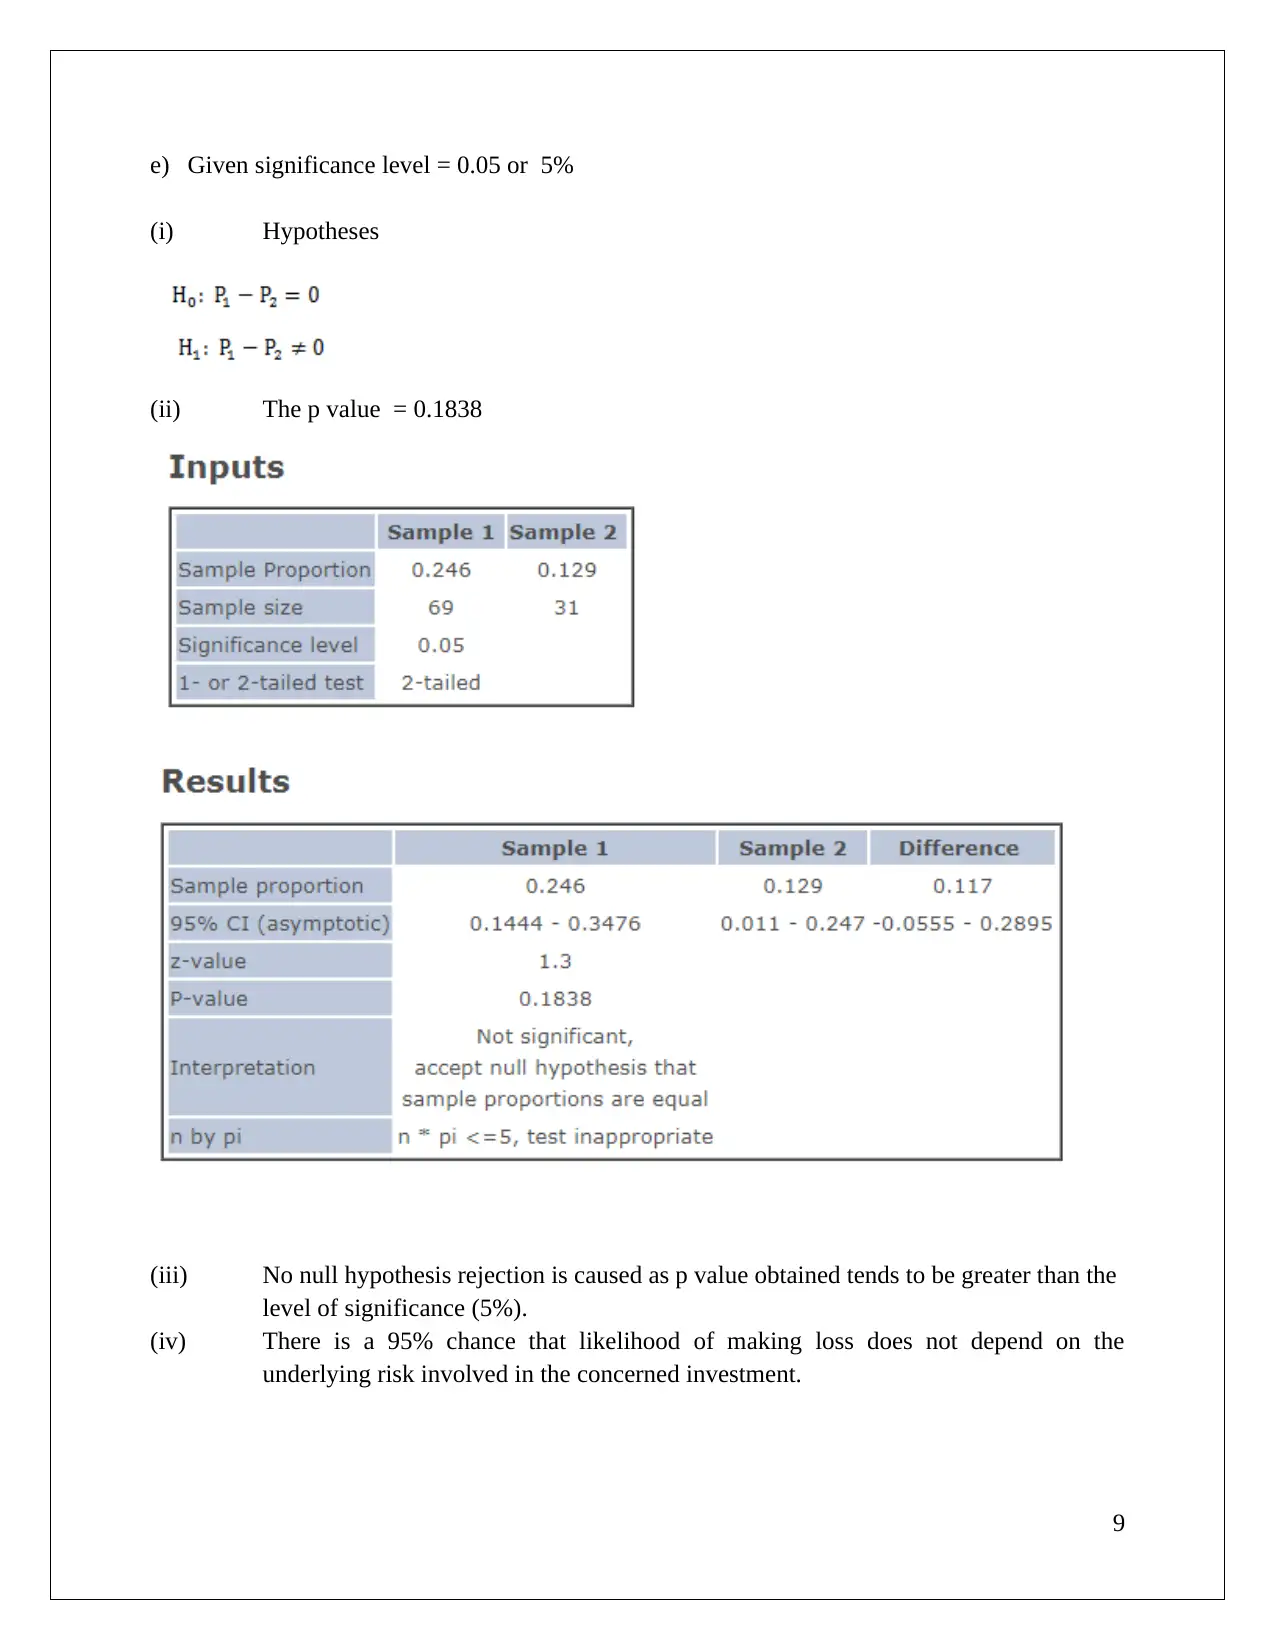
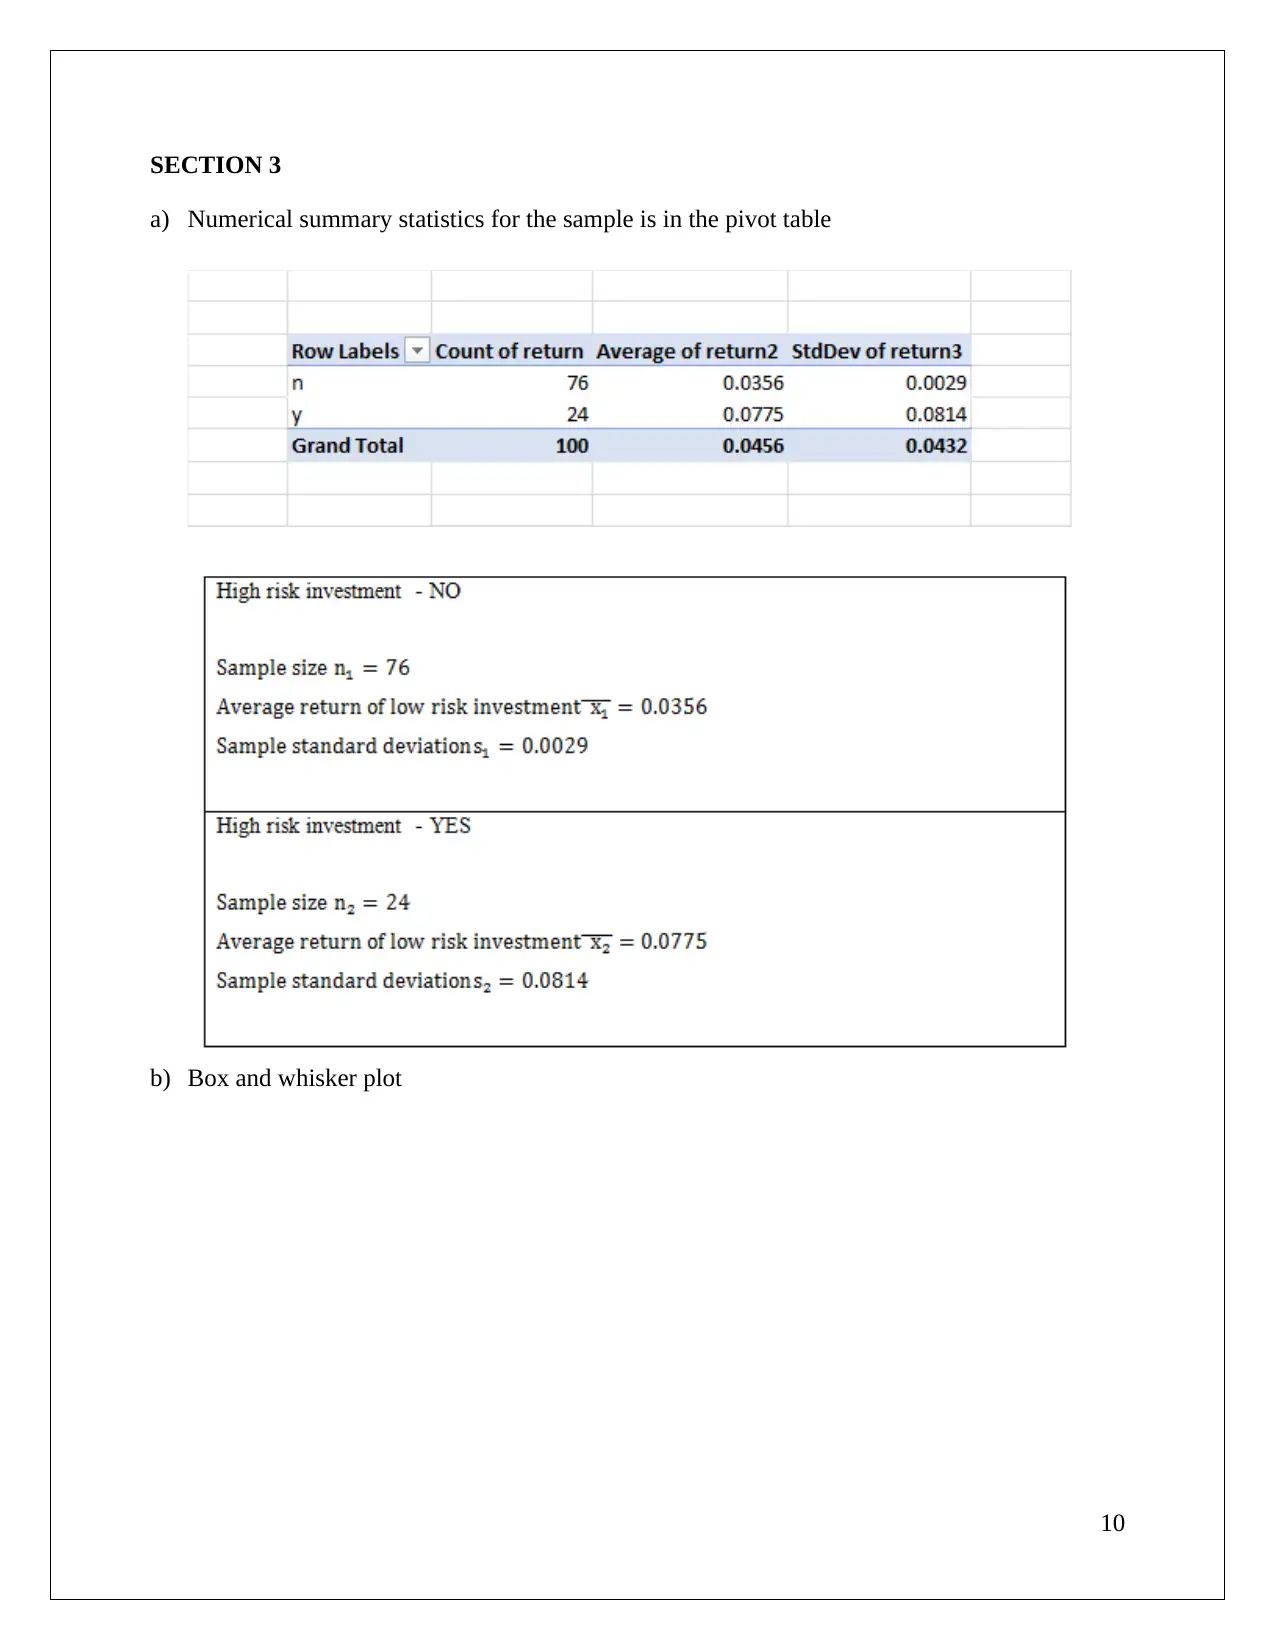
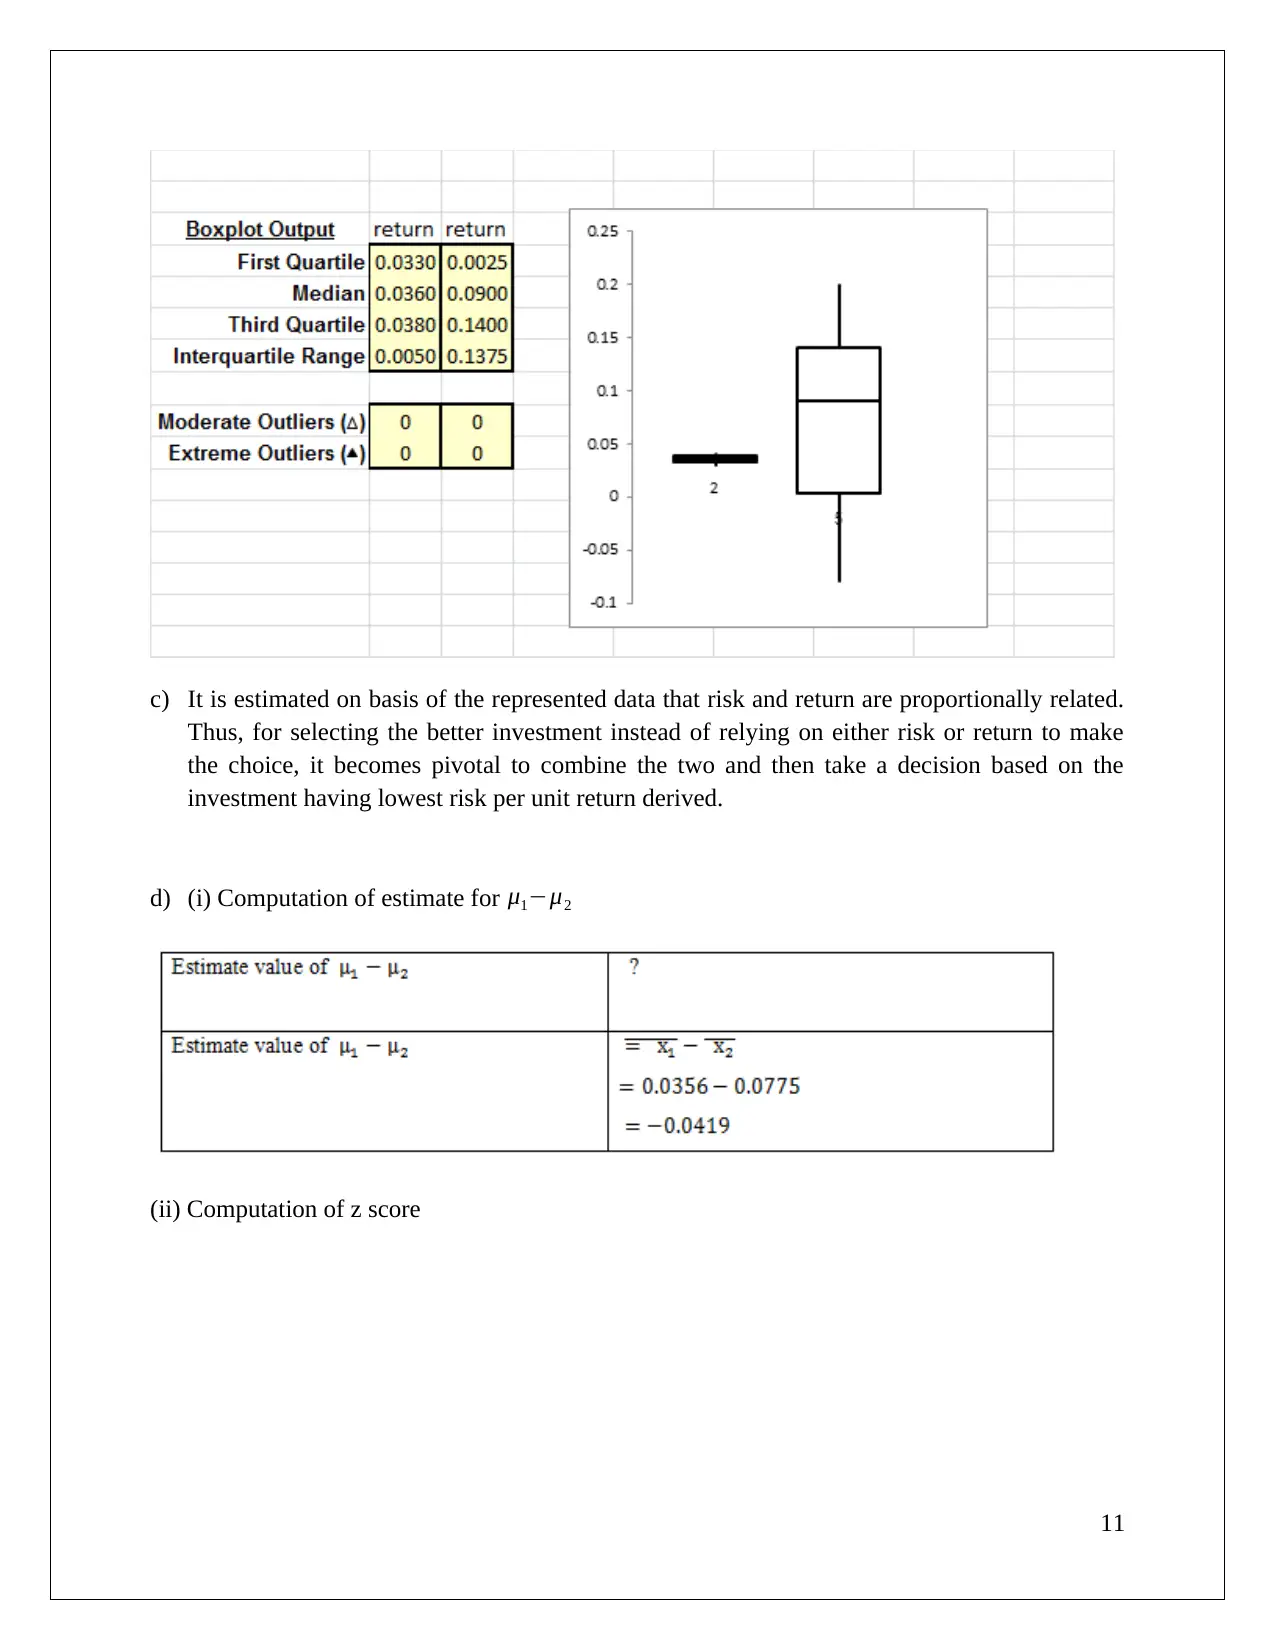
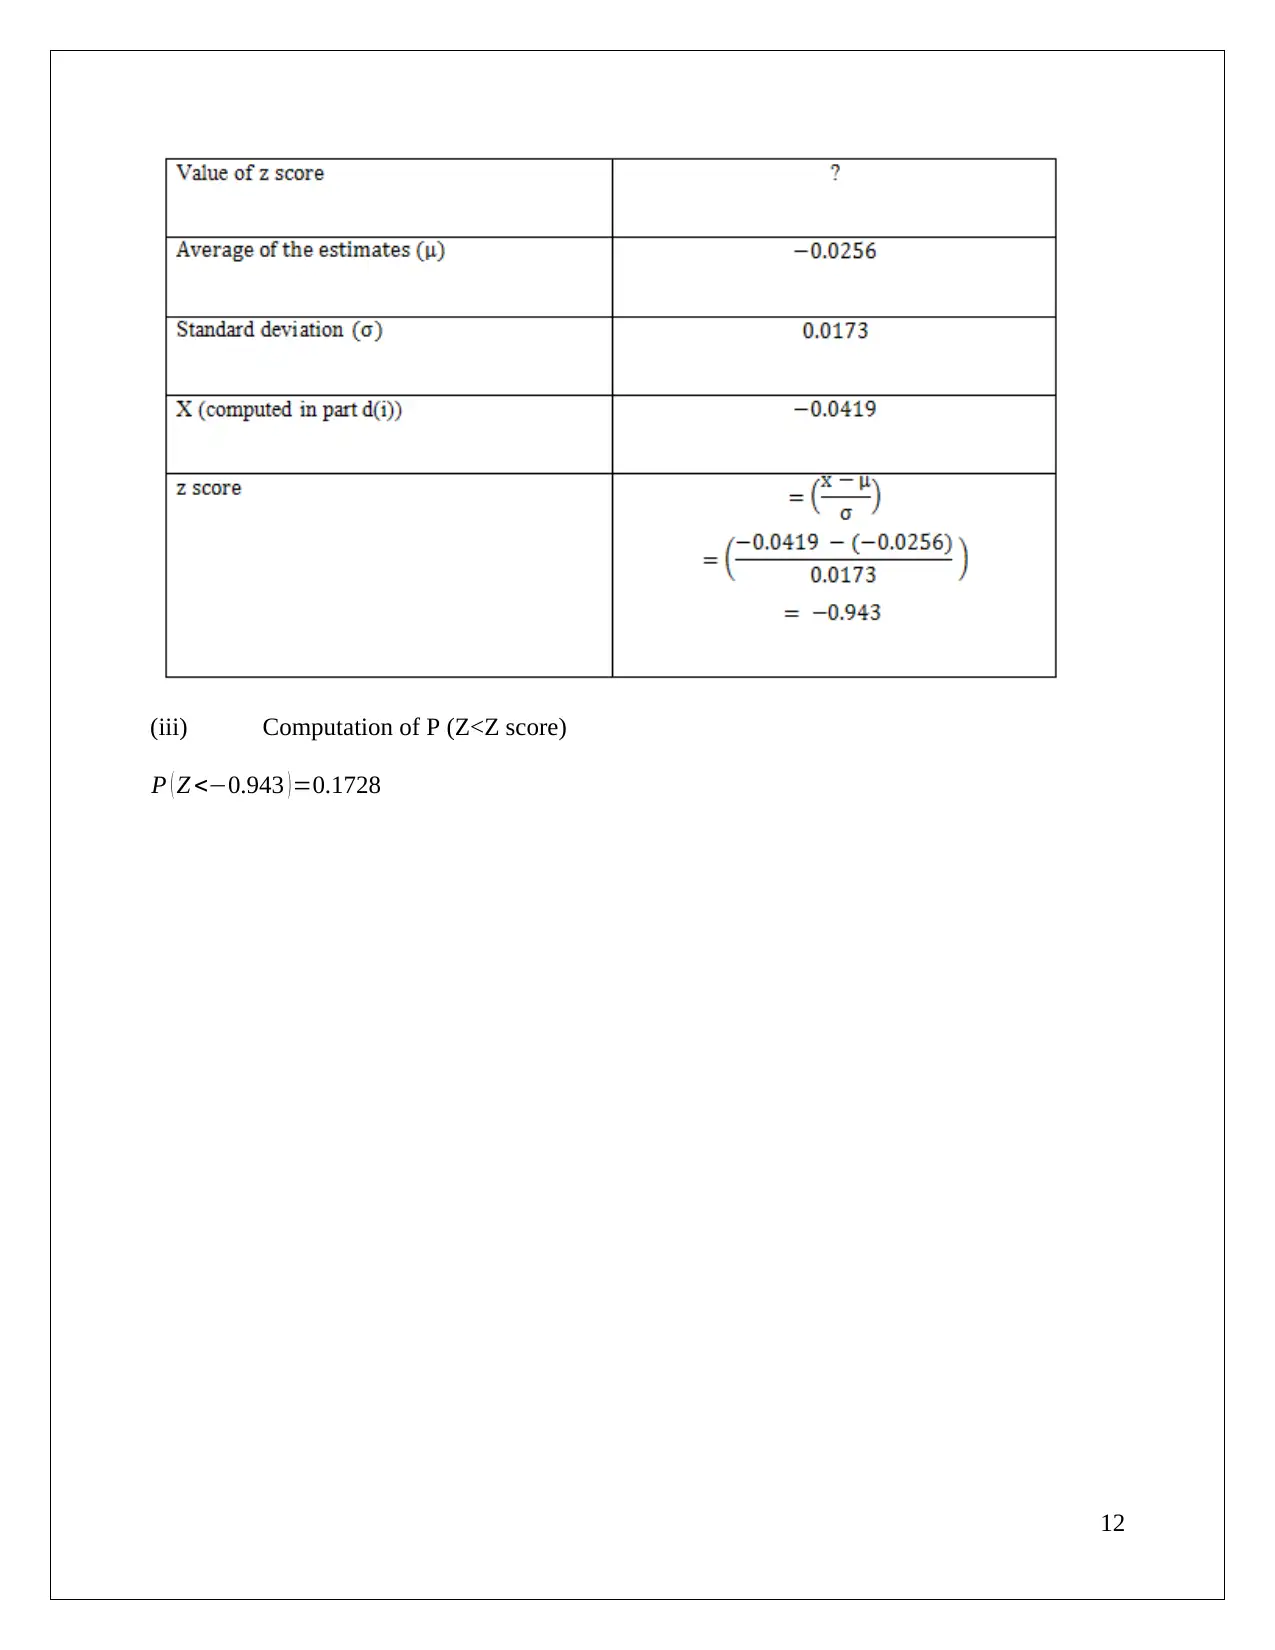
This assignment solution presents a comprehensive data analysis, encompassing various statistical techniques. Section 1 focuses on scatter plots and the computation of annual contributions and z-scores. Section 2 delves into numerical summary statistics, proportions, and hypothesis testing related to investment risk. The analysis includes z-score calculations and p-value interpretations to assess the significance of findings. Section 3 examines box and whisker plots, estimates, and z-score computations, emphasizing the relationship between risk and return in investments. Section 4 provides numerical summary statistics, sample size calculations, and the determination of a 95% confidence interval. The solution demonstrates a strong understanding of statistical concepts, data interpretation, and the application of these techniques to real-world scenarios, such as investment analysis and evaluating proposed changes.
1 out of 18
Related Documents


Your All-in-One AI-Powered Toolkit for Academic Success.
+13062052269
info@desklib.com
Available 24*7 on WhatsApp / Email
![[object Object]](/_next/static/media/star-bottom.7253800d.svg)
Copyright © 2020–2026 A2Z Services. All Rights Reserved. Developed and managed by ZUCOL.