Statistical Analysis Report: Factors Affecting Used Car Prices

Verified

Added on  2020/12/09

|8
|1006
|153
Report
AI Summary
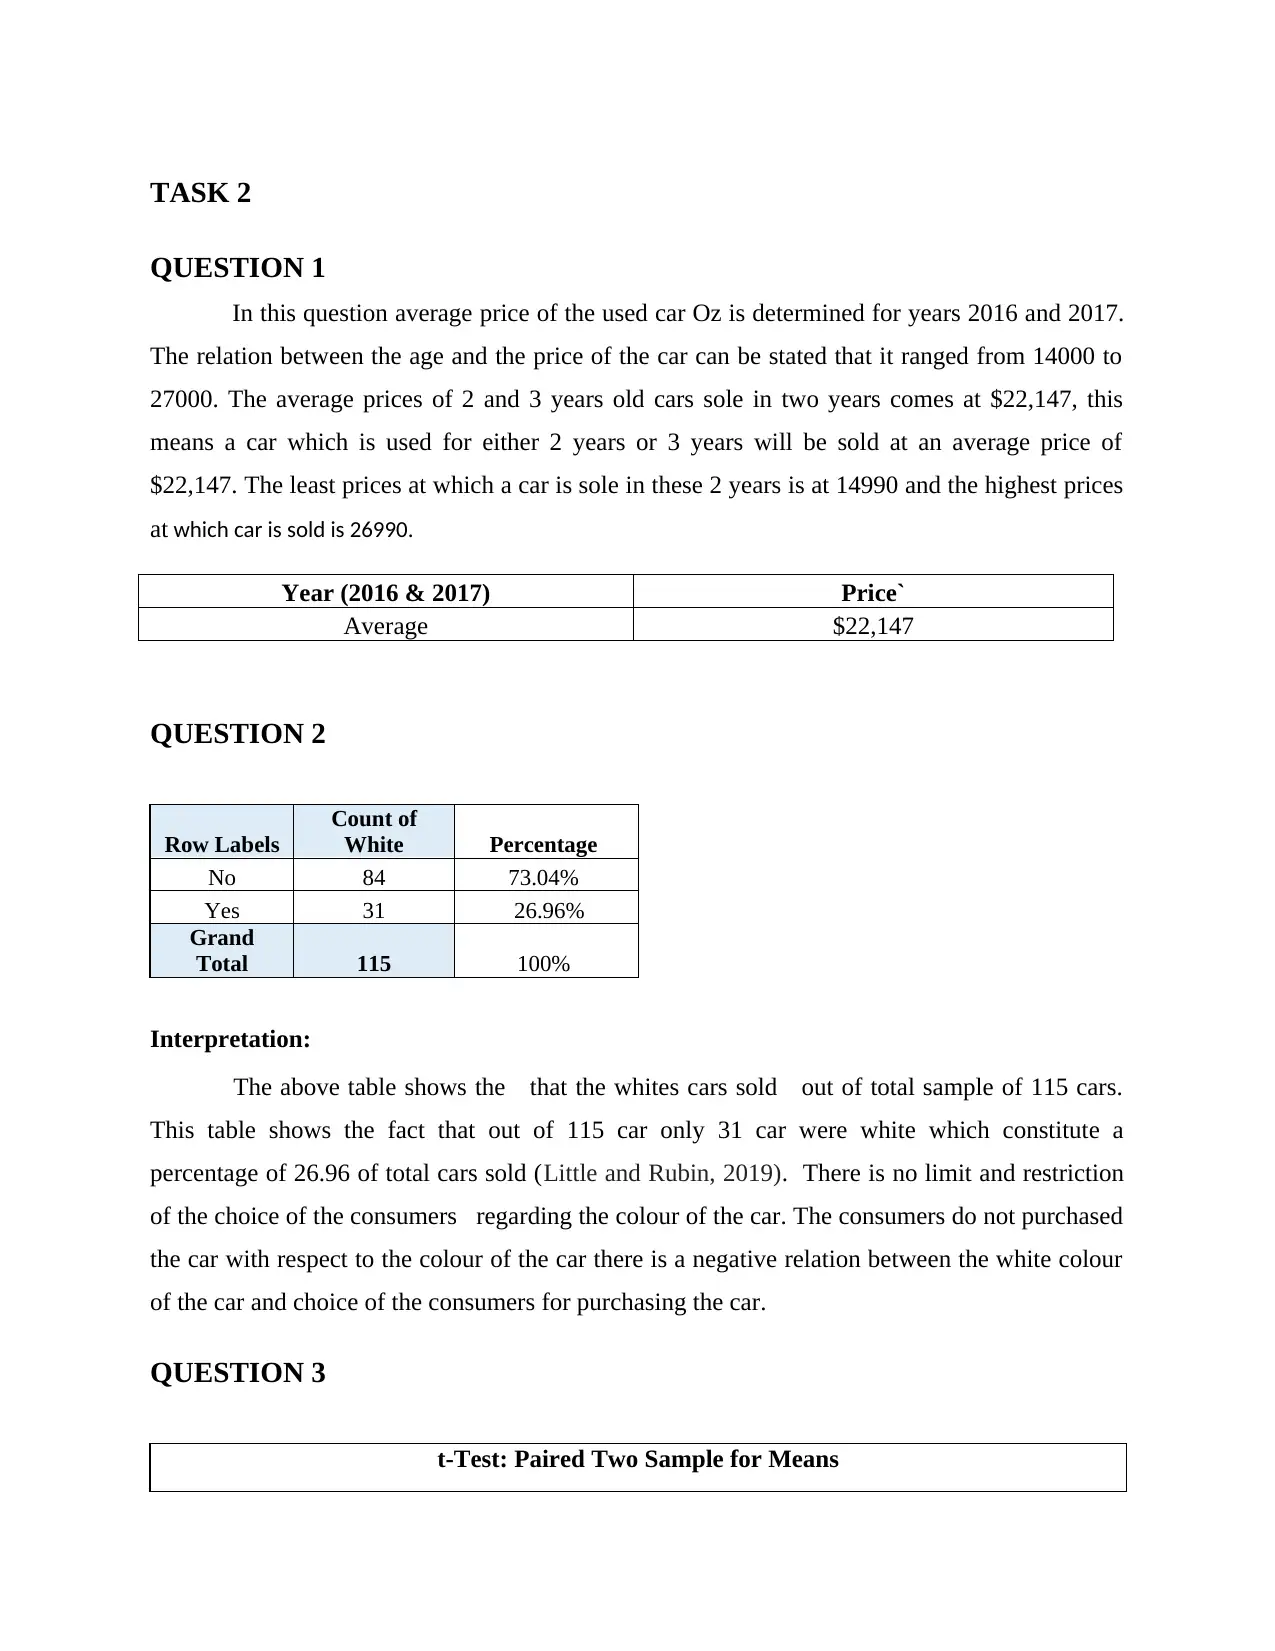
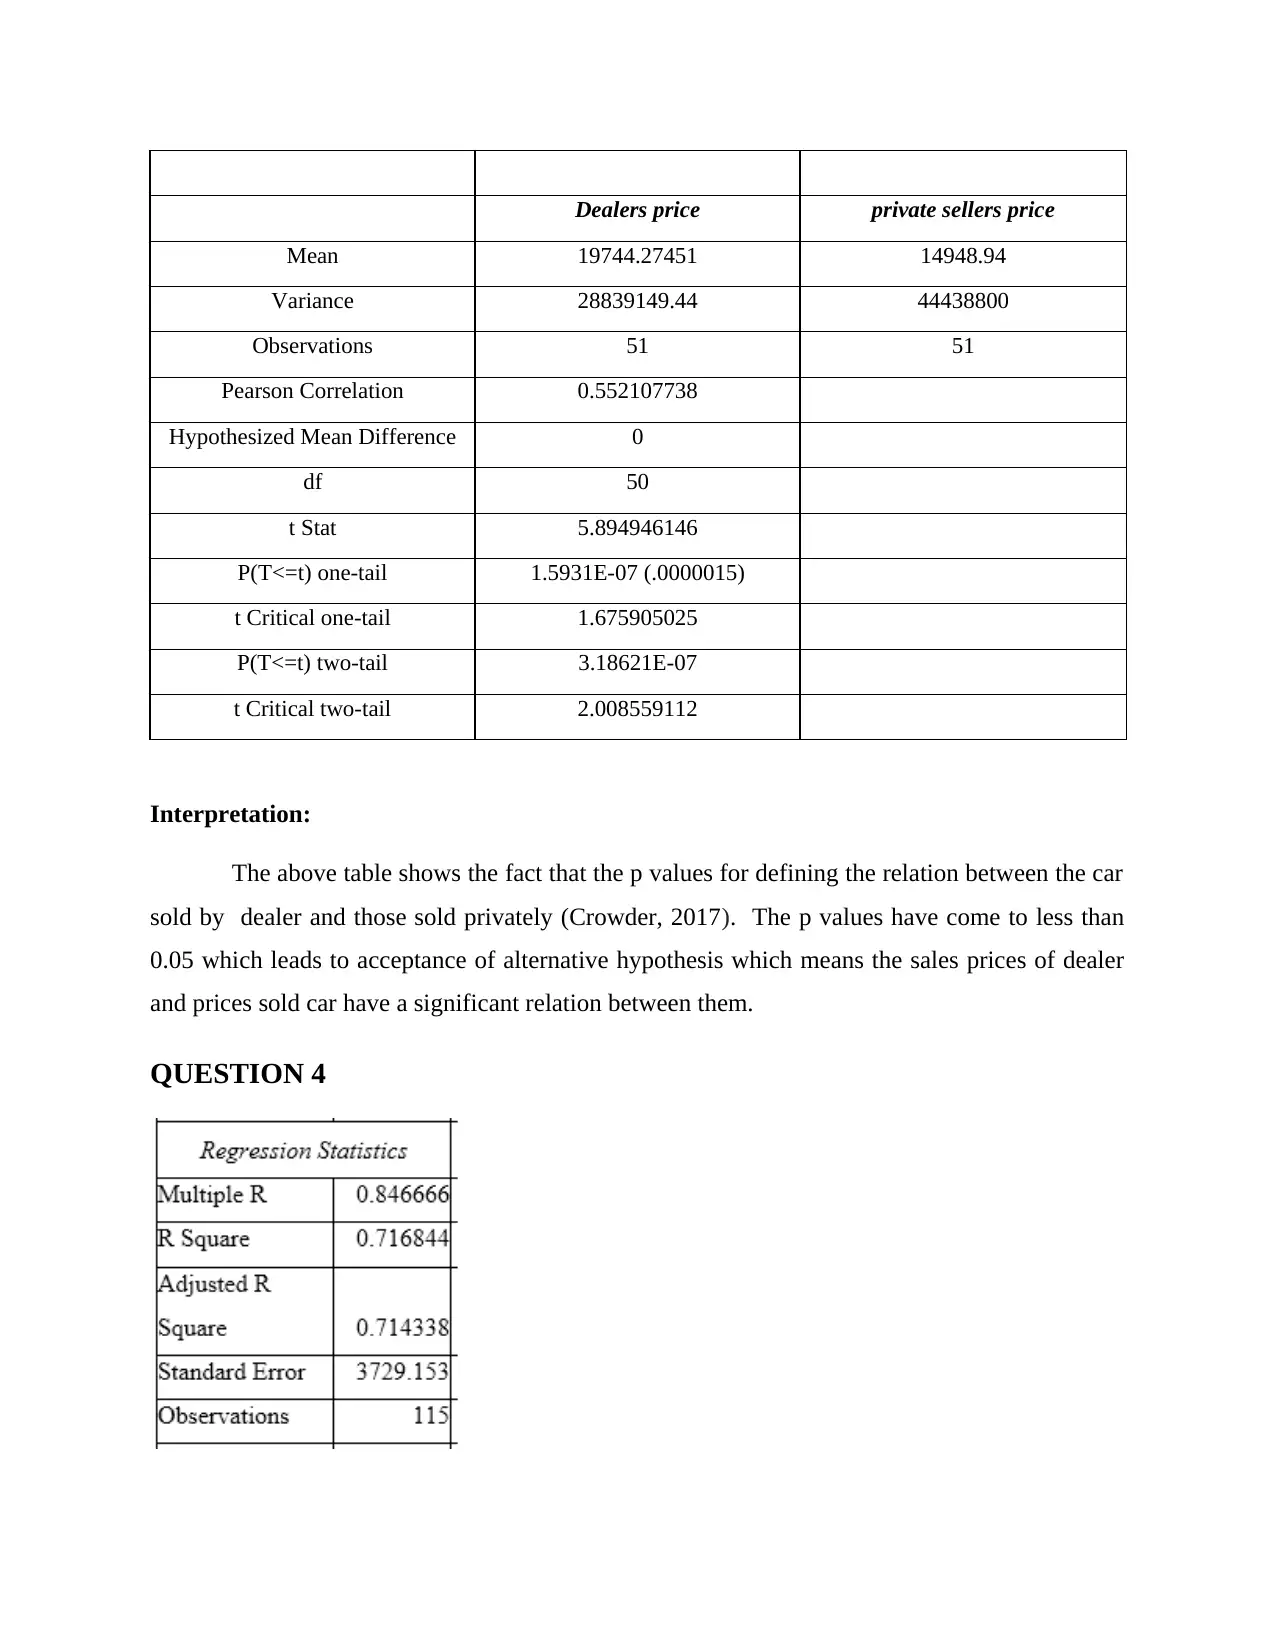
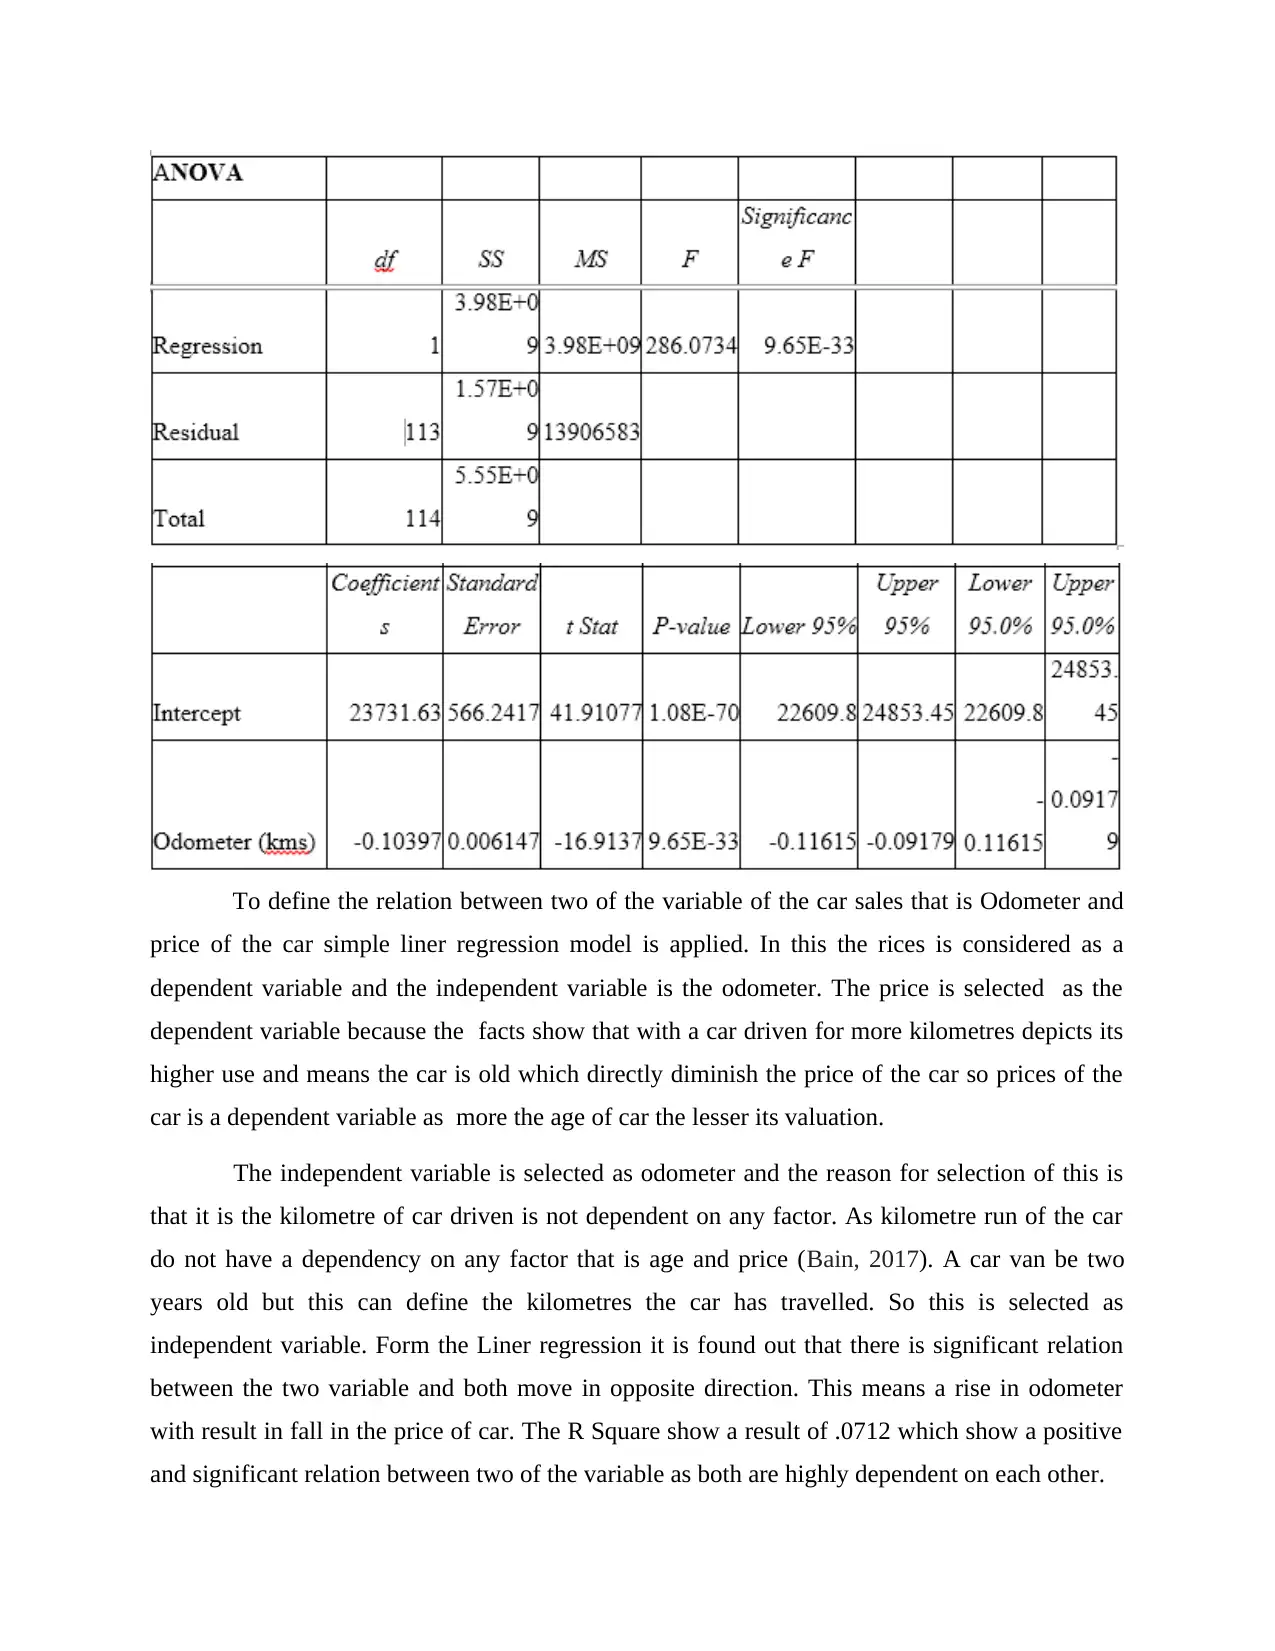
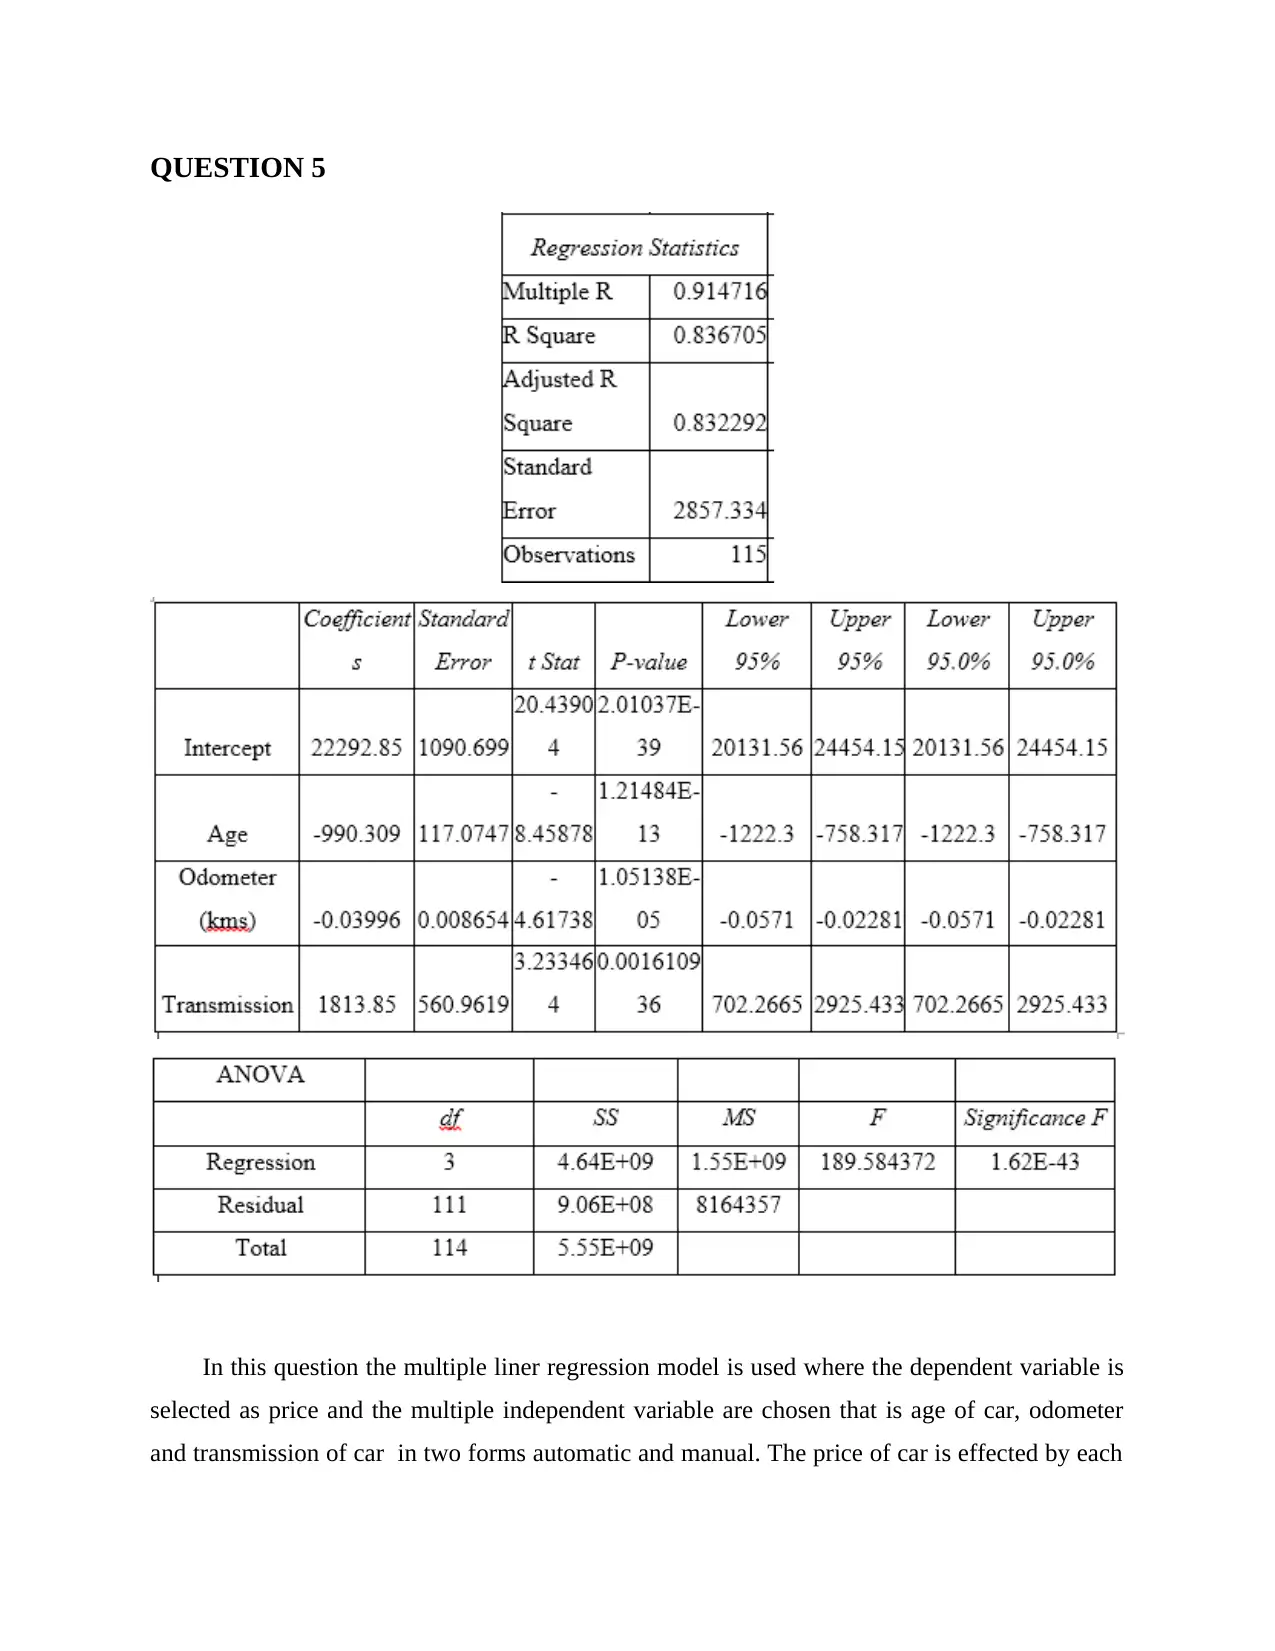
This report presents a statistical analysis of used car sales data. It begins with an analysis of average car prices over two years, considering car age. The report then examines the relationship between car color and consumer choice using a count and percentage table. A t-test is conducted to compare prices between car dealers and private sellers, with interpretation of the p-values. Furthermore, the report employs a simple linear regression model to analyze the relationship between odometer readings and car prices, and a multiple linear regression model to assess the impact of car age, odometer, and transmission type on car prices, with detailed interpretations of the results, including the p-values and R-squared values. The report concludes with a list of relevant references. This report is a valuable resource for anyone studying statistical analysis and its applications in the automotive industry.
Document Page
Statistical analysis
tabler-icon-diamond-filled.svg

Paraphrase This Document

Need a fresh take? Get an instant paraphrase of this document with our AI Paraphraser
Document Page
Table of Contents
TASK 2.......................................................................................................................................................3
QUESTION 1..............................................................................................................................................3
QUESTION 2..............................................................................................................................................3
QUESTION 3..............................................................................................................................................3
QUESTION 4..............................................................................................................................................4
QUESTION 5..............................................................................................................................................5
REFERENCES............................................................................................................................................6
Document Page
TASK 2
QUESTION 1
In this question average price of the used car Oz is determined for years 2016 and 2017.
The relation between the age and the price of the car can be stated that it ranged from 14000 to
27000. The average prices of 2 and 3 years old cars sole in two years comes at $22,147, this
means a car which is used for either 2 years or 3 years will be sold at an average price of
$22,147. The least prices at which a car is sole in these 2 years is at 14990 and the highest prices
at which car is sold is 26990.
Year (2016 & 2017) Price`
Average $22,147
QUESTION 2
Row Labels
Count of
White Percentage
No 84 73.04%
Yes 31 26.96%
Grand
Total 115 100%
Interpretation:
The above table shows the that the whites cars sold out of total sample of 115 cars.
This table shows the fact that out of 115 car only 31 car were white which constitute a
percentage of 26.96 of total cars sold (Little and Rubin, 2019). There is no limit and restriction
of the choice of the consumers regarding the colour of the car. The consumers do not purchased
the car with respect to the colour of the car there is a negative relation between the white colour
of the car and choice of the consumers for purchasing the car.
QUESTION 3
t-Test: Paired Two Sample for Means
Document Page
Dealers price private sellers price
Mean 19744.27451 14948.94
Variance 28839149.44 44438800
Observations 51 51
Pearson Correlation 0.552107738
Hypothesized Mean Difference 0
df 50
t Stat 5.894946146
P(T<=t) one-tail 1.5931E-07 (.0000015)
t Critical one-tail 1.675905025
P(T<=t) two-tail 3.18621E-07
t Critical two-tail 2.008559112
Interpretation:
The above table shows the fact that the p values for defining the relation between the car
sold by dealer and those sold privately (Crowder, 2017). The p values have come to less than
0.05 which leads to acceptance of alternative hypothesis which means the sales prices of dealer
and prices sold car have a significant relation between them.
QUESTION 4
tabler-icon-diamond-filled.svg

Paraphrase This Document

Need a fresh take? Get an instant paraphrase of this document with our AI Paraphraser
Document Page
To define the relation between two of the variable of the car sales that is Odometer and
price of the car simple liner regression model is applied. In this the rices is considered as a
dependent variable and the independent variable is the odometer. The price is selected as the
dependent variable because the facts show that with a car driven for more kilometres depicts its
higher use and means the car is old which directly diminish the price of the car so prices of the
car is a dependent variable as more the age of car the lesser its valuation.
The independent variable is selected as odometer and the reason for selection of this is
that it is the kilometre of car driven is not dependent on any factor. As kilometre run of the car
do not have a dependency on any factor that is age and price (Bain, 2017). A car van be two
years old but this can define the kilometres the car has travelled. So this is selected as
independent variable. Form the Liner regression it is found out that there is significant relation
between the two variable and both move in opposite direction. This means a rise in odometer
with result in fall in the price of car. The R Square show a result of .0712 which show a positive
and significant relation between two of the variable as both are highly dependent on each other.
Document Page
QUESTION 5
In this question the multiple liner regression model is used where the dependent variable is
selected as price and the multiple independent variable are chosen that is age of car, odometer
and transmission of car in two forms automatic and manual. The price of car is effected by each
Document Page
three factors so it is taken as dependent. The age, odometer and transmission do not any interlink
among them elves and do not get effected by any changes in dependent and other independent
factors. So all three are chosen as independent variable for calculation.
Anova table shows a regression value of 1.62 respectively. The p value of odometer comes
at 1.05 which is more than 0.05 and this lead to acceptance of null hypothesis. This depicts that
there is no significance relation between the odometer and prices of the car (Varmuza and
Filzmoser, 2016). The p value of transmission have comes as 0.0016 which is less than 0.05
which results in acceptance of alternative hypothesis showing the fact that there is a significant
relation between transmission and price of the car.
tabler-icon-diamond-filled.svg

Paraphrase This Document

Need a fresh take? Get an instant paraphrase of this document with our AI Paraphraser
Document Page
REFERENCES
Books and Journals
Little, R. J. and Rubin, D. B., 2019. Statistical analysis with missing data (Vol. 793). Wiley.
Crowder, M. J., 2017. Statistical analysis of reliability data. Routledge.
Bain, L., 2017. Statistical analysis of reliability and life-testing models: theory and methods.
Routledge.
Varmuza, K. and Filzmoser, P., 2016. Introduction to multivariate statistical analysis in
chemometrics. CRC press.
chevron_up_icon
1 out of 8
circle_padding
hide_on_mobile
zoom_out_icon
[object Object]