Statistical Analysis of Car Prices: Trends and Insights (2017)

Verified

Added on  2020/04/13

|6
|599
|41
Homework Assignment
AI Summary
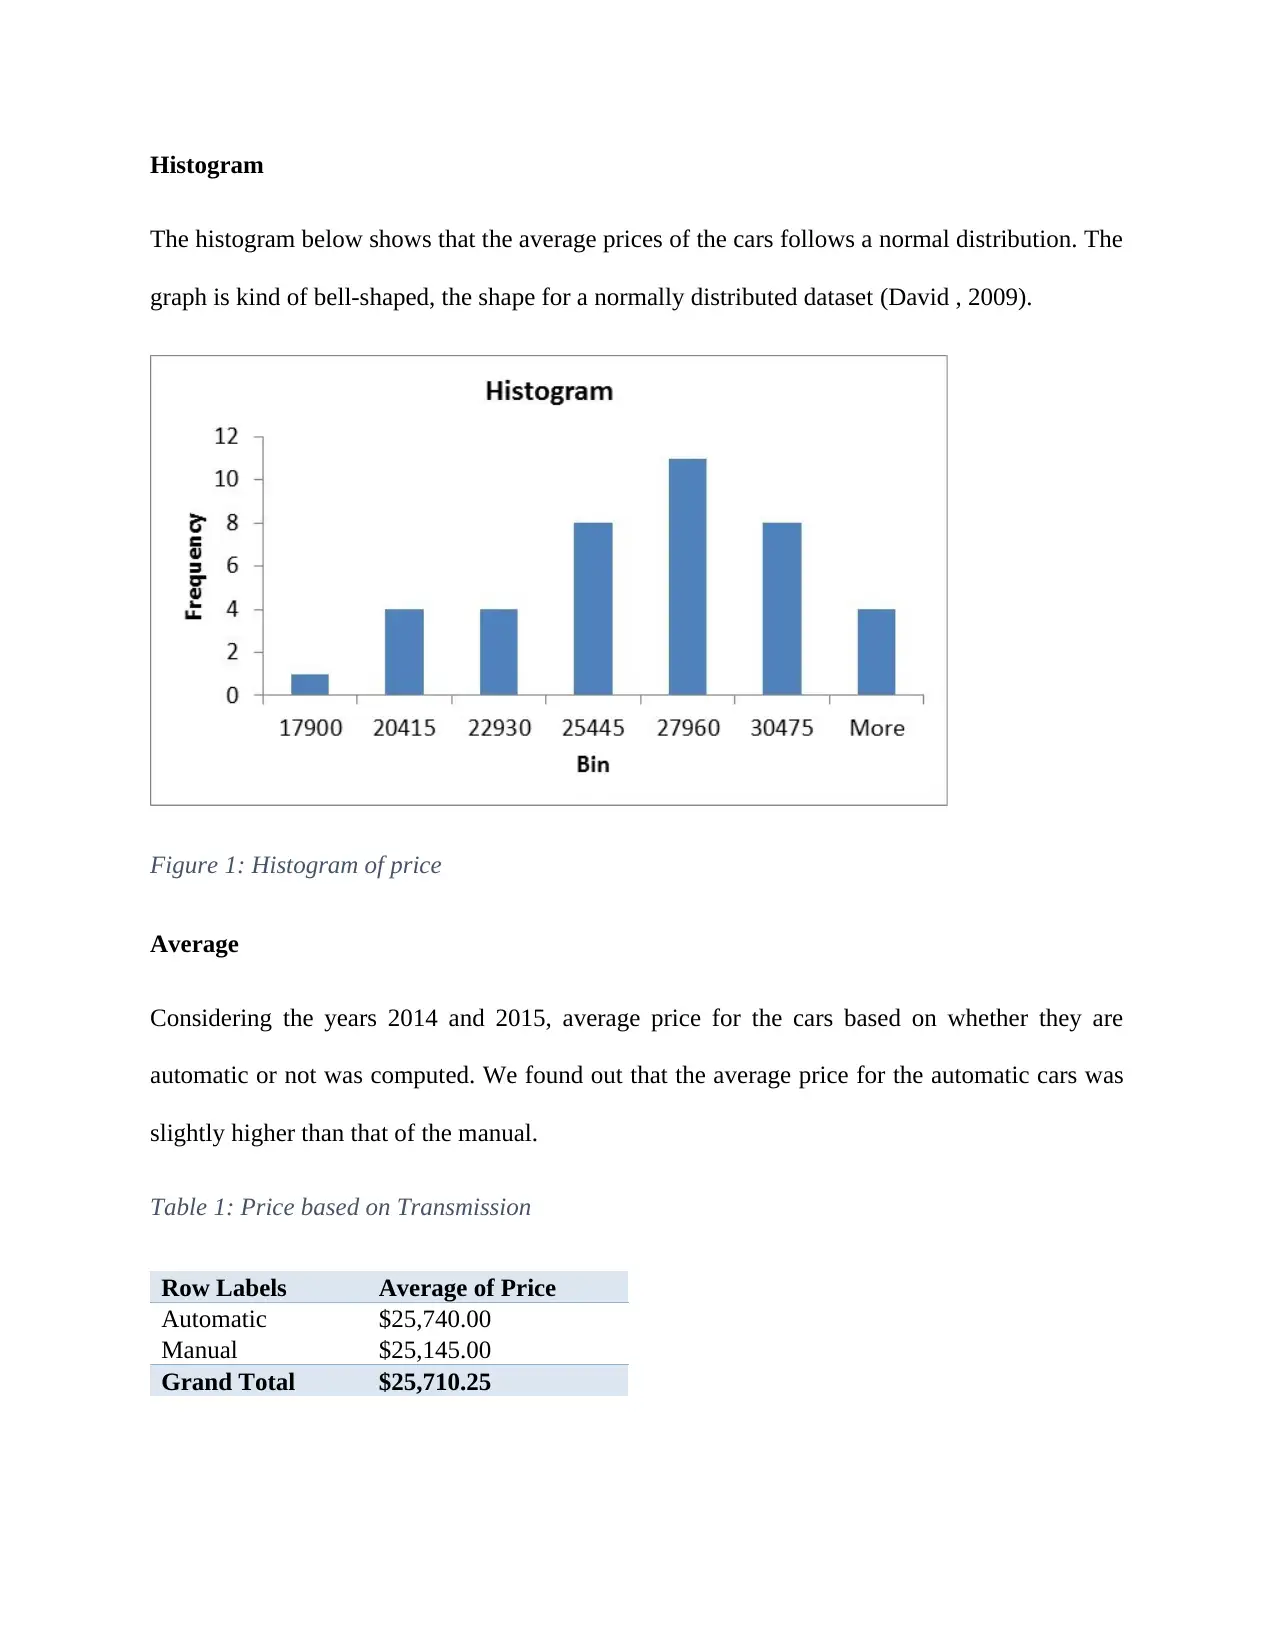
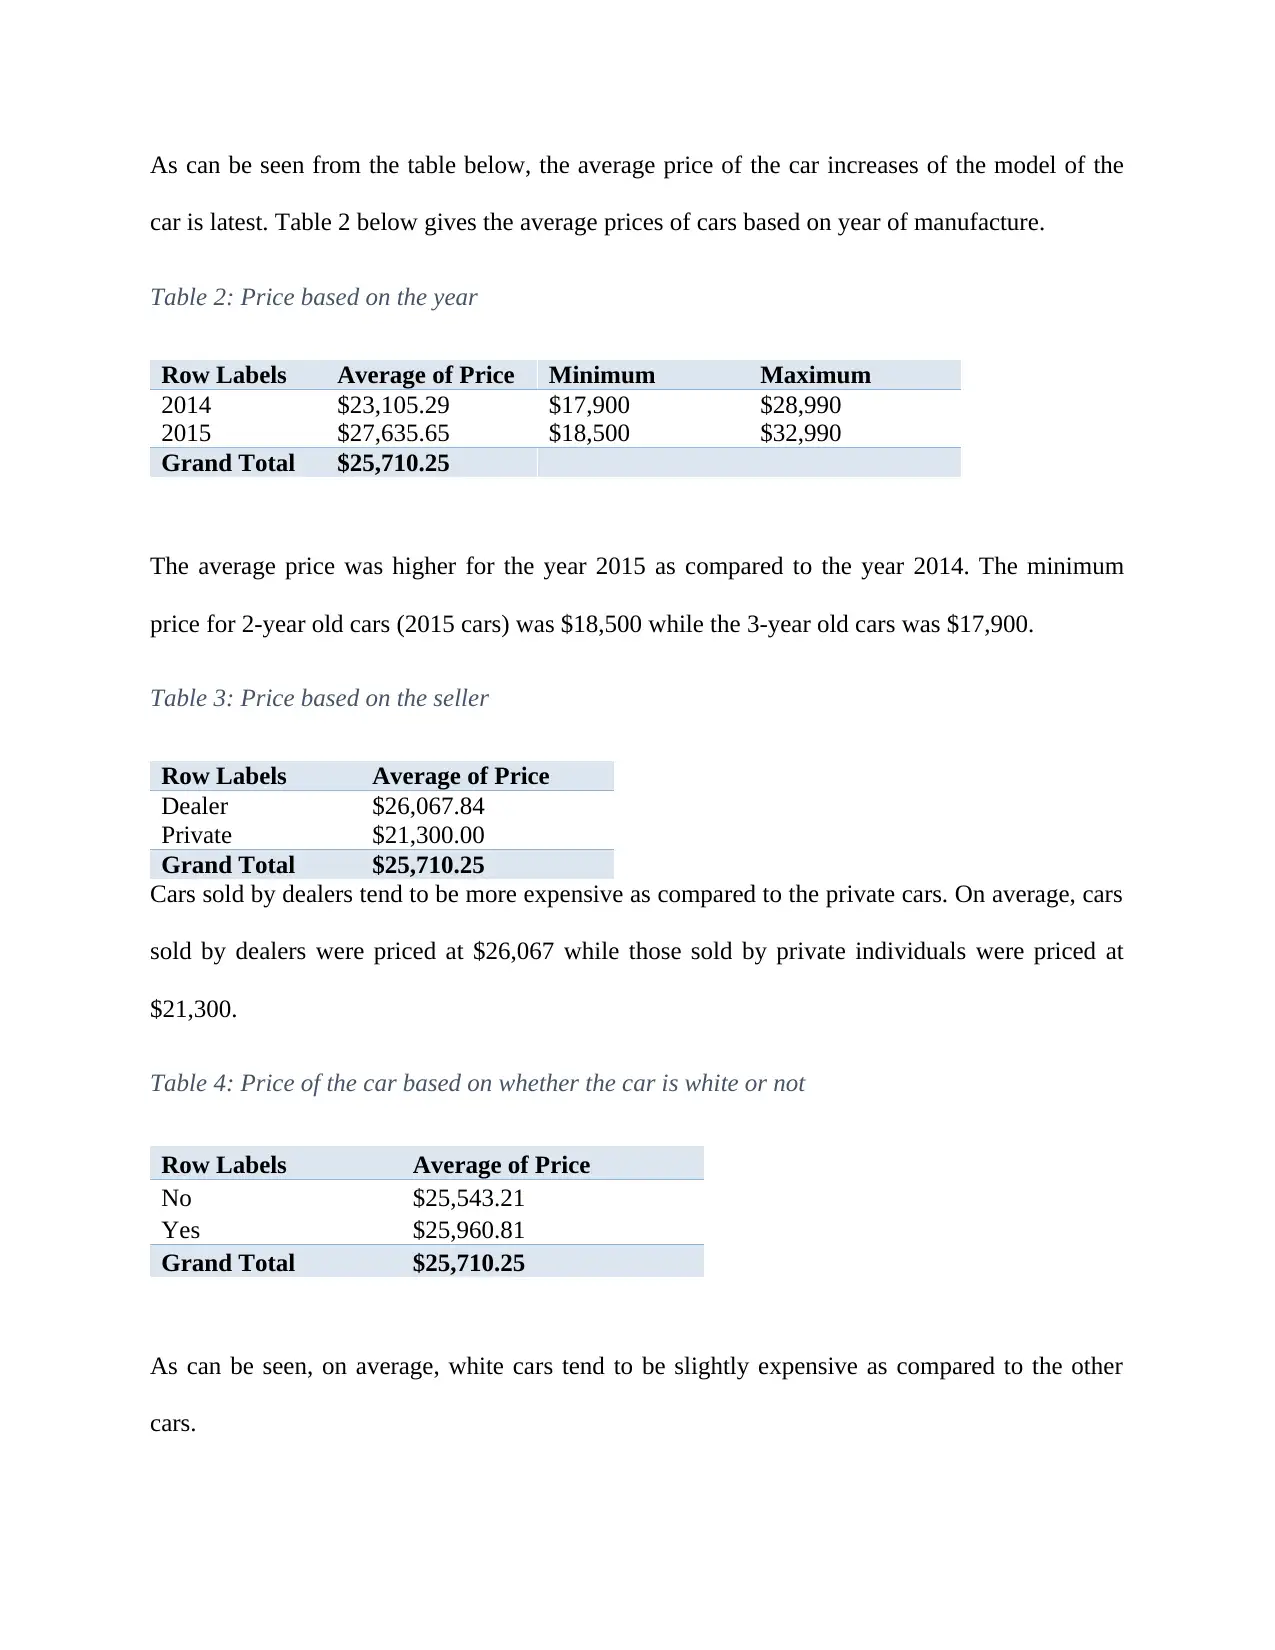
This assignment presents a statistical analysis of car prices, examining the influence of factors such as odometer readings, year of manufacture, and transmission type. The analysis utilizes a histogram to demonstrate the normal distribution of car prices and tables to compare average prices based on transmission (automatic vs. manual), year (2014 vs. 2015), and seller type (dealer vs. private). A scatter plot illustrates the negative correlation between odometer readings and car prices. The assignment concludes with an email to a potential buyer, providing recommendations based on the statistical findings, suggesting considerations for saving money by opting for older (3-year-old) or manual transmission vehicles. This document is available on Desklib, a platform offering a wide range of study tools and solved assignments for students.
tabler-icon-diamond-filled.svg

Contribute Materials

Your contribution can guide someone’s learning journey. Share your documents today.
Document Page
Statistics
Student Name:
Student ID:
Course:
Date: 26th November 2017
tabler-icon-diamond-filled.svg

Secure Best Marks with AI Grader

Need help grading? Try our AI Grader for instant feedback on your assignments.
Document Page
Histogram
The histogram below shows that the average prices of the cars follows a normal distribution. The
graph is kind of bell-shaped, the shape for a normally distributed dataset (David , 2009).
Figure 1: Histogram of price
Average
Considering the years 2014 and 2015, average price for the cars based on whether they are
automatic or not was computed. We found out that the average price for the automatic cars was
slightly higher than that of the manual.
Table 1: Price based on Transmission
Row Labels Average of Price
Automatic $25,740.00
Manual $25,145.00
Grand Total $25,710.25
Document Page
As can be seen from the table below, the average price of the car increases of the model of the
car is latest. Table 2 below gives the average prices of cars based on year of manufacture.
Table 2: Price based on the year
Row Labels Average of Price Minimum Maximum
2014 $23,105.29 $17,900 $28,990
2015 $27,635.65 $18,500 $32,990
Grand Total $25,710.25
The average price was higher for the year 2015 as compared to the year 2014. The minimum
price for 2-year old cars (2015 cars) was $18,500 while the 3-year old cars was $17,900.
Table 3: Price based on the seller
Row Labels Average of Price
Dealer $26,067.84
Private $21,300.00
Grand Total $25,710.25
Cars sold by dealers tend to be more expensive as compared to the private cars. On average, cars
sold by dealers were priced at $26,067 while those sold by private individuals were priced at
$21,300.
Table 4: Price of the car based on whether the car is white or not
Row Labels Average of Price
No $25,543.21
Yes $25,960.81
Grand Total $25,710.25
As can be seen, on average, white cars tend to be slightly expensive as compared to the other
cars.
Document Page
Relationship between odometer and price
We sought to understand the relationship between odometer and the price. We plotted a scatter
plot which showed that there exists a negative relationship between the two variables. An
increase in the odometer results to a decrease in the price of the car.
Figure 2: Scatter plot of price and odometer
Email to the intended buyer
Dear Madam,
Based on the analysis of the data the prices of vehicles for the 2-year old and 3-year old vehicles
I do present to you the analysis and further furnish you with the recommendations on the way
forward as you plan to purchase a car.
Based on the above results, it is evident that the 2-year old cars are expensive when compared to
the 3-year old cars. So, the buyer who is out to save might have to consider buying a 3-year old
tabler-icon-diamond-filled.svg

Secure Best Marks with AI Grader

Need help grading? Try our AI Grader for instant feedback on your assignments.
Document Page
car instead of a 2-year old. The automatic cars were also found to be expensive compared to the
manual cars for the 2-year old and 3-year old cars. So the buyer should consider purchasing
manual car instead of automatic.
Yours Faithfully,
Name
Document Page
References
Babbie, E. R., 2009. The Practice of Social Research. p. 436–440.
David , W. S., 2009. Averaged shifted histogram. Wiley Interdisciplinary Reviews:
Computational Statistics, p. 160–164.
Nick, T. G., 2007. Descriptive Statistics.
chevron_up_icon
1 out of 6
circle_padding
hide_on_mobile
zoom_out_icon
logo.png

Your All-in-One AI-Powered Toolkit for Academic Success.

Available 24*7 on WhatsApp / Email

[object Object]