University Statistics Project: Traumatic Construction Deaths Analysis
VerifiedAdded on 2023/04/21
|12
|2119
|91
Project
AI Summary
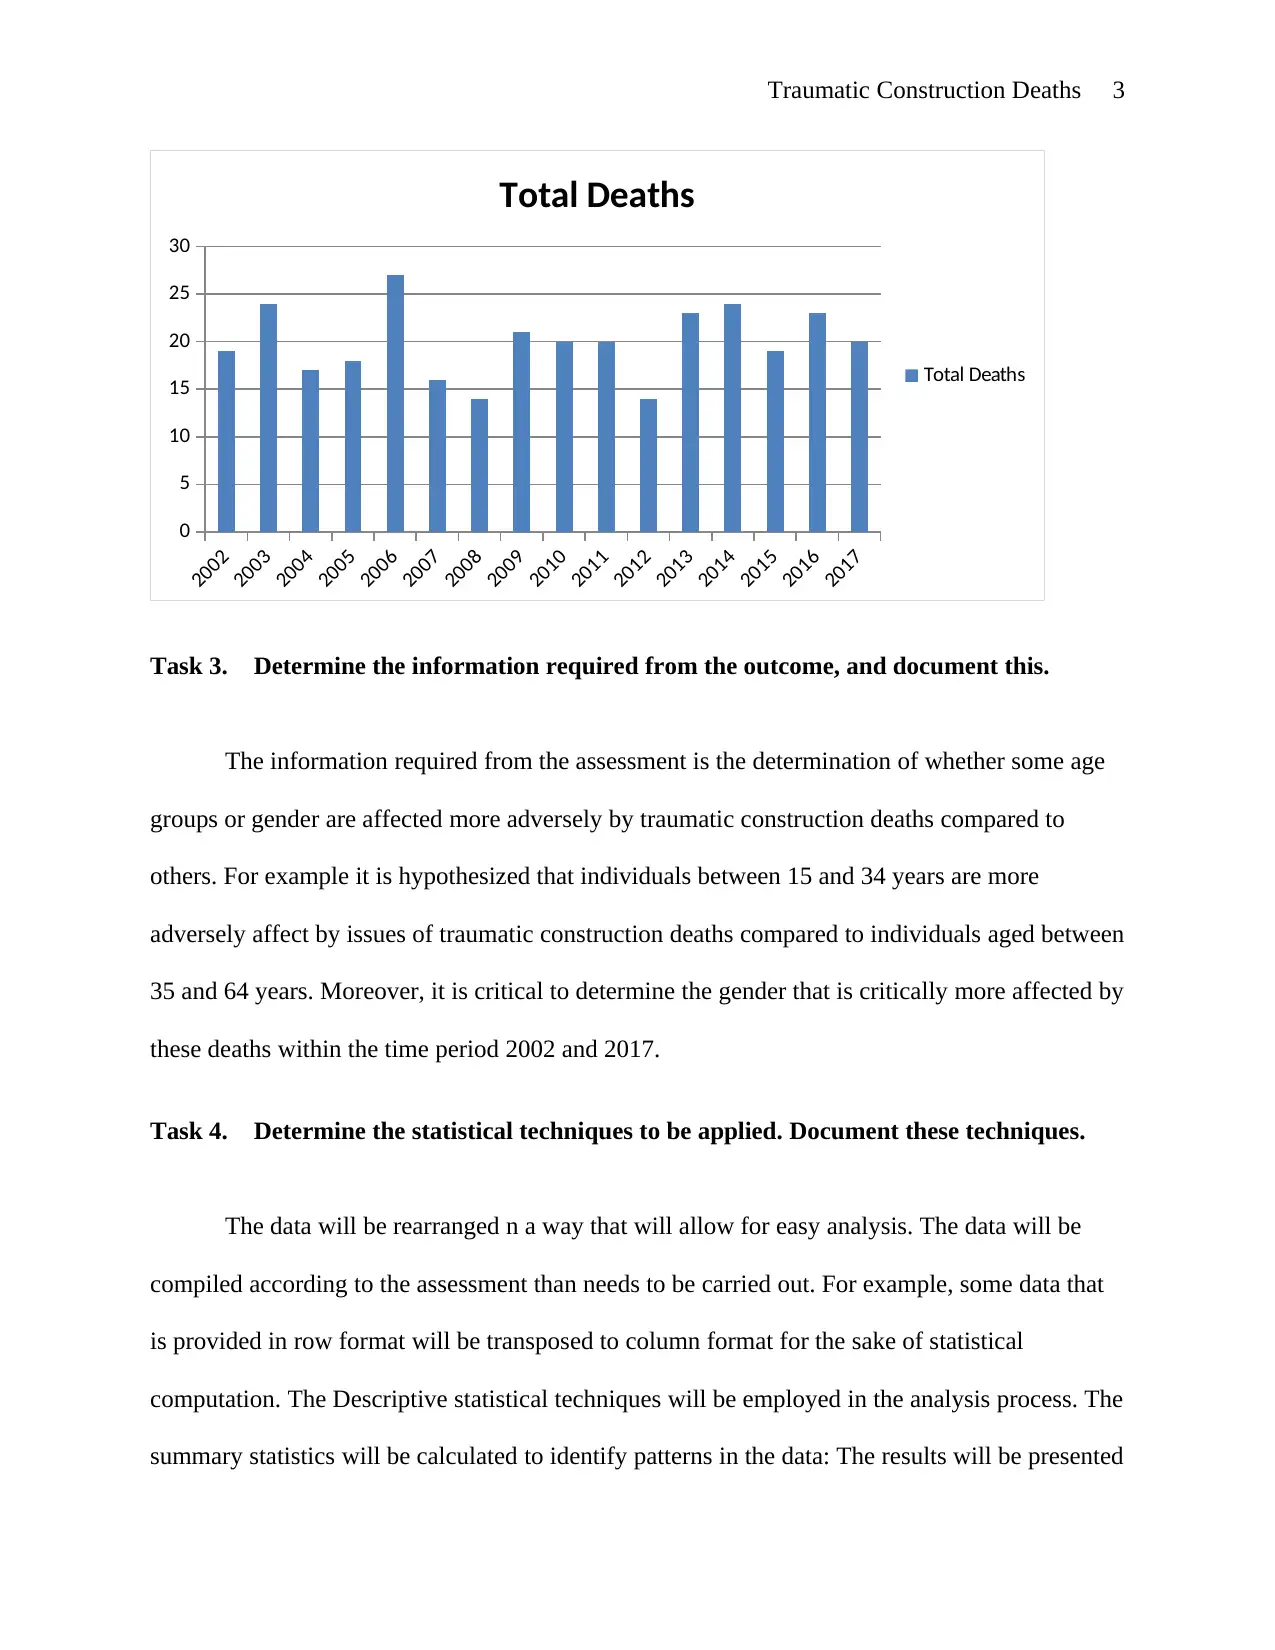
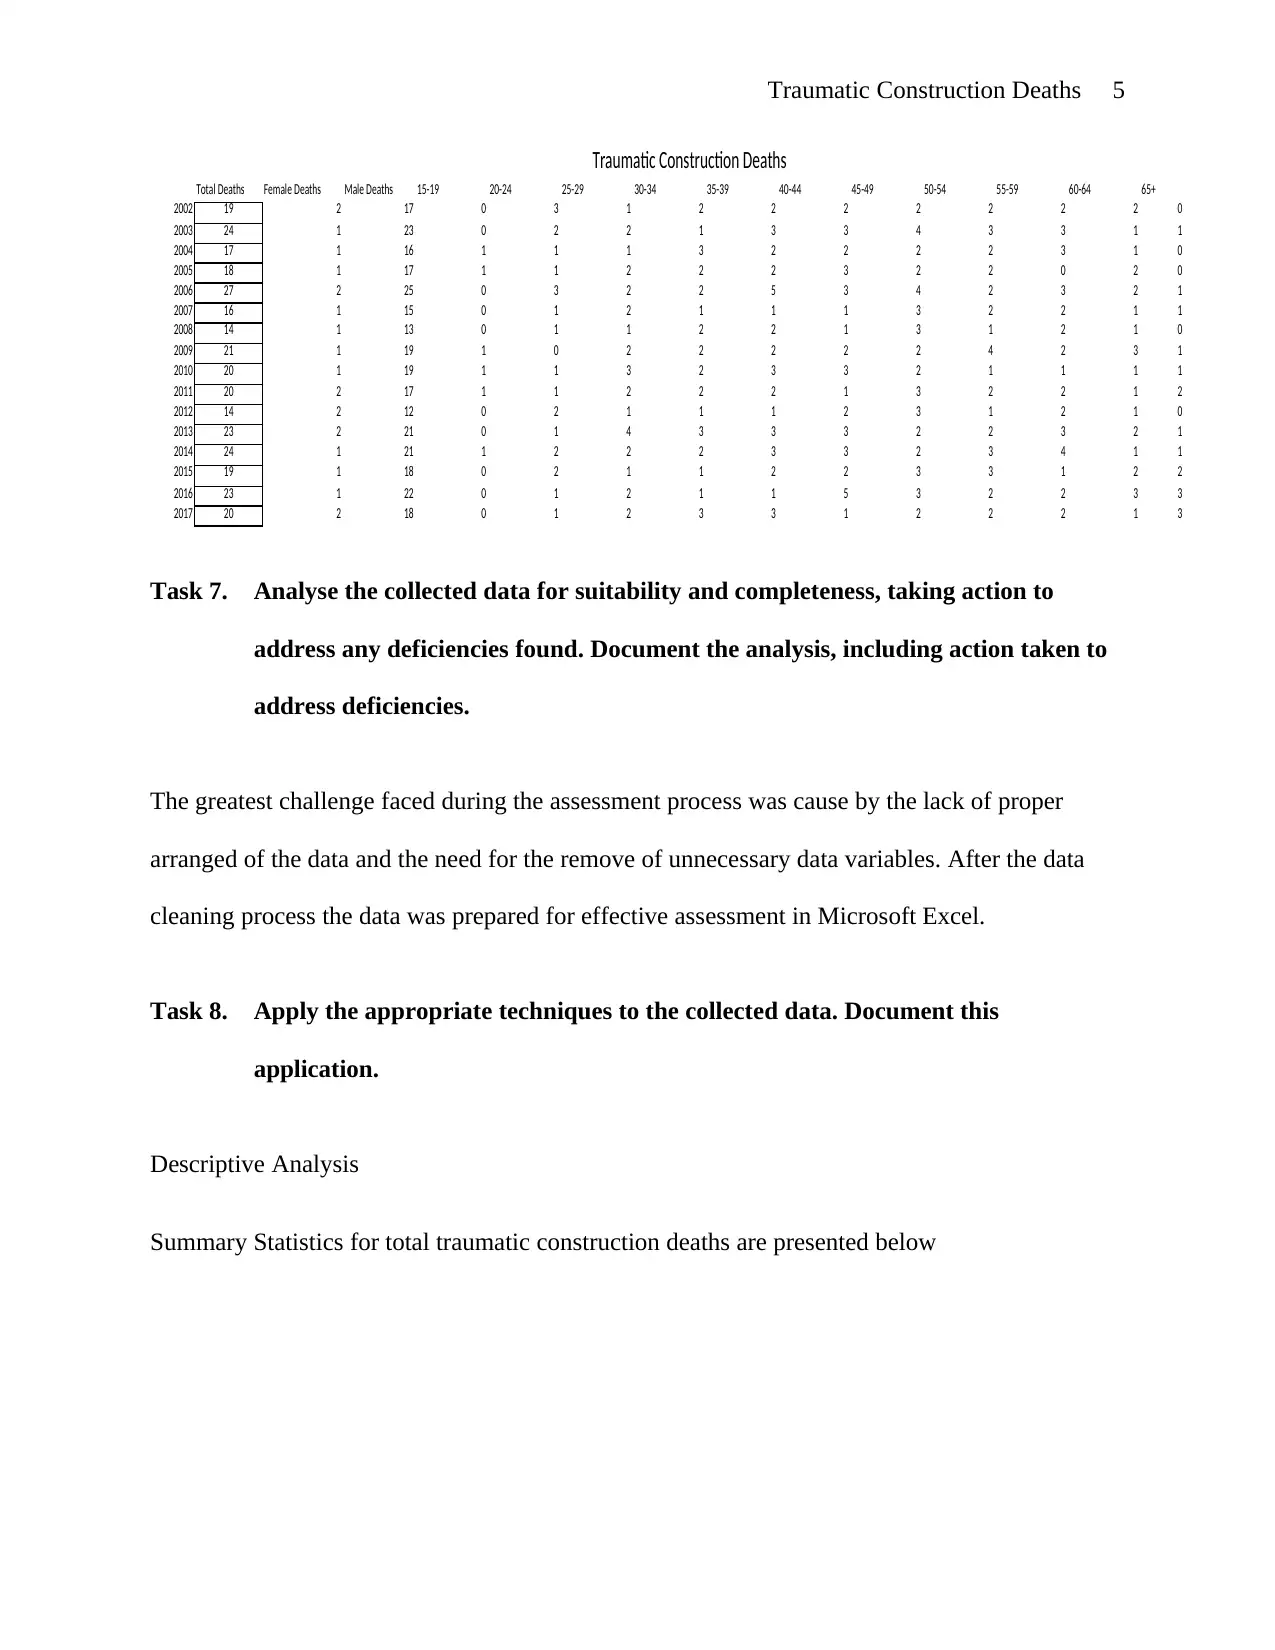
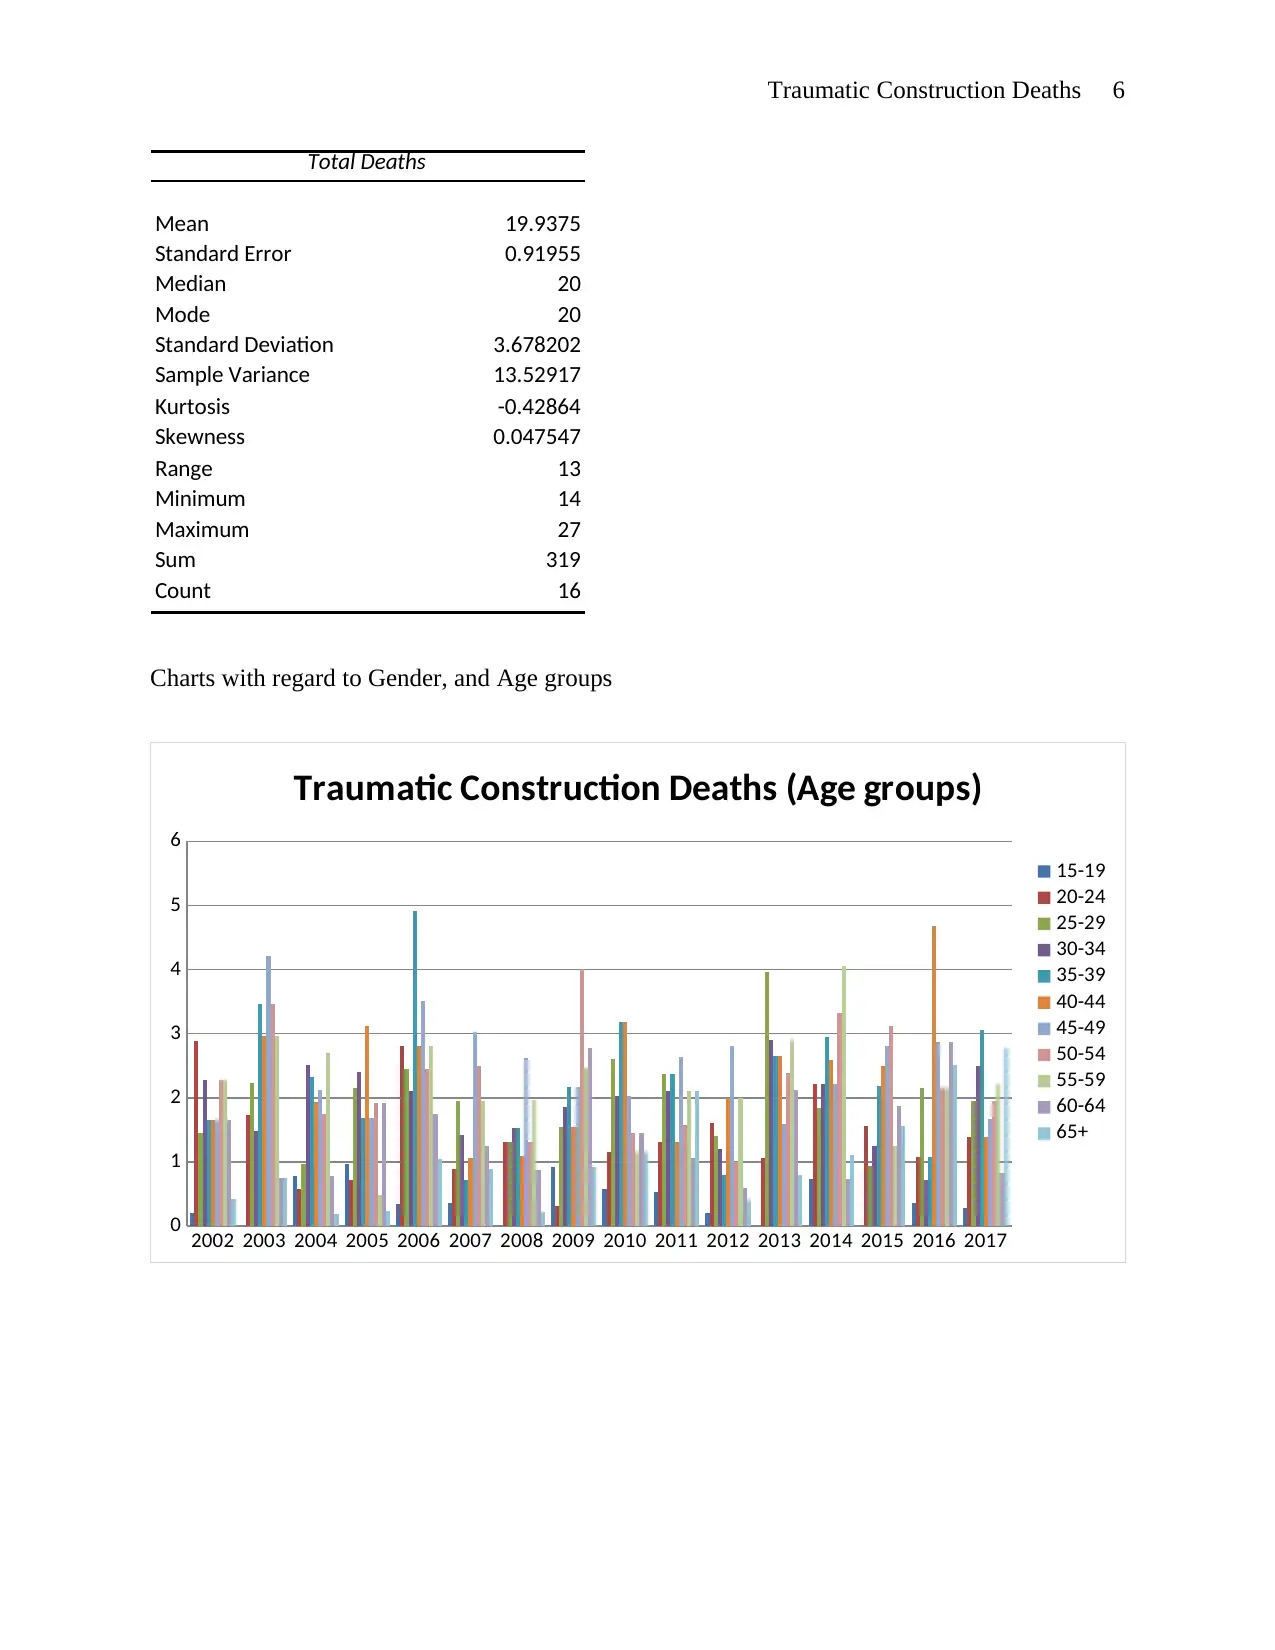
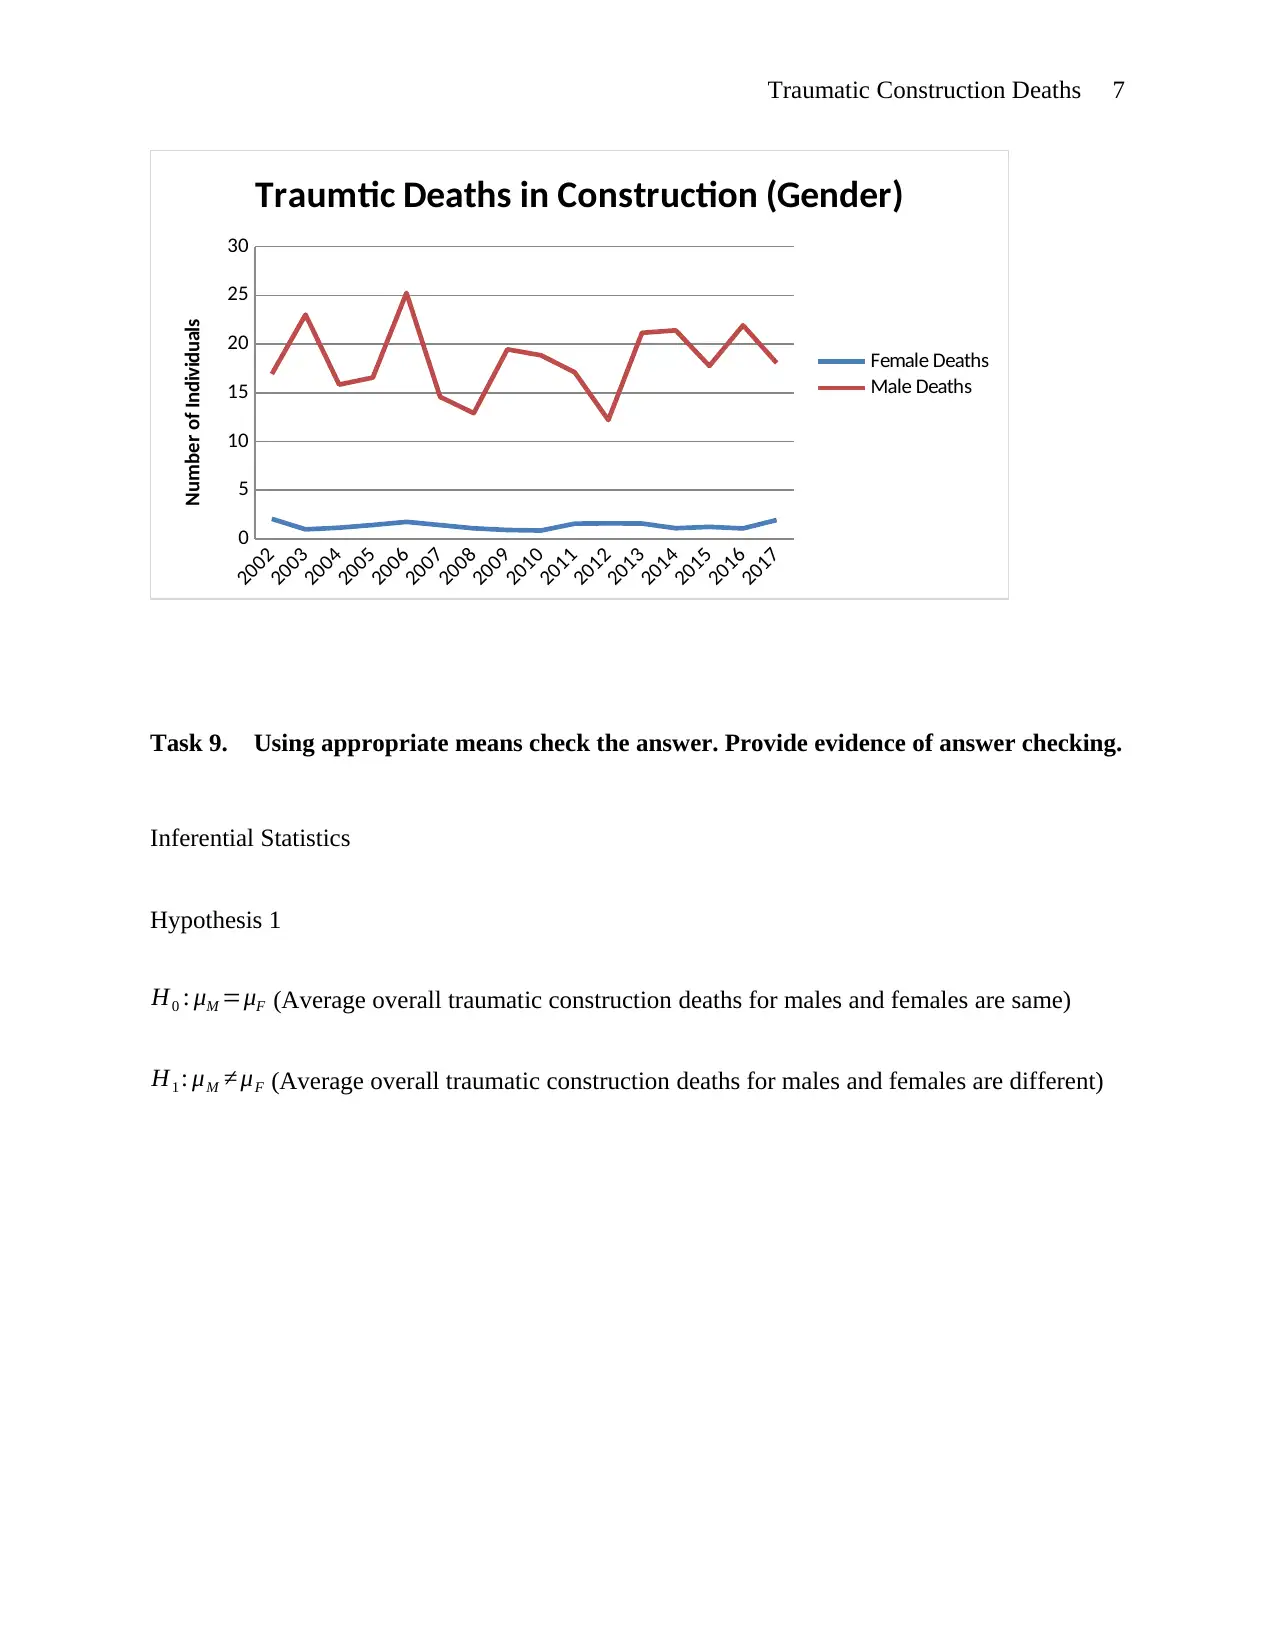
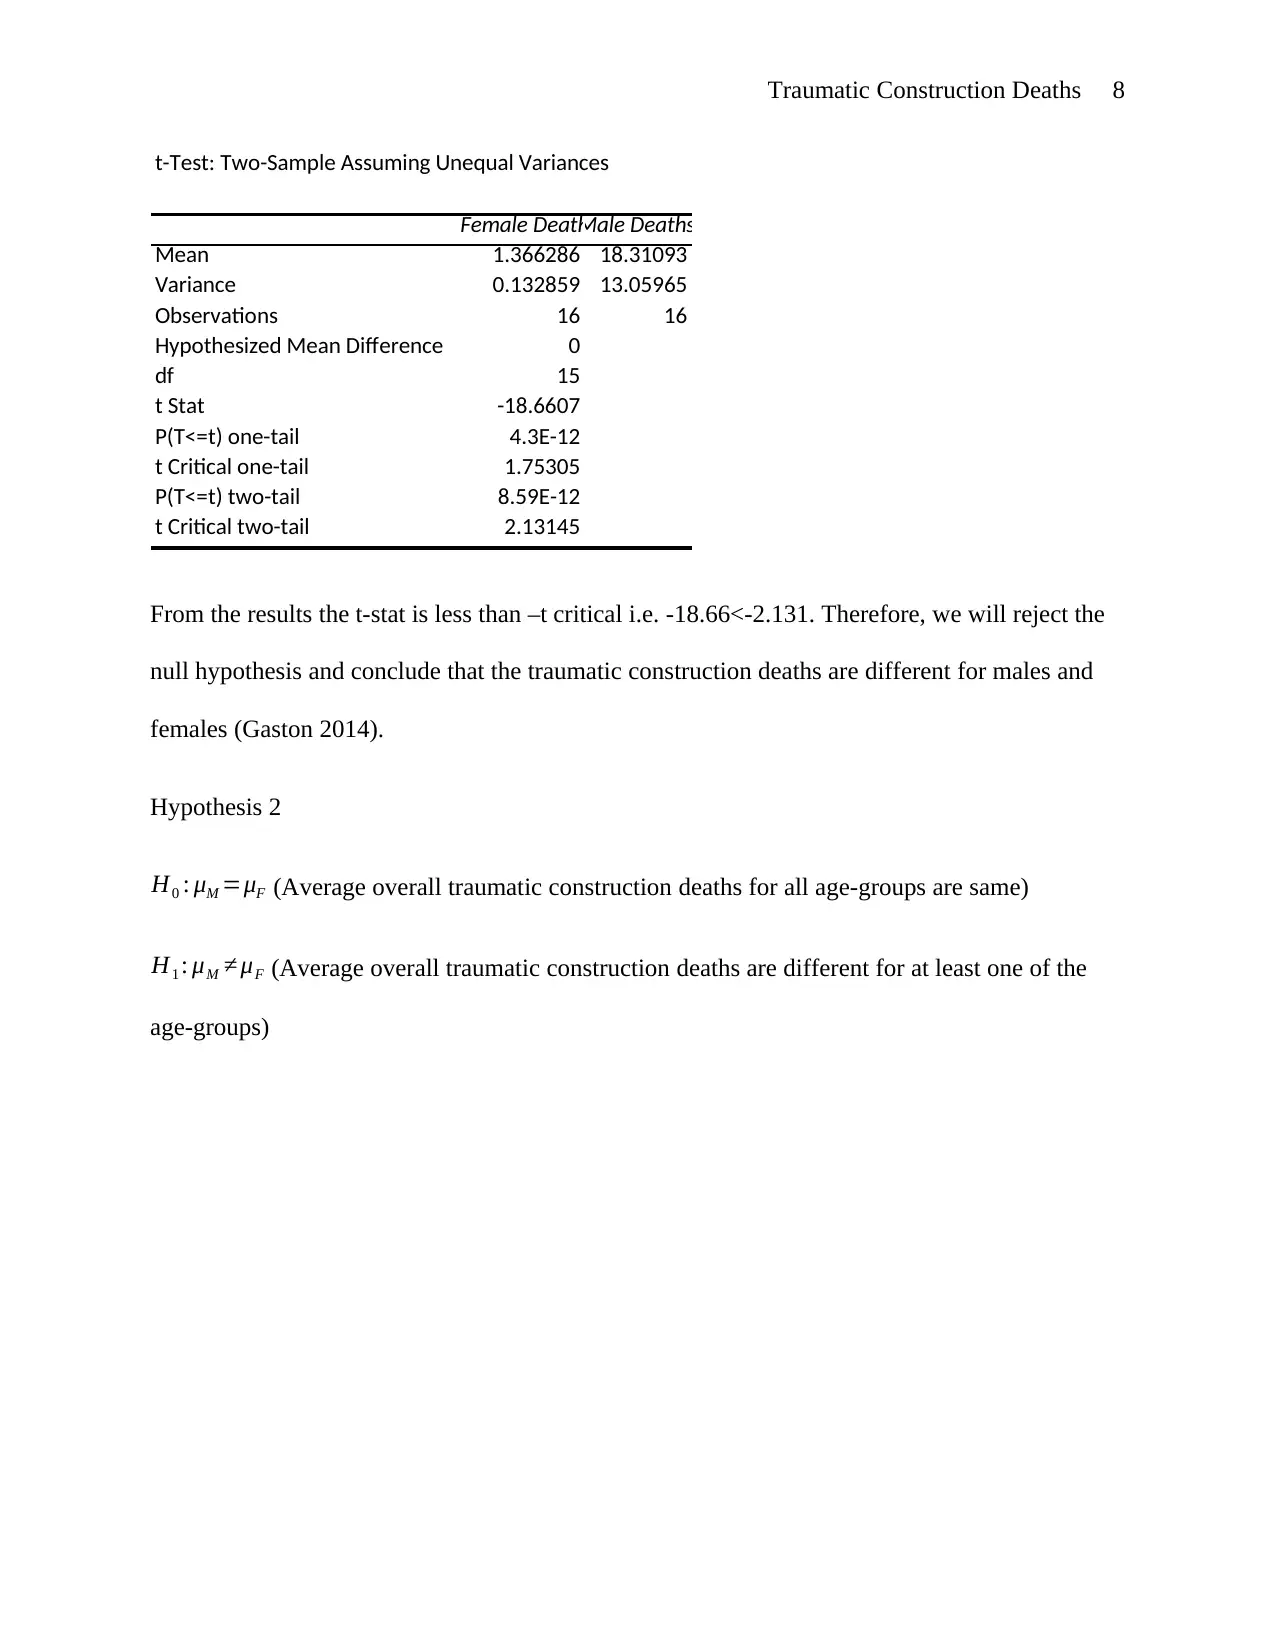
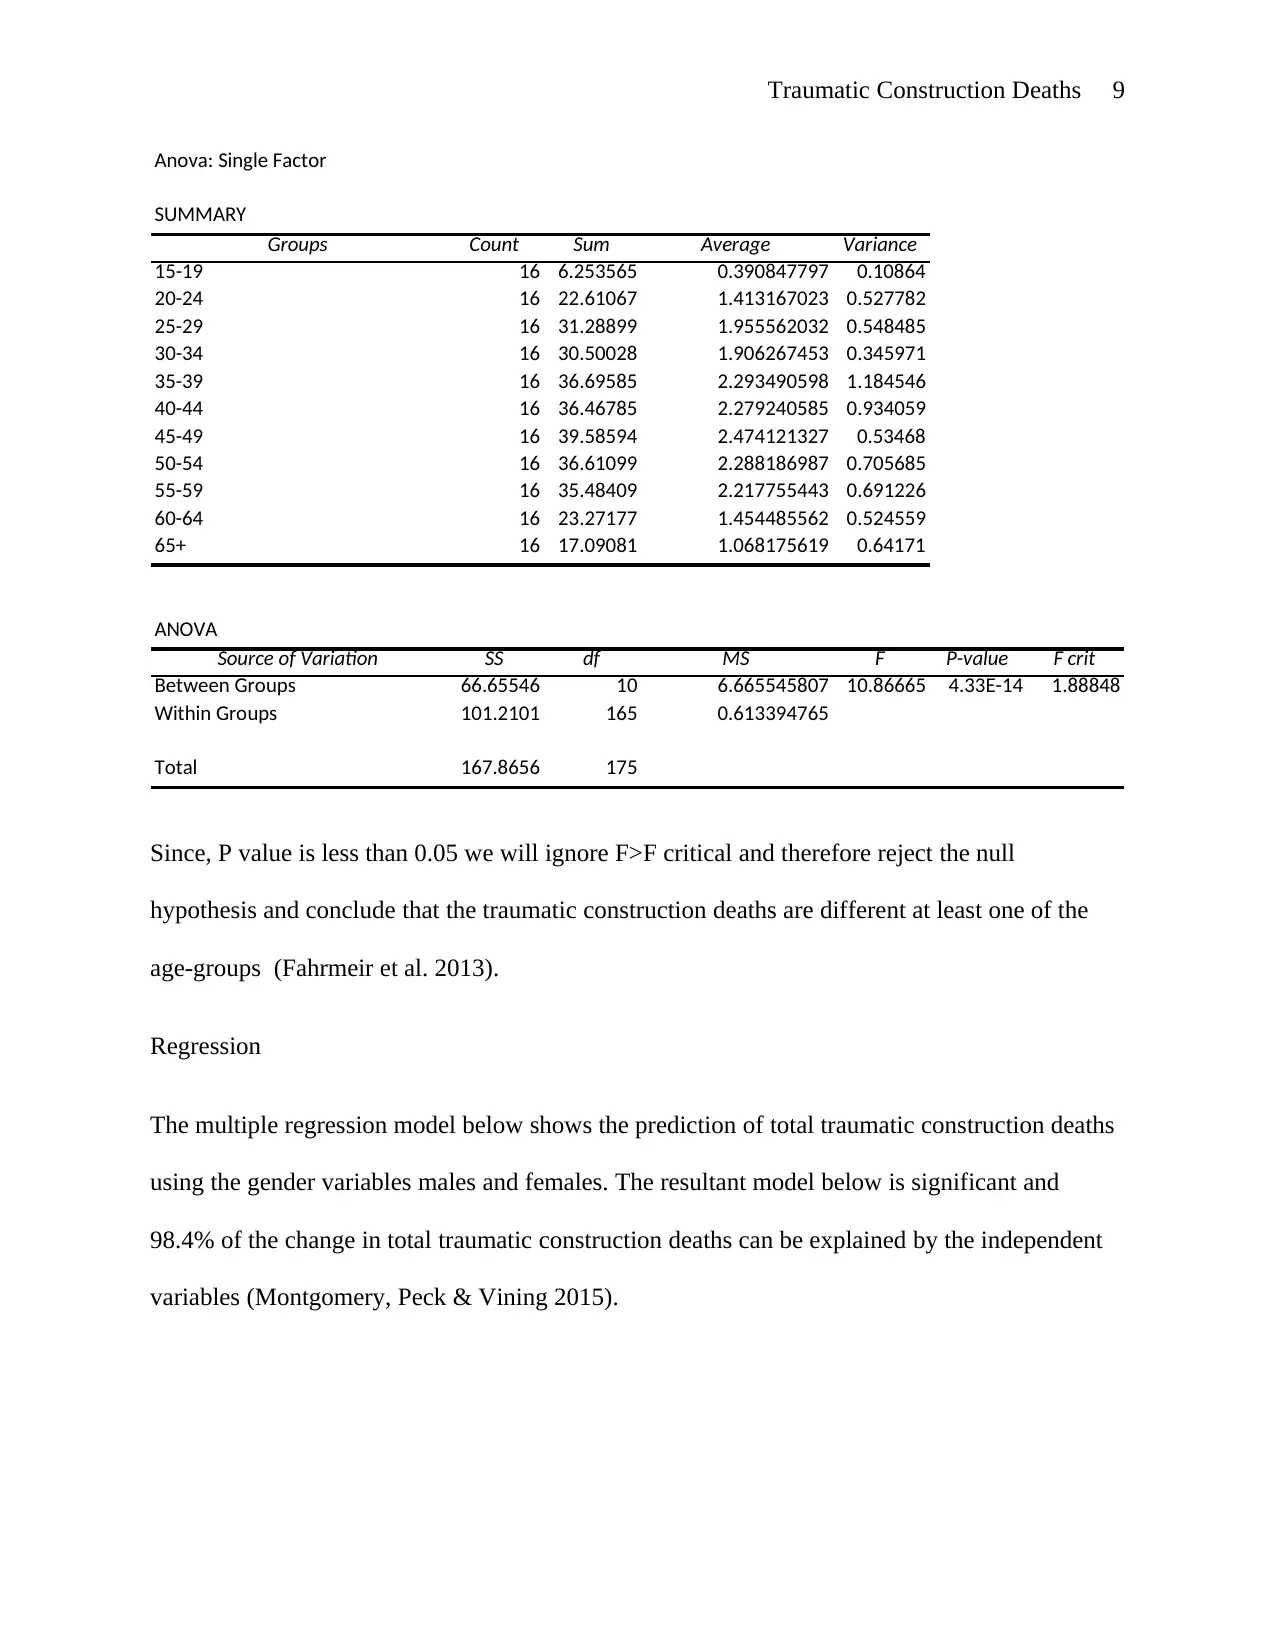
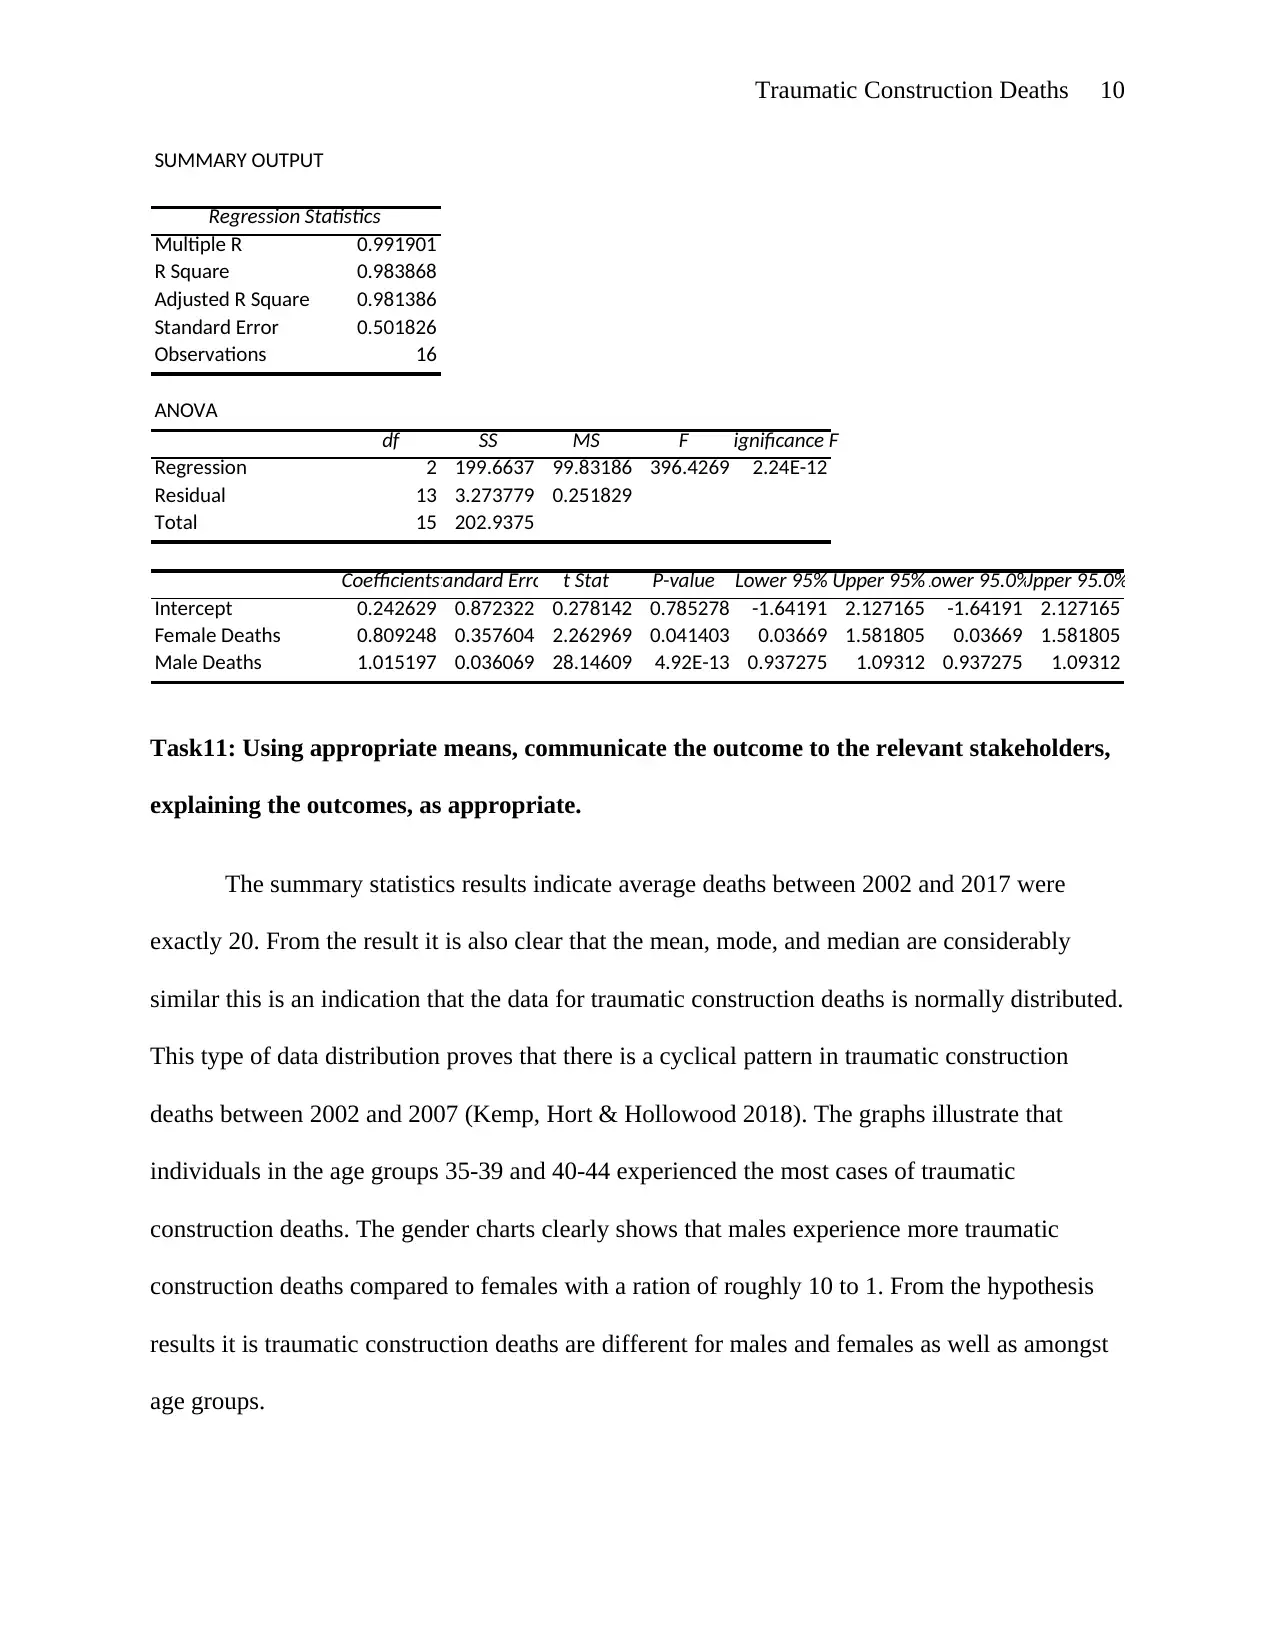
This project conducts a statistical analysis of traumatic construction deaths, focusing on data from the Canadian Workplace Safety and Insurance Board (WSIB) between 2002 and 2017. The analysis aims to identify patterns, trends, and risk factors related to age, gender, and the overall frequency of traumatic deaths in the construction industry. The project encompasses several key steps: problem identification and definition, data collection and preparation, descriptive and inferential statistical techniques, and the application of Microsoft Excel for data analysis. Descriptive statistics are used to summarize the data, while inferential statistics, including t-tests, ANOVA, and regression analysis, are employed to test hypotheses. The findings reveal that traumatic construction deaths are not evenly distributed across age groups and gender, with males and individuals aged 35-45 experiencing higher incidents. The project concludes by communicating the outcomes to stakeholders, highlighting the need for targeted safety interventions and further research to mitigate construction-related fatalities.

Traumatic Construction Deaths 1
TRAUMATIC CONSTRUCTION DEATHS
By (Name)
The Name of the Class (Course)
Professor (Tutor)
The Name of the School (University)
The City and State where it is located
The Date
TRAUMATIC CONSTRUCTION DEATHS
By (Name)
The Name of the Class (Course)
Professor (Tutor)
The Name of the School (University)
The City and State where it is located
The Date
Paraphrase This Document
Need a fresh take? Get an instant paraphrase of this document with our AI Paraphraser

Traumatic Construction Deaths 2
Traumatic Construction Deaths
Task 1. Identify a problem requiring a statistical application, and define and
document this problem.
Traumatic construction deaths refer to loss of life in the field of civil engineering that is
caused by mentally disturbing phenomena like falling from the top of building or collapse of an
on-going bridge. The assessment of traumatic deaths occurrence in the construction industry can
be used as a measure of how effective work safety and health standards are in civil engineering.
Through the analysis of historical data we are able to identify which age groups are critically
affected by the problem and whether or not the numbers of traumatic deaths associated with
construction are on the raise. The data evaluation is meant to identify pitfalls and strengths in the
Canadian construction industry thereby highlighting possible improvement areas.
Task 2. Determine, and record, the data currently available for analysis.
The dataset was compiled by WSIB and retrieved from the Canadian Workplace Safety and
Insurance Board online data archive platform. The data examines traumatic construction deaths
with regard to gender, age groups, and industry. The data has records between 2002 and 2017.

Traumatic Construction Deaths 3
2002
2003
2004
2005
2006
2007
2008
2009
2010
2011
2012
2013
2014
2015
2016
2017
0
5
10
15
20
25
30
Total Deaths
Total Deaths
Task 3. Determine the information required from the outcome, and document this.
The information required from the assessment is the determination of whether some age
groups or gender are affected more adversely by traumatic construction deaths compared to
others. For example it is hypothesized that individuals between 15 and 34 years are more
adversely affect by issues of traumatic construction deaths compared to individuals aged between
35 and 64 years. Moreover, it is critical to determine the gender that is critically more affected by
these deaths within the time period 2002 and 2017.
Task 4. Determine the statistical techniques to be applied. Document these techniques.
The data will be rearranged n a way that will allow for easy analysis. The data will be
compiled according to the assessment than needs to be carried out. For example, some data that
is provided in row format will be transposed to column format for the sake of statistical
computation. The Descriptive statistical techniques will be employed in the analysis process. The
summary statistics will be calculated to identify patterns in the data: The results will be presented
⊘ This is a preview!⊘
Do you want full access?
Subscribe today to unlock all pages.

Trusted by 1+ million students worldwide

Traumatic Construction Deaths 4
in terms of frequency tables, line graphs, bar graphs, or pie charts. Inferential statistical
techniques will be utilized in the investigation of several hypotheses as well as regression
analysis to establish the relationship between gender (independent variables i.e. males and
females) and total traumatic deaths (dependent variables). For example, one hypothesis will
investigate whether all age groups are affected equally by traumatic construction deaths.
Task 5. Identify, and gain access to the appropriate computational devices.
For easy computation and presentation of results Microsoft Excel was used to evaluate the data.
Excel is a powerful statistical analysis tool because it supports the tabulation of summary
statistics, hypothesis testing, correlation assessment, and regression modeling. The graphs and
tables generated in excel are easy to read and interpret.
Task 6. Collect the required input data. Provide the data collected.
The overall data that was collected can be presented as follows without paying attention to age
groups and gender. The “Analysis and Charts” Excel worksheet contain the same data but it is
grouped with regard to age groups and gender.
Paraphrase This Document
Need a fresh take? Get an instant paraphrase of this document with our AI Paraphraser

Traumatic Construction Deaths 5
Total Deaths Female Deaths Male Deaths 15-19 20-24 25-29 30-34 35-39 40-44 45-49 50-54 55-59 60-64 65+
2002 19 2 17 0 3 1 2 2 2 2 2 2 2 0
2003 24 1 23 0 2 2 1 3 3 4 3 3 1 1
2004 17 1 16 1 1 1 3 2 2 2 2 3 1 0
2005 18 1 17 1 1 2 2 2 3 2 2 0 2 0
2006 27 2 25 0 3 2 2 5 3 4 2 3 2 1
2007 16 1 15 0 1 2 1 1 1 3 2 2 1 1
2008 14 1 13 0 1 1 2 2 1 3 1 2 1 0
2009 21 1 19 1 0 2 2 2 2 2 4 2 3 1
2010 20 1 19 1 1 3 2 3 3 2 1 1 1 1
2011 20 2 17 1 1 2 2 2 1 3 2 2 1 2
2012 14 2 12 0 2 1 1 1 2 3 1 2 1 0
2013 23 2 21 0 1 4 3 3 3 2 2 3 2 1
2014 24 1 21 1 2 2 2 3 3 2 3 4 1 1
2015 19 1 18 0 2 1 1 2 2 3 3 1 2 2
2016 23 1 22 0 1 2 1 1 5 3 2 2 3 3
2017 20 2 18 0 1 2 3 3 1 2 2 2 1 3
Traumatic Construction Deaths
Task 7. Analyse the collected data for suitability and completeness, taking action to
address any deficiencies found. Document the analysis, including action taken to
address deficiencies.
The greatest challenge faced during the assessment process was cause by the lack of proper
arranged of the data and the need for the remove of unnecessary data variables. After the data
cleaning process the data was prepared for effective assessment in Microsoft Excel.
Task 8. Apply the appropriate techniques to the collected data. Document this
application.
Descriptive Analysis
Summary Statistics for total traumatic construction deaths are presented below

Traumatic Construction Deaths 6
Total Deaths
Mean 19.9375
Standard Error 0.91955
Median 20
Mode 20
Standard Deviation 3.678202
Sample Variance 13.52917
Kurtosis -0.42864
Skewness 0.047547
Range 13
Minimum 14
Maximum 27
Sum 319
Count 16
Charts with regard to Gender, and Age groups
2002 2003 2004 2005 2006 2007 2008 2009 2010 2011 2012 2013 2014 2015 2016 2017
0
1
2
3
4
5
6
Traumatic Construction Deaths (Age groups)
15-19
20-24
25-29
30-34
35-39
40-44
45-49
50-54
55-59
60-64
65+
⊘ This is a preview!⊘
Do you want full access?
Subscribe today to unlock all pages.

Trusted by 1+ million students worldwide

Traumatic Construction Deaths 7
2002
2003
2004
2005
2006
2007
2008
2009
2010
2011
2012
2013
2014
2015
2016
2017
0
5
10
15
20
25
30
Traumtic Deaths in Construction (Gender)
Female Deaths
Male Deaths
Number of Individuals
Task 9. Using appropriate means check the answer. Provide evidence of answer checking.
Inferential Statistics
Hypothesis 1
H0 : μM =μF (Average overall traumatic construction deaths for males and females are same)
H1 : μM ≠ μF (Average overall traumatic construction deaths for males and females are different)
Paraphrase This Document
Need a fresh take? Get an instant paraphrase of this document with our AI Paraphraser

Traumatic Construction Deaths 8
t-Test: Two-Sample Assuming Unequal Variances
Female DeathsMale Deaths
Mean 1.366286 18.31093
Variance 0.132859 13.05965
Observations 16 16
Hypothesized Mean Difference 0
df 15
t Stat -18.6607
P(T<=t) one-tail 4.3E-12
t Critical one-tail 1.75305
P(T<=t) two-tail 8.59E-12
t Critical two-tail 2.13145
From the results the t-stat is less than –t critical i.e. -18.66<-2.131. Therefore, we will reject the
null hypothesis and conclude that the traumatic construction deaths are different for males and
females (Gaston 2014).
Hypothesis 2
H0 : μM =μF (Average overall traumatic construction deaths for all age-groups are same)
H1 : μM ≠ μF (Average overall traumatic construction deaths are different for at least one of the
age-groups)

Traumatic Construction Deaths 9
Anova: Single Factor
SUMMARY
Groups Count Sum Average Variance
15-19 16 6.253565 0.390847797 0.10864
20-24 16 22.61067 1.413167023 0.527782
25-29 16 31.28899 1.955562032 0.548485
30-34 16 30.50028 1.906267453 0.345971
35-39 16 36.69585 2.293490598 1.184546
40-44 16 36.46785 2.279240585 0.934059
45-49 16 39.58594 2.474121327 0.53468
50-54 16 36.61099 2.288186987 0.705685
55-59 16 35.48409 2.217755443 0.691226
60-64 16 23.27177 1.454485562 0.524559
65+ 16 17.09081 1.068175619 0.64171
ANOVA
Source of Variation SS df MS F P-value F crit
Between Groups 66.65546 10 6.665545807 10.86665 4.33E-14 1.88848
Within Groups 101.2101 165 0.613394765
Total 167.8656 175
Since, P value is less than 0.05 we will ignore F>F critical and therefore reject the null
hypothesis and conclude that the traumatic construction deaths are different at least one of the
age-groups (Fahrmeir et al. 2013).
Regression
The multiple regression model below shows the prediction of total traumatic construction deaths
using the gender variables males and females. The resultant model below is significant and
98.4% of the change in total traumatic construction deaths can be explained by the independent
variables (Montgomery, Peck & Vining 2015).
⊘ This is a preview!⊘
Do you want full access?
Subscribe today to unlock all pages.

Trusted by 1+ million students worldwide

Traumatic Construction Deaths 10
SUMMARY OUTPUT
Regression Statistics
Multiple R 0.991901
R Square 0.983868
Adjusted R Square 0.981386
Standard Error 0.501826
Observations 16
ANOVA
df SS MS F Significance F
Regression 2 199.6637 99.83186 396.4269 2.24E-12
Residual 13 3.273779 0.251829
Total 15 202.9375
CoefficientsStandard Error t Stat P-value Lower 95% Upper 95%Lower 95.0%Upper 95.0%
Intercept 0.242629 0.872322 0.278142 0.785278 -1.64191 2.127165 -1.64191 2.127165
Female Deaths 0.809248 0.357604 2.262969 0.041403 0.03669 1.581805 0.03669 1.581805
Male Deaths 1.015197 0.036069 28.14609 4.92E-13 0.937275 1.09312 0.937275 1.09312
Task11: Using appropriate means, communicate the outcome to the relevant stakeholders,
explaining the outcomes, as appropriate.
The summary statistics results indicate average deaths between 2002 and 2017 were
exactly 20. From the result it is also clear that the mean, mode, and median are considerably
similar this is an indication that the data for traumatic construction deaths is normally distributed.
This type of data distribution proves that there is a cyclical pattern in traumatic construction
deaths between 2002 and 2007 (Kemp, Hort & Hollowood 2018). The graphs illustrate that
individuals in the age groups 35-39 and 40-44 experienced the most cases of traumatic
construction deaths. The gender charts clearly shows that males experience more traumatic
construction deaths compared to females with a ration of roughly 10 to 1. From the hypothesis
results it is traumatic construction deaths are different for males and females as well as amongst
age groups.
Paraphrase This Document
Need a fresh take? Get an instant paraphrase of this document with our AI Paraphraser

Traumatic Construction Deaths 11
Task 12: Check to ensure that the outcome has addressed the problem. Provide evidence of
this check.
From the overall findings, we can conclude that traumatic construction death have been
oscillating from low to high over the years and stakeholders need to take remedial steps to
resolve the crisis. In addition, we have established that traumatic construction deaths are
different between males and females; with higher numbers being records in males. Moreover,
individuals aged between 35 and 45 are more susceptible to traumatic construction deaths
compared to other age groups.

Traumatic Construction Deaths 12
References
Fahrmeir, L, Kneib, T, Lang, S & Marx, B, 2013. Regression: Models, Methods and
Applications, 1st edn, Berlin. GE: Springer Science & Business Media.
Gaston, L, 2014. Hypothesis Testing Made Simple. 1st edn, Leonard Gaston.
Hartshorn, S, 2017. Hypothesis Testing: A Visual Introduction to Statistical Significance. 1st
edn, San francisco, CA: Independently Published.
Kemp, SE, Hort, J & Hollowood, T, 2018. Descriptive Analysis in Sensory Evaluation. Hoboken,
NJ: John Wiley & Sons,
Montgomery, DC, Peck, EA & Vining, GG, 2015. Introduction to Linear Regression Analysis.
4th edn, Hoboken, NJ: John Wiley & Sons.
⊘ This is a preview!⊘
Do you want full access?
Subscribe today to unlock all pages.

Trusted by 1+ million students worldwide
1 out of 12
Related Documents

Your All-in-One AI-Powered Toolkit for Academic Success.
+13062052269
info@desklib.com
Available 24*7 on WhatsApp / Email
Unlock your academic potential
Copyright © 2020–2025 A2Z Services. All Rights Reserved. Developed and managed by ZUCOL.