STAT1060 Assignment 2: Statistical Analysis for Decision Making
VerifiedAdded on  2023/06/04
|7
|1210
|244
Homework Assignment
AI Summary
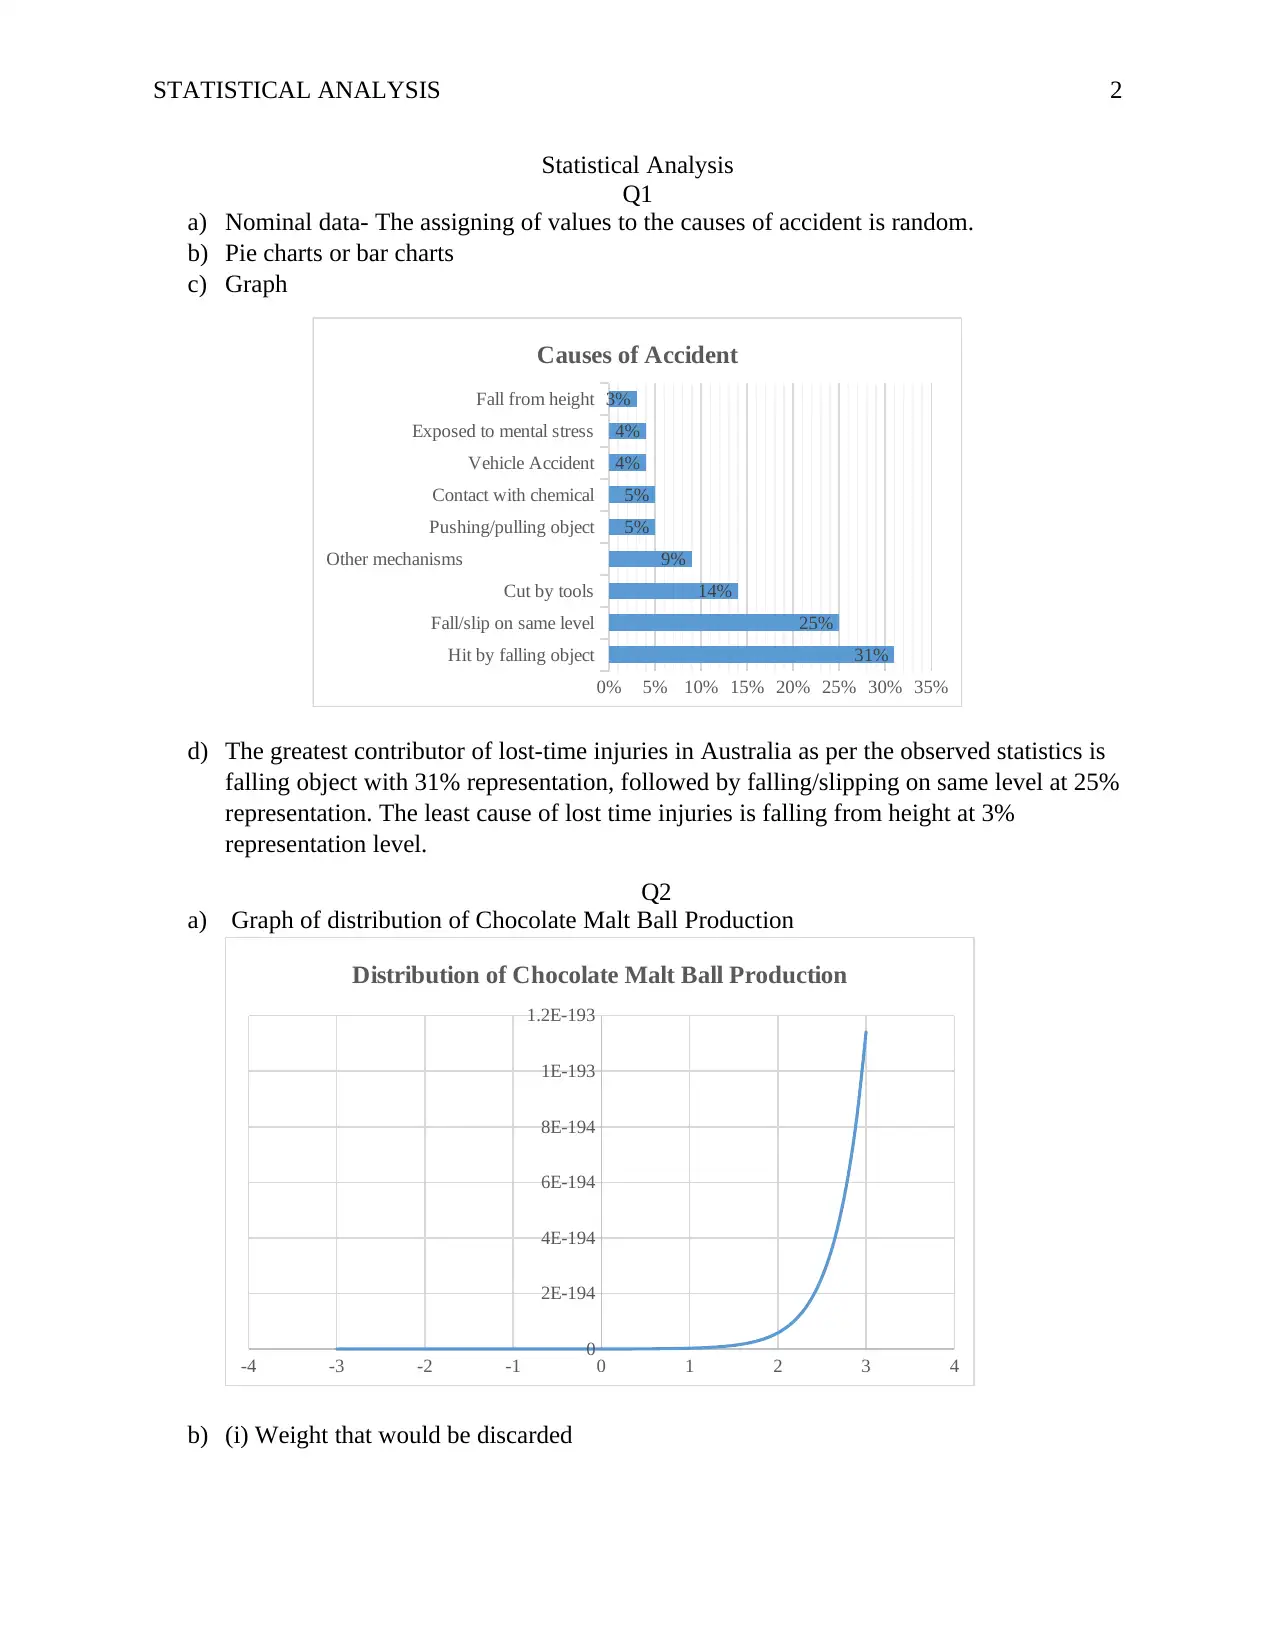
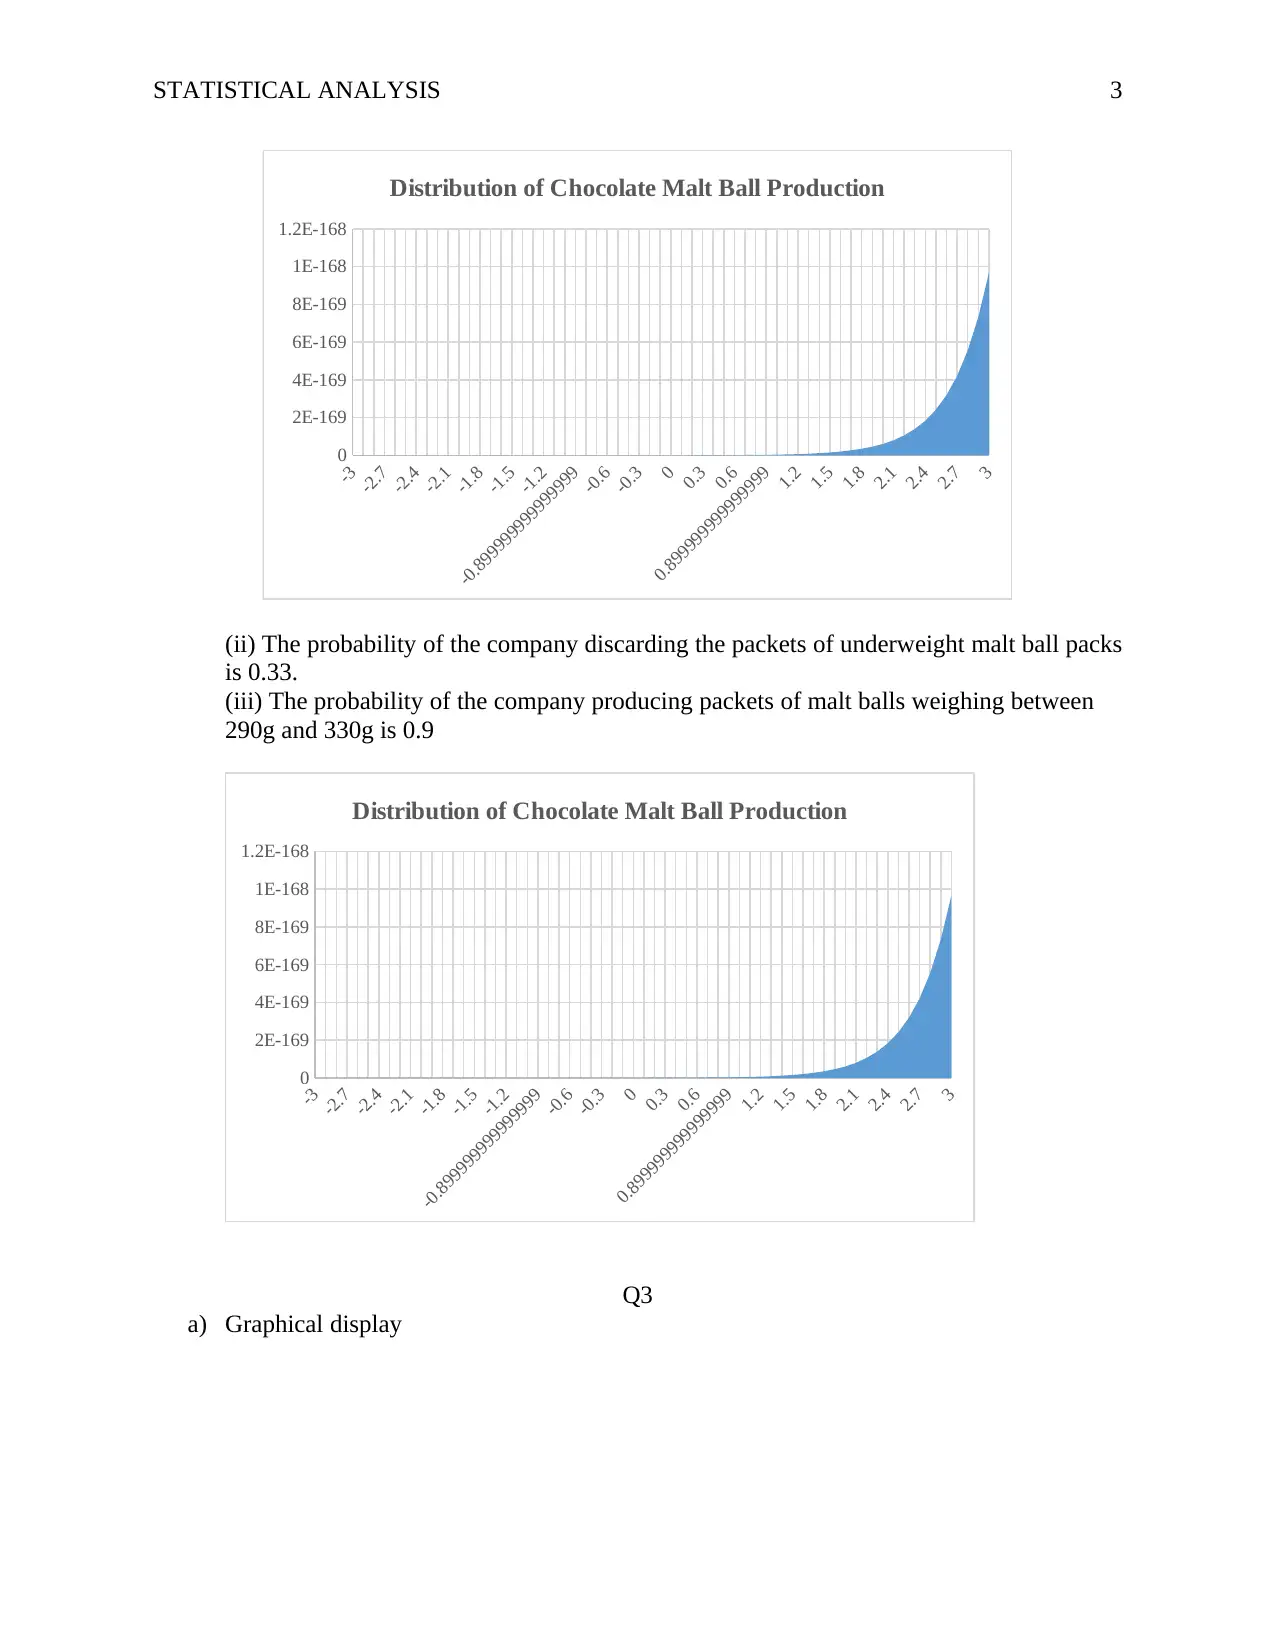
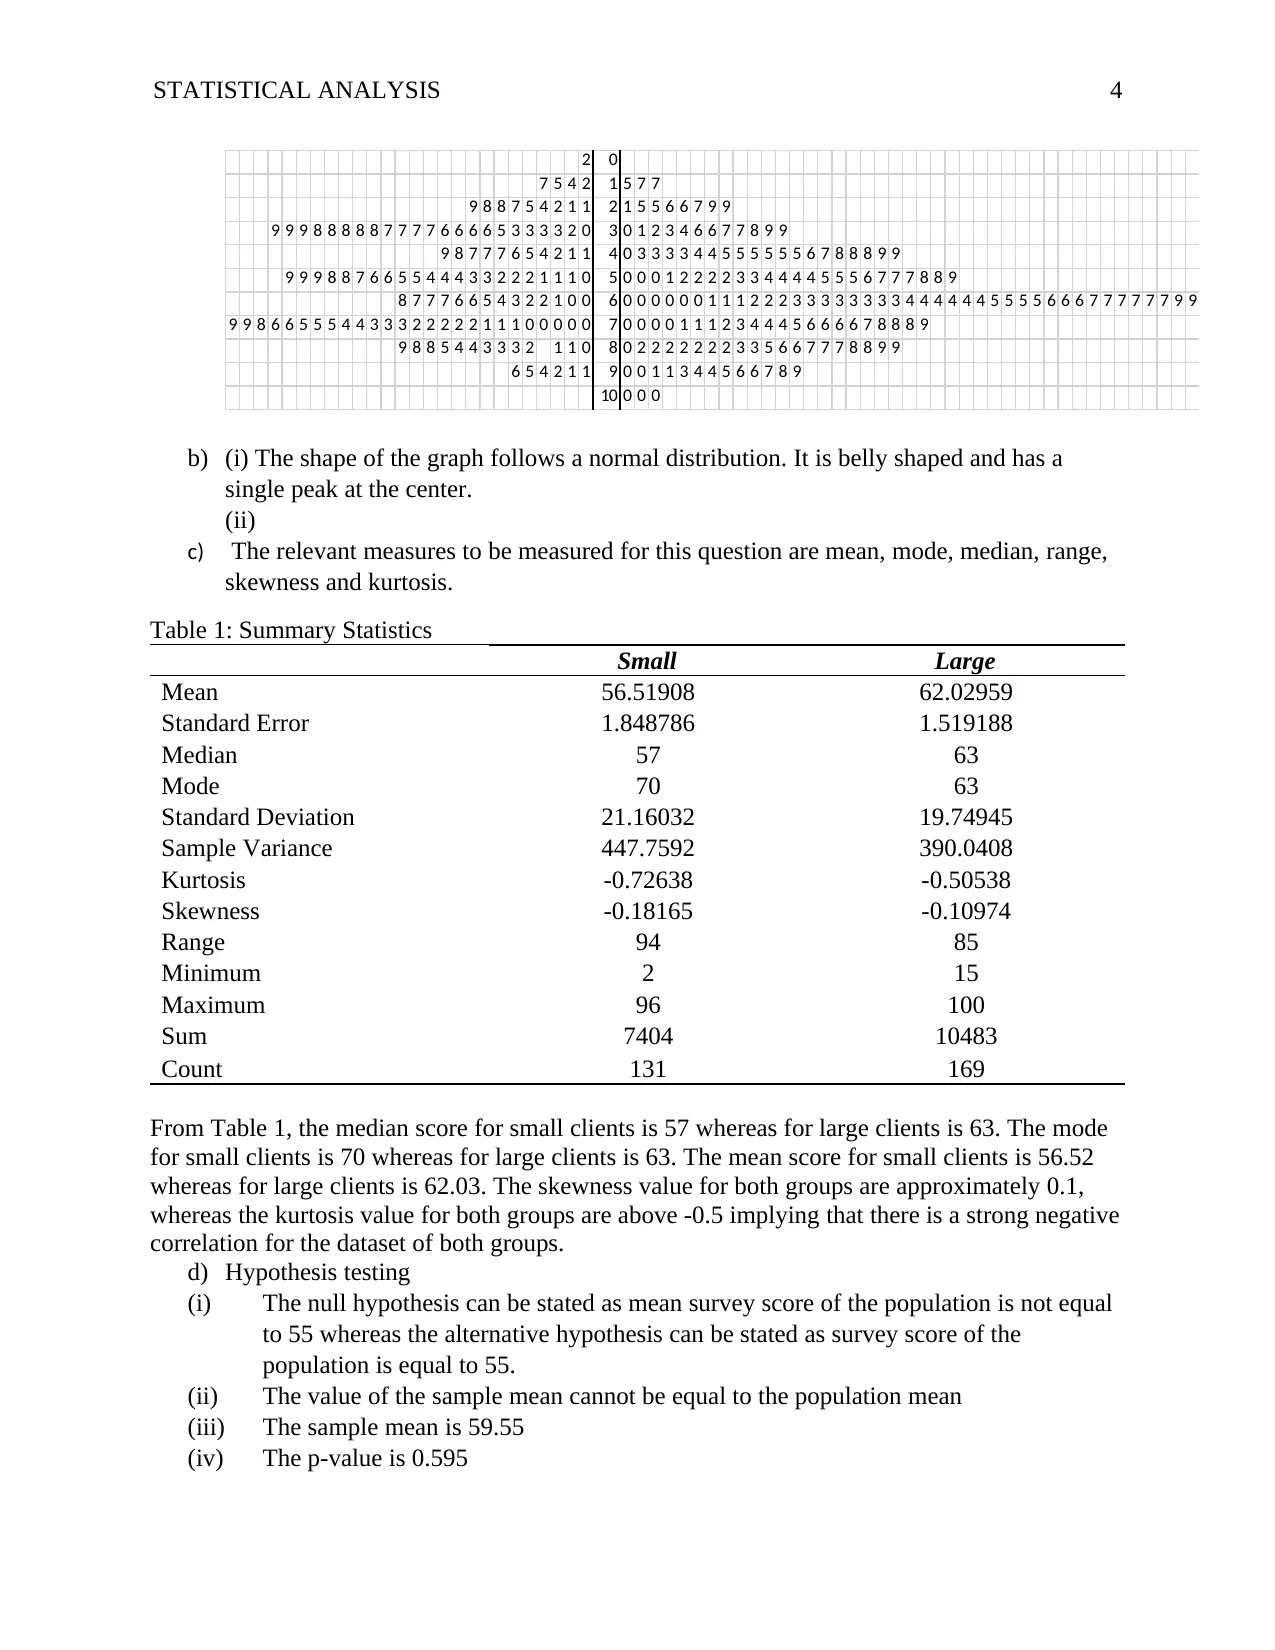
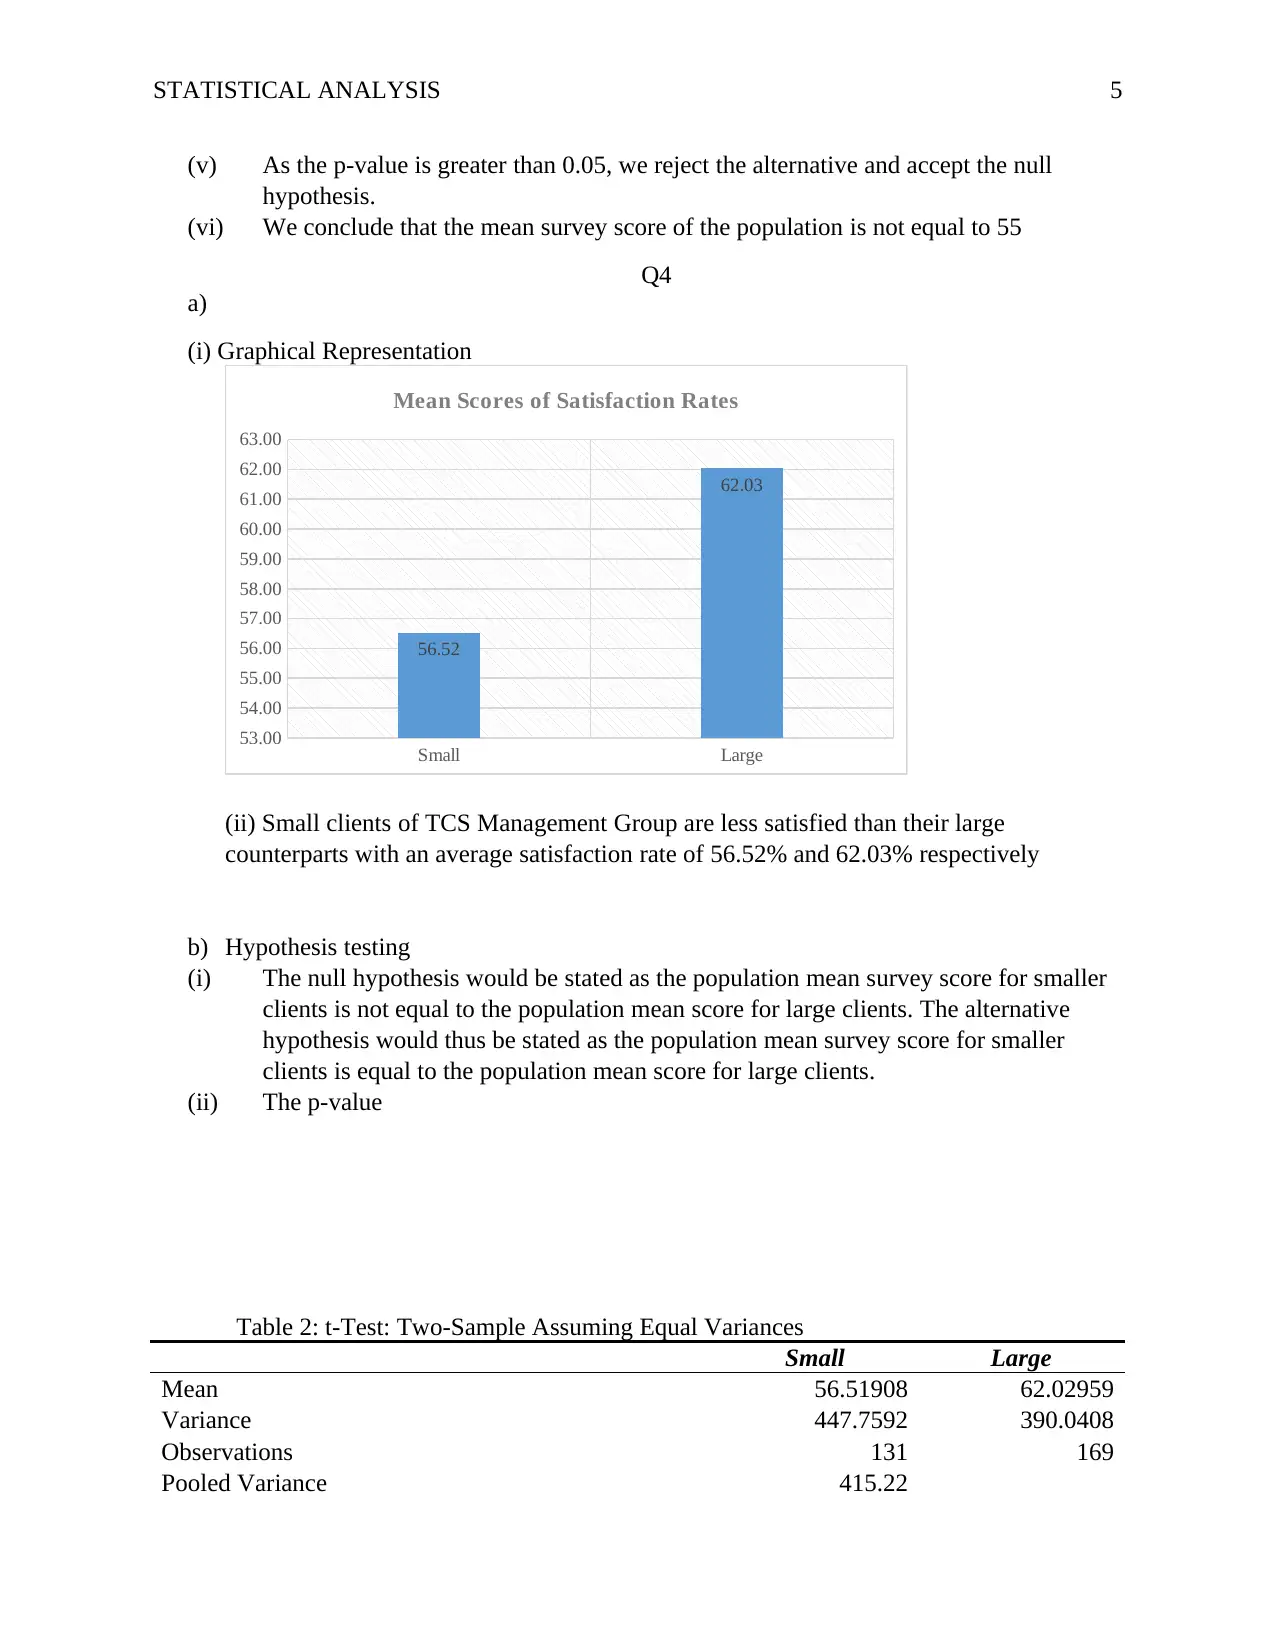
This assignment solution provides a detailed statistical analysis to support decision-making, covering topics from data types and graphical representations to hypothesis testing. It includes the analysis of accident causes using nominal data and appropriate charts, an examination of chocolate malt ball production distribution with probability calculations, and a survey score analysis involving measures of central tendency, skewness, and hypothesis testing. Furthermore, the solution includes a comparative analysis of satisfaction rates between small and large clients and an investigation into holiday preferences based on season and location using hypothesis testing. The final conclusion emphasizes the importance of data-driven decisions and suggests strategies for improvement based on the statistical findings.

Running head: STATISTICAL ANALYSIS 1
Statistical Analysis
Name
Institution
Statistical Analysis
Name
Institution
Paraphrase This Document
Need a fresh take? Get an instant paraphrase of this document with our AI Paraphraser

STATISTICAL ANALYSIS 2
Statistical Analysis
Q1
a) Nominal data- The assigning of values to the causes of accident is random.
b) Pie charts or bar charts
c) Graph
Hit by falling object
Fall/slip on same level
Cut by tools
Other mechanisms
Pushing/pulling object
Contact with chemical
Vehicle Accident
Exposed to mental stress
Fall from height
0% 5% 10% 15% 20% 25% 30% 35%
31%
25%
14%
9%
5%
5%
4%
4%
3%
Causes of Accident
d) The greatest contributor of lost-time injuries in Australia as per the observed statistics is
falling object with 31% representation, followed by falling/slipping on same level at 25%
representation. The least cause of lost time injuries is falling from height at 3%
representation level.
Q2
a) Graph of distribution of Chocolate Malt Ball Production
-4 -3 -2 -1 0 1 2 3 4
0
2E-194
4E-194
6E-194
8E-194
1E-193
1.2E-193
Distribution of Chocolate Malt Ball Production
b) (i) Weight that would be discarded

STATISTICAL ANALYSIS 3
-3
-2.7
-2.4
-2.1
-1.8
-1.5
-1.2
-0.899999999999999
-0.6
-0.3
0
0.3
0.6
0.899999999999999
1.2
1.5
1.8
2.1
2.4
2.7
3
0
2E-169
4E-169
6E-169
8E-169
1E-168
1.2E-168
Distribution of Chocolate Malt Ball Production
(ii) The probability of the company discarding the packets of underweight malt ball packs
is 0.33.
(iii) The probability of the company producing packets of malt balls weighing between
290g and 330g is 0.9
-3
-2.7
-2.4
-2.1
-1.8
-1.5
-1.2
-0.899999999999999
-0.6
-0.3
0
0.3
0.6
0.899999999999999
1.2
1.5
1.8
2.1
2.4
2.7
3
0
2E-169
4E-169
6E-169
8E-169
1E-168
1.2E-168
Distribution of Chocolate Malt Ball Production
Q3
a) Graphical display
-3
-2.7
-2.4
-2.1
-1.8
-1.5
-1.2
-0.899999999999999
-0.6
-0.3
0
0.3
0.6
0.899999999999999
1.2
1.5
1.8
2.1
2.4
2.7
3
0
2E-169
4E-169
6E-169
8E-169
1E-168
1.2E-168
Distribution of Chocolate Malt Ball Production
(ii) The probability of the company discarding the packets of underweight malt ball packs
is 0.33.
(iii) The probability of the company producing packets of malt balls weighing between
290g and 330g is 0.9
-3
-2.7
-2.4
-2.1
-1.8
-1.5
-1.2
-0.899999999999999
-0.6
-0.3
0
0.3
0.6
0.899999999999999
1.2
1.5
1.8
2.1
2.4
2.7
3
0
2E-169
4E-169
6E-169
8E-169
1E-168
1.2E-168
Distribution of Chocolate Malt Ball Production
Q3
a) Graphical display
You're viewing a preview
Unlock full access by subscribing today!

STATISTICAL ANALYSIS 4
2 0
7 5 4 2 1 5 7 7
9 8 8 7 5 4 2 1 1 2 1 5 5 6 6 7 9 9
9 9 9 8 8 8 8 8 7 7 7 7 6 6 6 6 5 3 3 3 3 2 0 3 0 1 2 3 4 6 6 7 7 8 9 9
9 8 7 7 7 6 5 4 2 1 1 4 0 3 3 3 3 4 4 5 5 5 5 5 5 6 7 8 8 8 9 9
9 9 9 8 8 7 6 6 5 5 4 4 4 3 3 2 2 2 1 1 1 0 5 0 0 0 1 2 2 2 2 3 3 4 4 4 4 5 5 5 6 7 7 7 8 8 9
8 7 7 7 6 6 5 4 3 2 2 1 0 0 6 0 0 0 0 0 0 1 1 1 2 2 2 3 3 3 3 3 3 3 3 4 4 4 4 4 4 5 5 5 5 6 6 6 7 7 7 7 7 7 9 9
9 9 8 6 6 5 5 5 4 4 3 3 3 2 2 2 2 2 1 1 1 0 0 0 0 0 7 0 0 0 0 1 1 1 2 3 4 4 4 5 6 6 6 6 7 8 8 8 9
9 8 8 5 4 4 3 3 3 2 1 1 0 8 0 2 2 2 2 2 2 2 3 3 5 6 6 7 7 7 8 8 9 9
6 5 4 2 1 1 9 0 0 1 1 3 4 4 5 6 6 7 8 9
10 0 0 0
b) (i) The shape of the graph follows a normal distribution. It is belly shaped and has a
single peak at the center.
(ii)
c) The relevant measures to be measured for this question are mean, mode, median, range,
skewness and kurtosis.
Table 1: Summary Statistics
Small Large
Mean 56.51908 62.02959
Standard Error 1.848786 1.519188
Median 57 63
Mode 70 63
Standard Deviation 21.16032 19.74945
Sample Variance 447.7592 390.0408
Kurtosis -0.72638 -0.50538
Skewness -0.18165 -0.10974
Range 94 85
Minimum 2 15
Maximum 96 100
Sum 7404 10483
Count 131 169
From Table 1, the median score for small clients is 57 whereas for large clients is 63. The mode
for small clients is 70 whereas for large clients is 63. The mean score for small clients is 56.52
whereas for large clients is 62.03. The skewness value for both groups are approximately 0.1,
whereas the kurtosis value for both groups are above -0.5 implying that there is a strong negative
correlation for the dataset of both groups.
d) Hypothesis testing
(i) The null hypothesis can be stated as mean survey score of the population is not equal
to 55 whereas the alternative hypothesis can be stated as survey score of the
population is equal to 55.
(ii) The value of the sample mean cannot be equal to the population mean
(iii) The sample mean is 59.55
(iv) The p-value is 0.595
Paraphrase This Document
Need a fresh take? Get an instant paraphrase of this document with our AI Paraphraser

STATISTICAL ANALYSIS 5
(v) As the p-value is greater than 0.05, we reject the alternative and accept the null
hypothesis.
(vi) We conclude that the mean survey score of the population is not equal to 55
Q4
a)
(i) Graphical Representation
Small Large
53.00
54.00
55.00
56.00
57.00
58.00
59.00
60.00
61.00
62.00
63.00
56.52
62.03
Mean Scores of Satisfaction Rates
(ii) Small clients of TCS Management Group are less satisfied than their large
counterparts with an average satisfaction rate of 56.52% and 62.03% respectively
b) Hypothesis testing
(i) The null hypothesis would be stated as the population mean survey score for smaller
clients is not equal to the population mean score for large clients. The alternative
hypothesis would thus be stated as the population mean survey score for smaller
clients is equal to the population mean score for large clients.
(ii) The p-value
Table 2: t-Test: Two-Sample Assuming Equal Variances
Small Large
Mean 56.51908 62.02959
Variance 447.7592 390.0408
Observations 131 169
Pooled Variance 415.22

STATISTICAL ANALYSIS 6
Hypothesized Mean Difference 0
df 298
t Stat -2.32311
P(T<=t) one-tail 0.010423
t Critical one-tail 1.649983
P(T<=t) two-tail 0.020846
t Critical two-tail 1.967957
The p-value of this model is 0.020846
(iii) Since P (T<=t) two-tail 0.020846 is less than p-value 0.05, we reject null hypothesis
and accept the alternative hypothesis. Thus, we can conclude that the population
mean survey score for smaller clients is equal to the population mean score for large
clients.
(iv) Both categories of clients are equally not satisfied with the services of TCS
Management Group.
(v) The management should consider improving services of TCS Group to equally satisfy
small and large clients.
Q (5)
Season
Summer Winter Total
Prefere
nce
Inland 20 20 40
Coastal 30 10 40
Total 50 30 80
a) The probability of a person travelling in the Summer selecting a Coastal location is 0.75
b) The probability of a person travelling in the Winter selecting to visit an Inland location is
0.5
c) Yes, a negative relationship. Most people prefer traveling to the coastal location and
during summer seasons.
d) Hypothesis testing
(i) The null hypothesis can be stated as there is no a statistically significant relationship
between preferences for coastal or inland holidays, and the season people prefer to
travel. Thus, the alternative is stated as there is a statistically significant relationship
between preferences for coastal or inland holidays, and the season people prefer to
travel.
(ii) P-value 0.263597138
You're viewing a preview
Unlock full access by subscribing today!

STATISTICAL ANALYSIS 7
(iii) Reject the alternative hypothesis and accept the null as the P-value is greater than
0.05.
(iv) Thus, we can concluded that as there is no a statistically significant relationship
between preferences for coastal or inland holidays.
(v) Yes, I would suggest an increase in advertising to both inland and coastal destinations
during winter as both categories of destinations are equally favored by travelers.
1 out of 7

Your All-in-One AI-Powered Toolkit for Academic Success.
 +13062052269
info@desklib.com
Available 24*7 on WhatsApp / Email
Unlock your academic potential
© 2024  |  Zucol Services PVT LTD  |  All rights reserved.