Supply Chain Analytics: Statistical Analysis of Defects and Refills

Verified

Added on  2023/06/05

|6
|502
|216
Homework Assignment
AI Summary
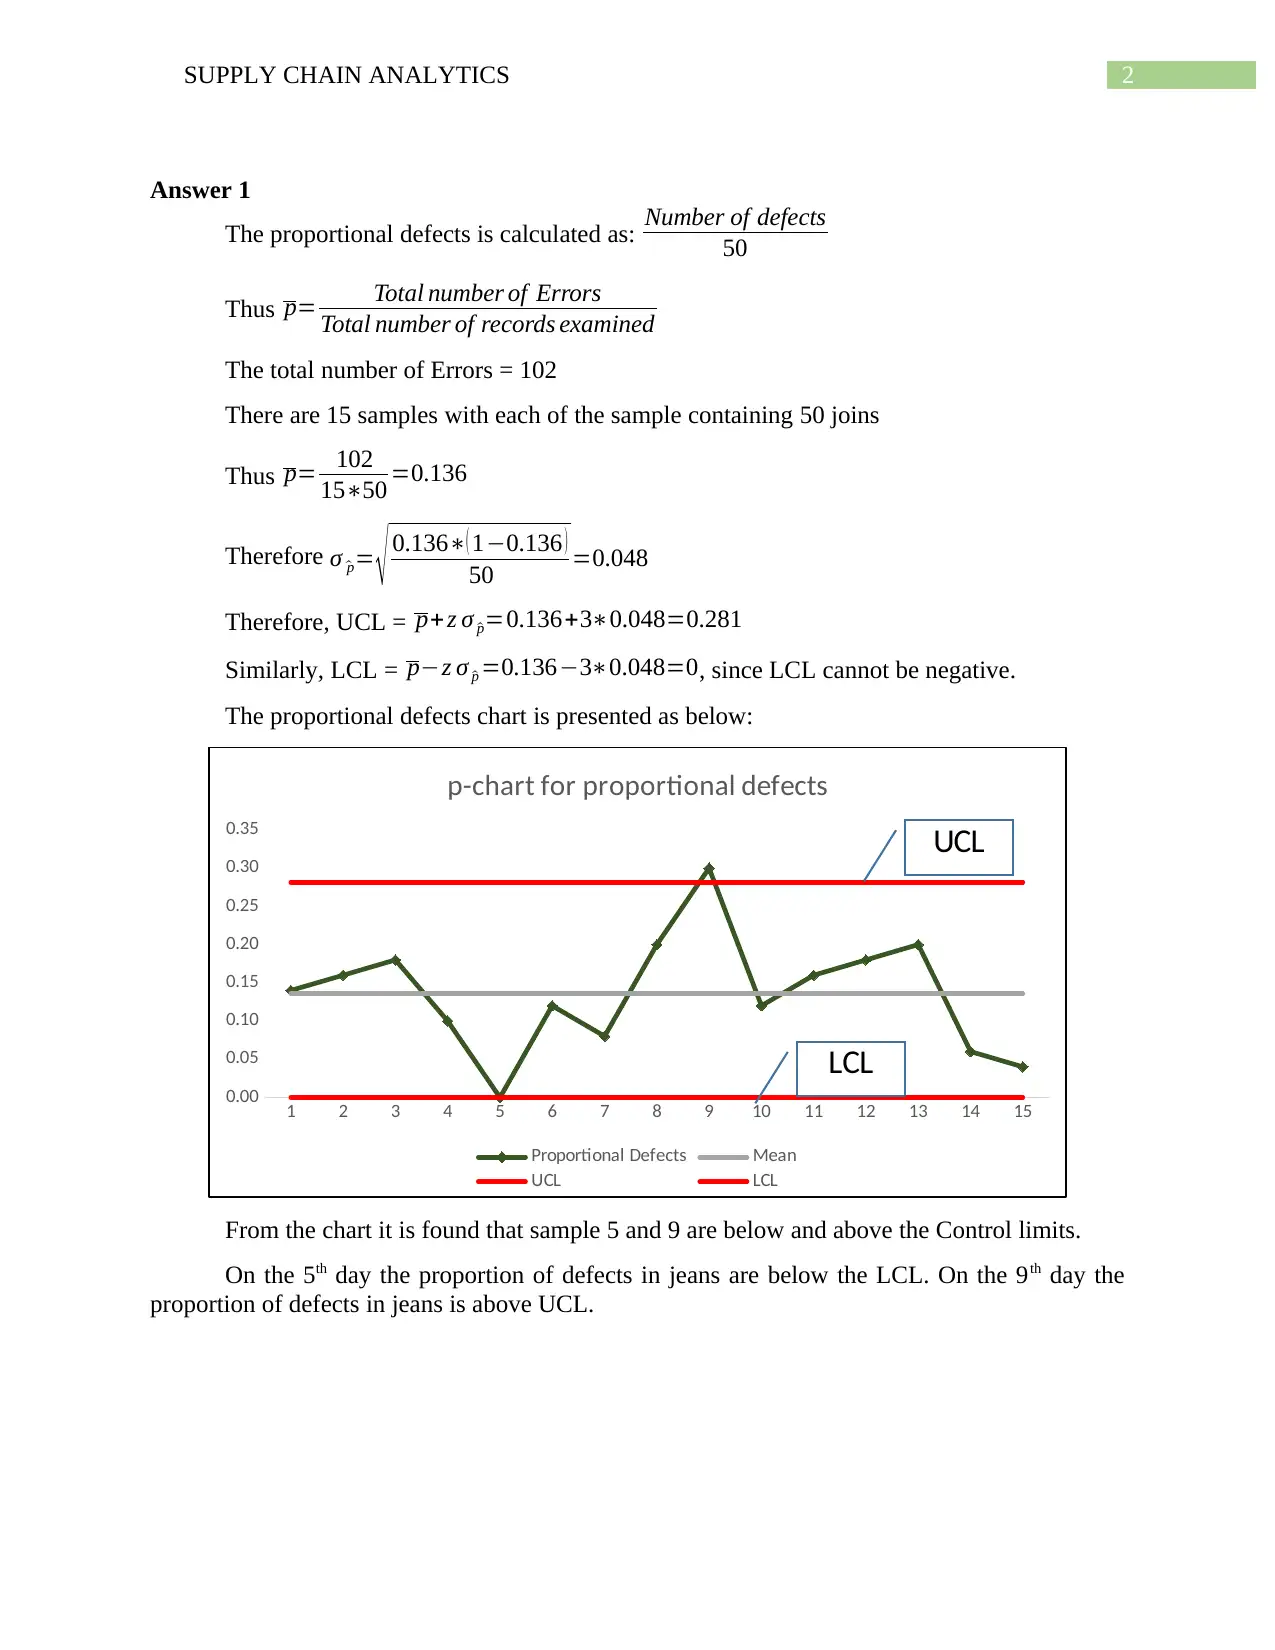
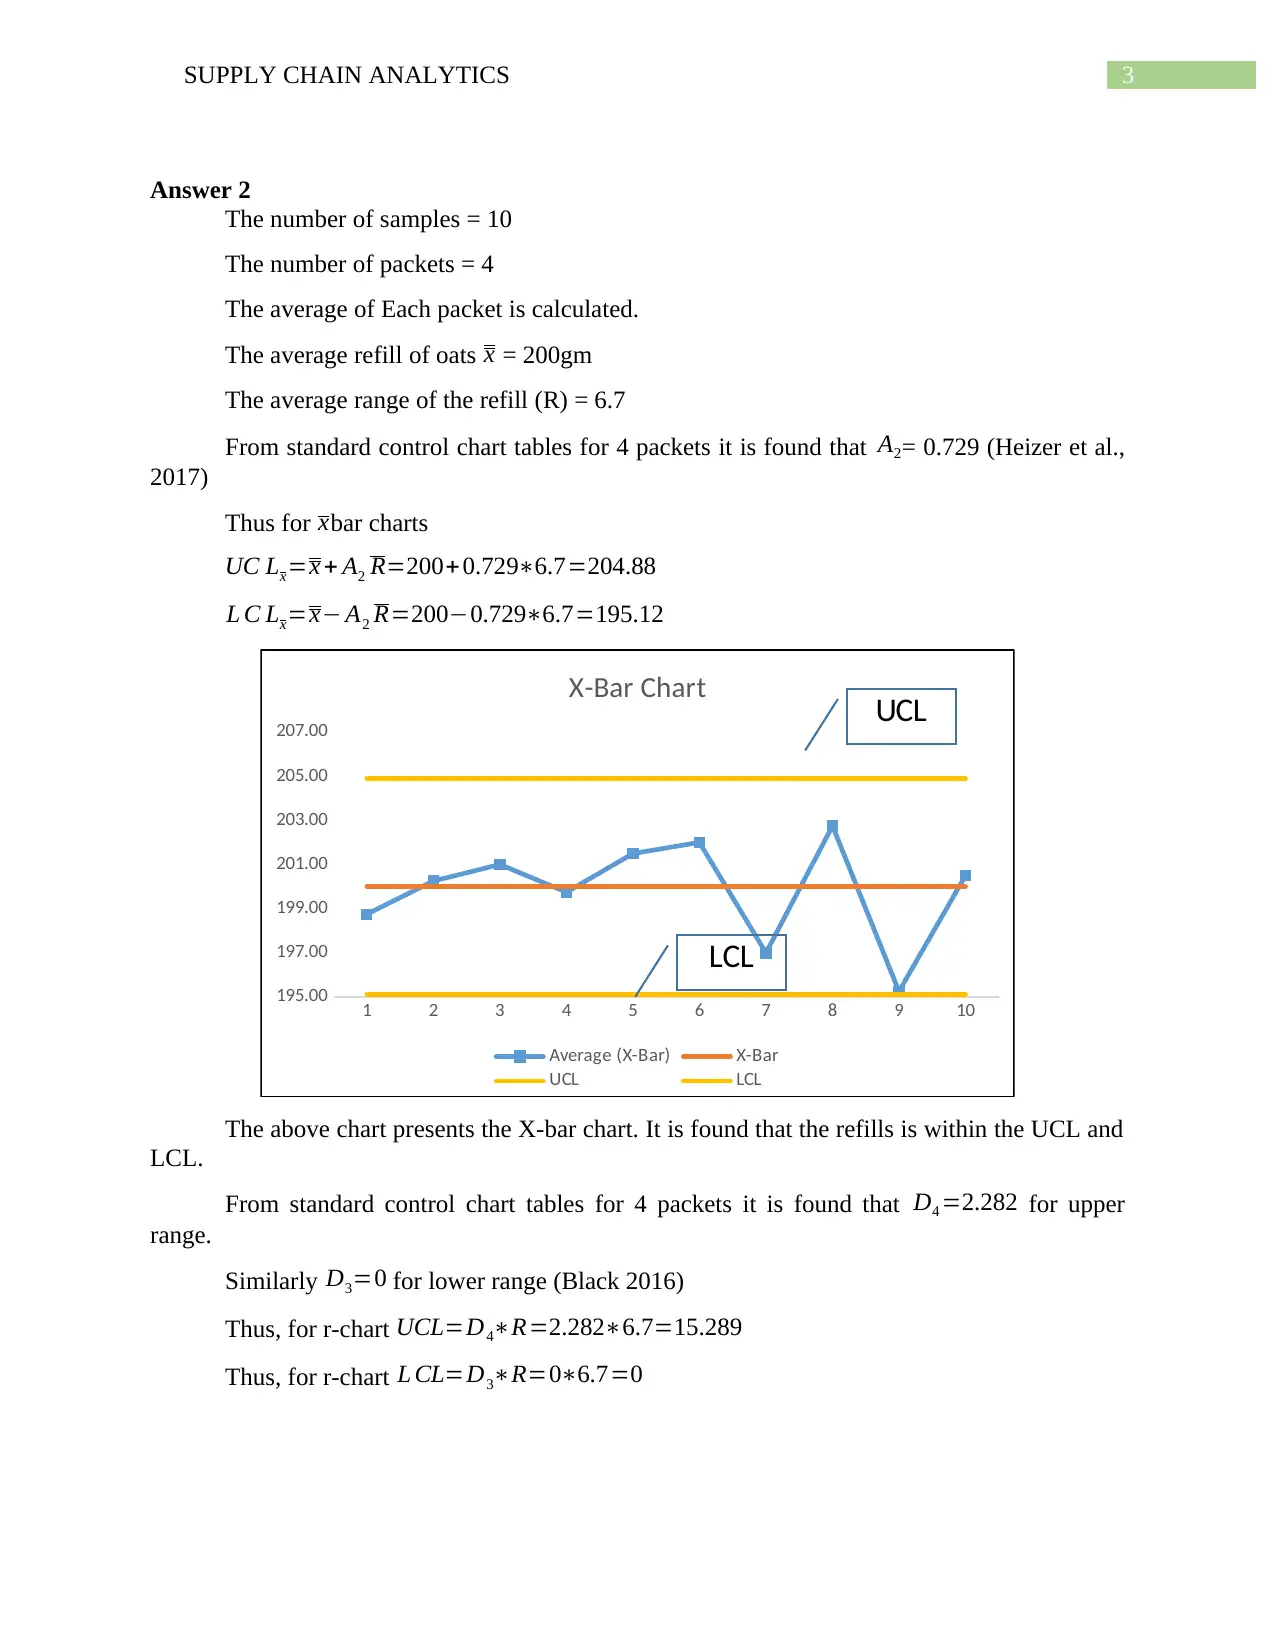
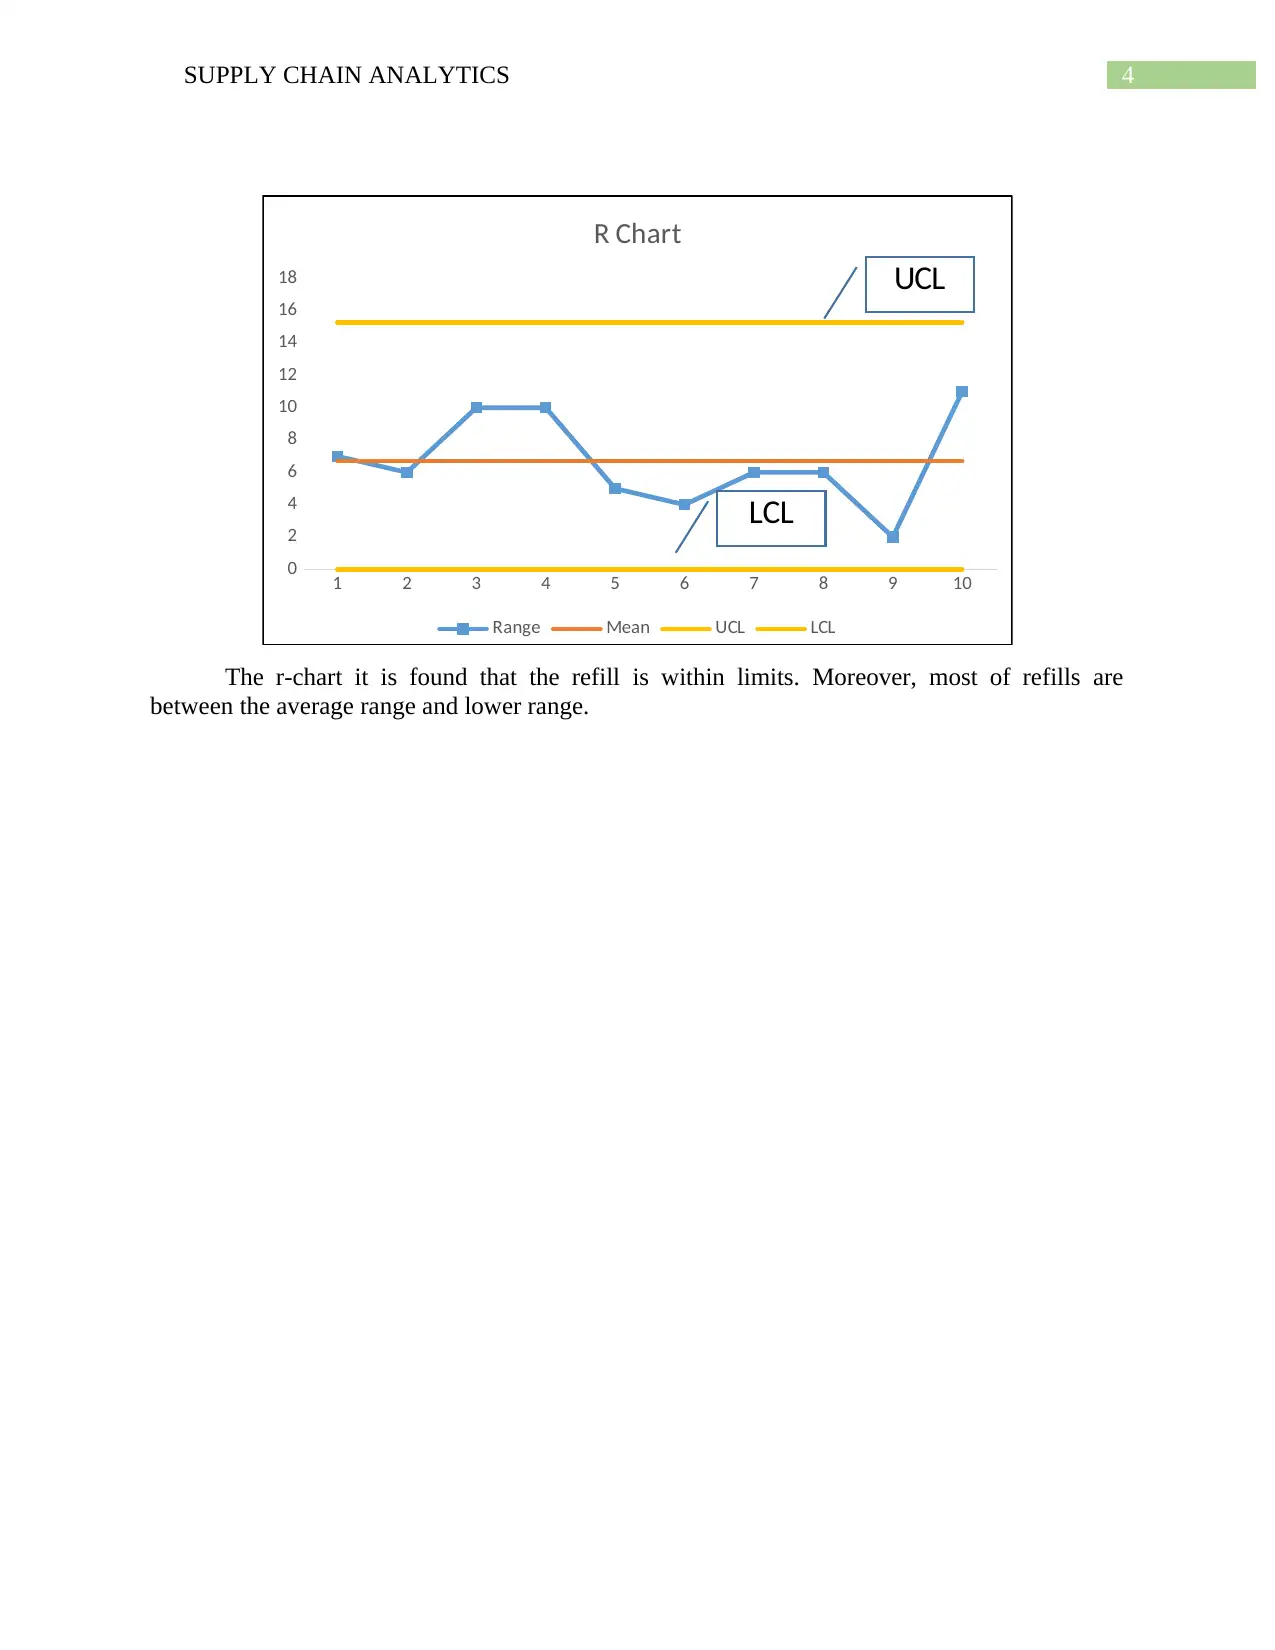
This assignment delves into supply chain analytics, focusing on the statistical analysis of defects and refills. It begins by calculating proportional defects using a p-chart, determining the Upper Control Limit (UCL) and Lower Control Limit (LCL), and analyzing sample data to identify instances where defect proportions fall outside acceptable control limits. Specifically, the analysis highlights deviations on the 5th and 9th days. The assignment then shifts to examining refill processes, employing X-bar and R-charts to assess the average refill amounts and ranges. The UCL and LCL are calculated for both charts, and the analysis confirms that the refills are within acceptable limits, with most falling between the average and lower ranges. The assignment references standard control chart tables and relevant literature to support its analysis and conclusions.
tabler-icon-diamond-filled.svg

Contribute Materials

Your contribution can guide someone’s learning journey. Share your documents today.
Document Page
Running Head: SUPPLY CHAIN ANALYTICS
Supply Chain Analytics
Name of the Student
Name of the University
Author Note
tabler-icon-diamond-filled.svg

Secure Best Marks with AI Grader

Need help grading? Try our AI Grader for instant feedback on your assignments.
Document Page
1SUPPLY CHAIN ANALYTICS
Table of Contents
Answer 1..........................................................................................................................................2
Answer 2..........................................................................................................................................3
Reference.........................................................................................................................................5
Document Page
2SUPPLY CHAIN ANALYTICS
Answer 1
The proportional defects is calculated as: Number of defects
50
Thus p= Total number of Errors
Total number of records examined
The total number of Errors = 102
There are 15 samples with each of the sample containing 50 joins
Thus p= 102
1550 =0.136
Therefore σ ^p= 0.136( 10.136 )
50 =0.048
Therefore, UCL = p+ z σ ^p=0.136+30.048=0.281
Similarly, LCL = pz σ ^p =0.13630.048=0, since LCL cannot be negative.
The proportional defects chart is presented as below:
1 2 3 4 5 6 7 8 9 10 11 12 13 14 15
0.00
0.05
0.10
0.15
0.20
0.25
0.30
0.35
p-chart for proportional defects
Proportional Defects Mean
UCL LCL
LCL
UCL
From the chart it is found that sample 5 and 9 are below and above the Control limits.
On the 5th day the proportion of defects in jeans are below the LCL. On the 9th day the
proportion of defects in jeans is above UCL.
Document Page
3SUPPLY CHAIN ANALYTICS
Answer 2
The number of samples = 10
The number of packets = 4
The average of Each packet is calculated.
The average refill of oats x = 200gm
The average range of the refill (R) = 6.7
From standard control chart tables for 4 packets it is found that A2= 0.729 (Heizer et al.,
2017)
Thus for xbar charts
UC Lx=x + A2 R=200+ 0.7296.7=204.88
L C Lx=x A2 R=2000.7296.7=195.12
1 2 3 4 5 6 7 8 9 10
195.00
197.00
199.00
201.00
203.00
205.00
207.00
X-Bar Chart
Average (X-Bar) X-Bar
UCL LCL
LCL
UCL
The above chart presents the X-bar chart. It is found that the refills is within the UCL and
LCL.
From standard control chart tables for 4 packets it is found that D4 =2.282 for upper
range.
Similarly D3=0 for lower range (Black 2016)
Thus, for r-chart UCL=D4R=2.2826.7=15.289
Thus, for r-chart L CL=D3R=06.7=0
tabler-icon-diamond-filled.svg

Secure Best Marks with AI Grader

Need help grading? Try our AI Grader for instant feedback on your assignments.
Document Page
4SUPPLY CHAIN ANALYTICS
1 2 3 4 5 6 7 8 9 10
0
2
4
6
8
10
12
14
16
18
R Chart
Range Mean UCL LCL
LCL
UCL
The r-chart it is found that the refill is within limits. Moreover, most of refills are
between the average range and lower range.
Document Page
5SUPPLY CHAIN ANALYTICS
Reference
Black, K., 2016. Business statistics: Contemporary decision making. 9/e. John Wiley & Sons.
Heizer, J., Render, B., Munson, C. and Sachan, A., 2017. Operations management: sustainability
and supply chain management, 12/e. Pearson Education
chevron_up_icon
1 out of 6
circle_padding
hide_on_mobile
zoom_out_icon
logo.png

Your All-in-One AI-Powered Toolkit for Academic Success.

Available 24*7 on WhatsApp / Email

[object Object]