Statistical Analysis Report: Edinburgh Humidity Data (December 2019)
VerifiedAdded on 2023/01/17
|15
|1872
|29
Report
AI Summary
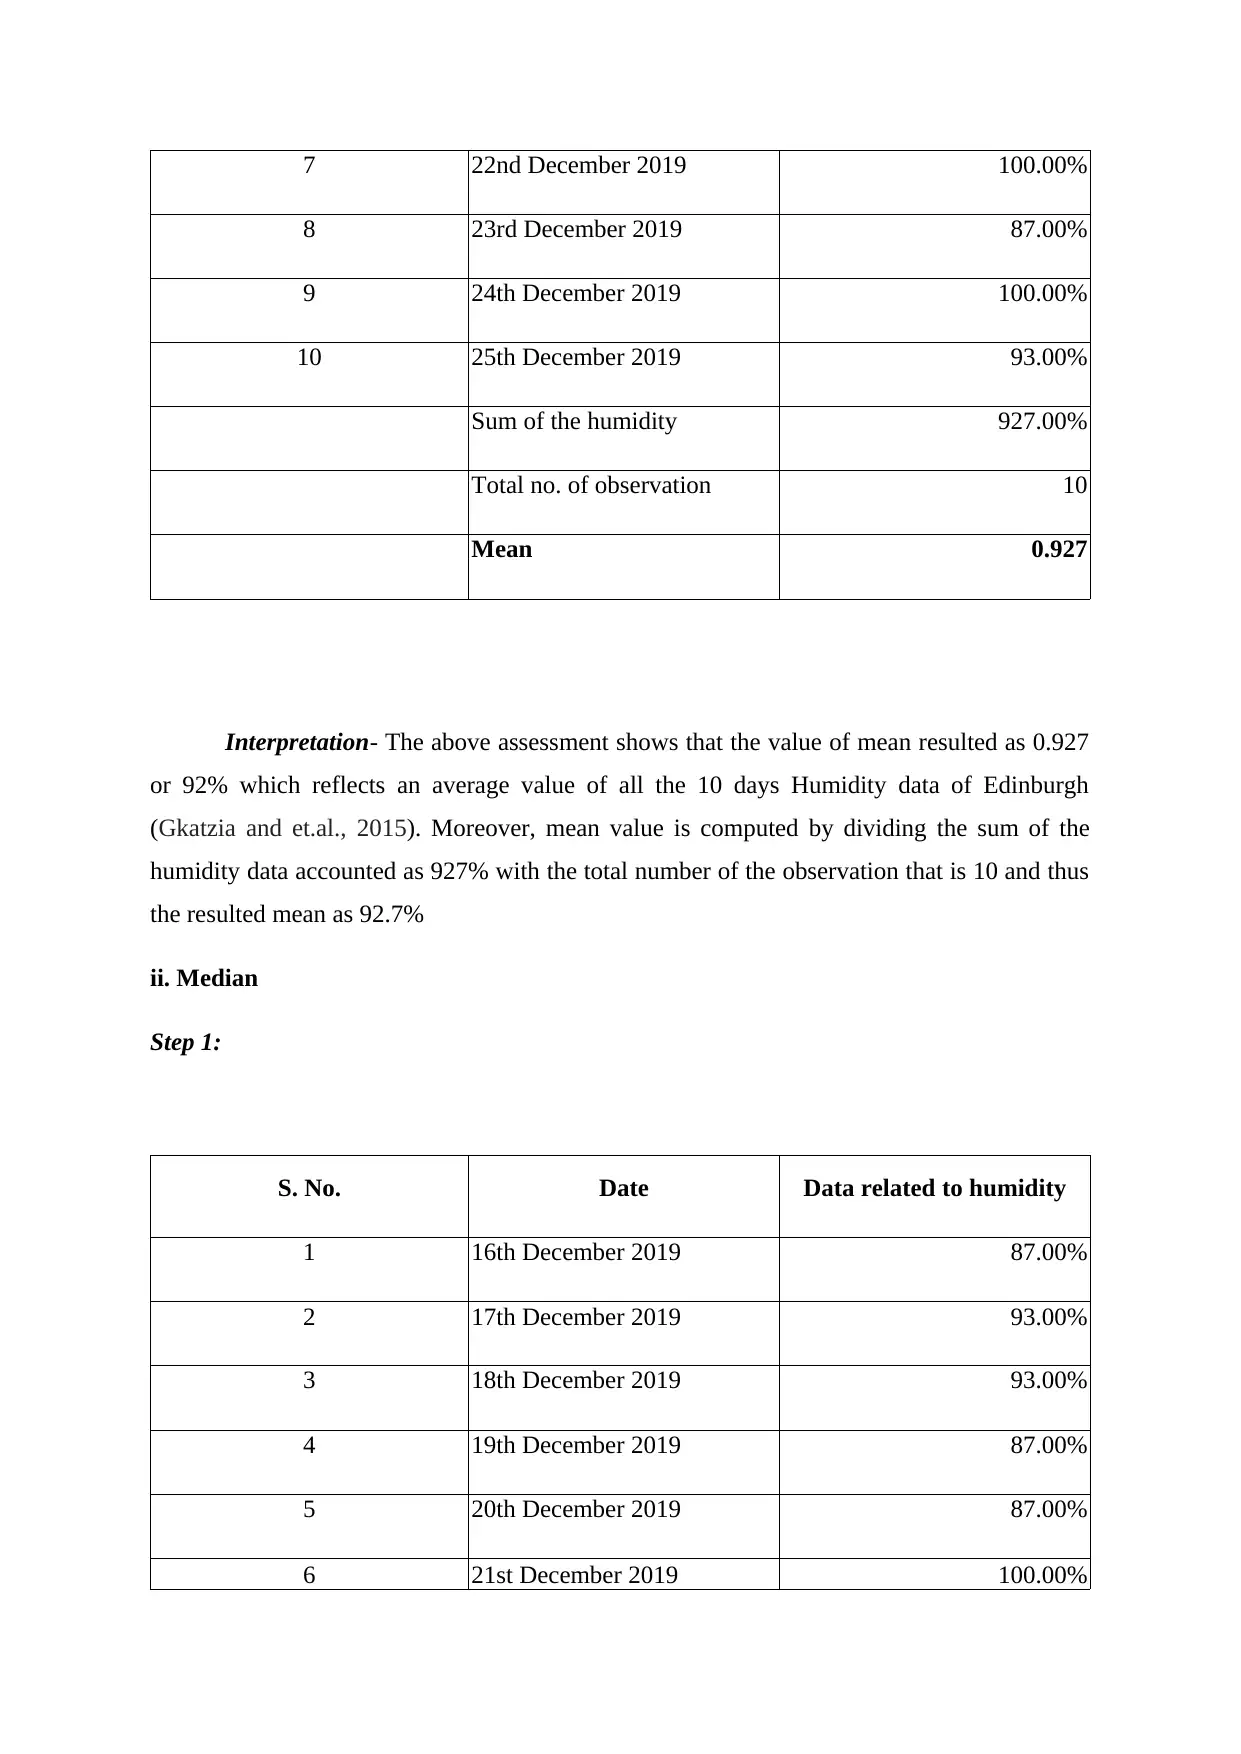
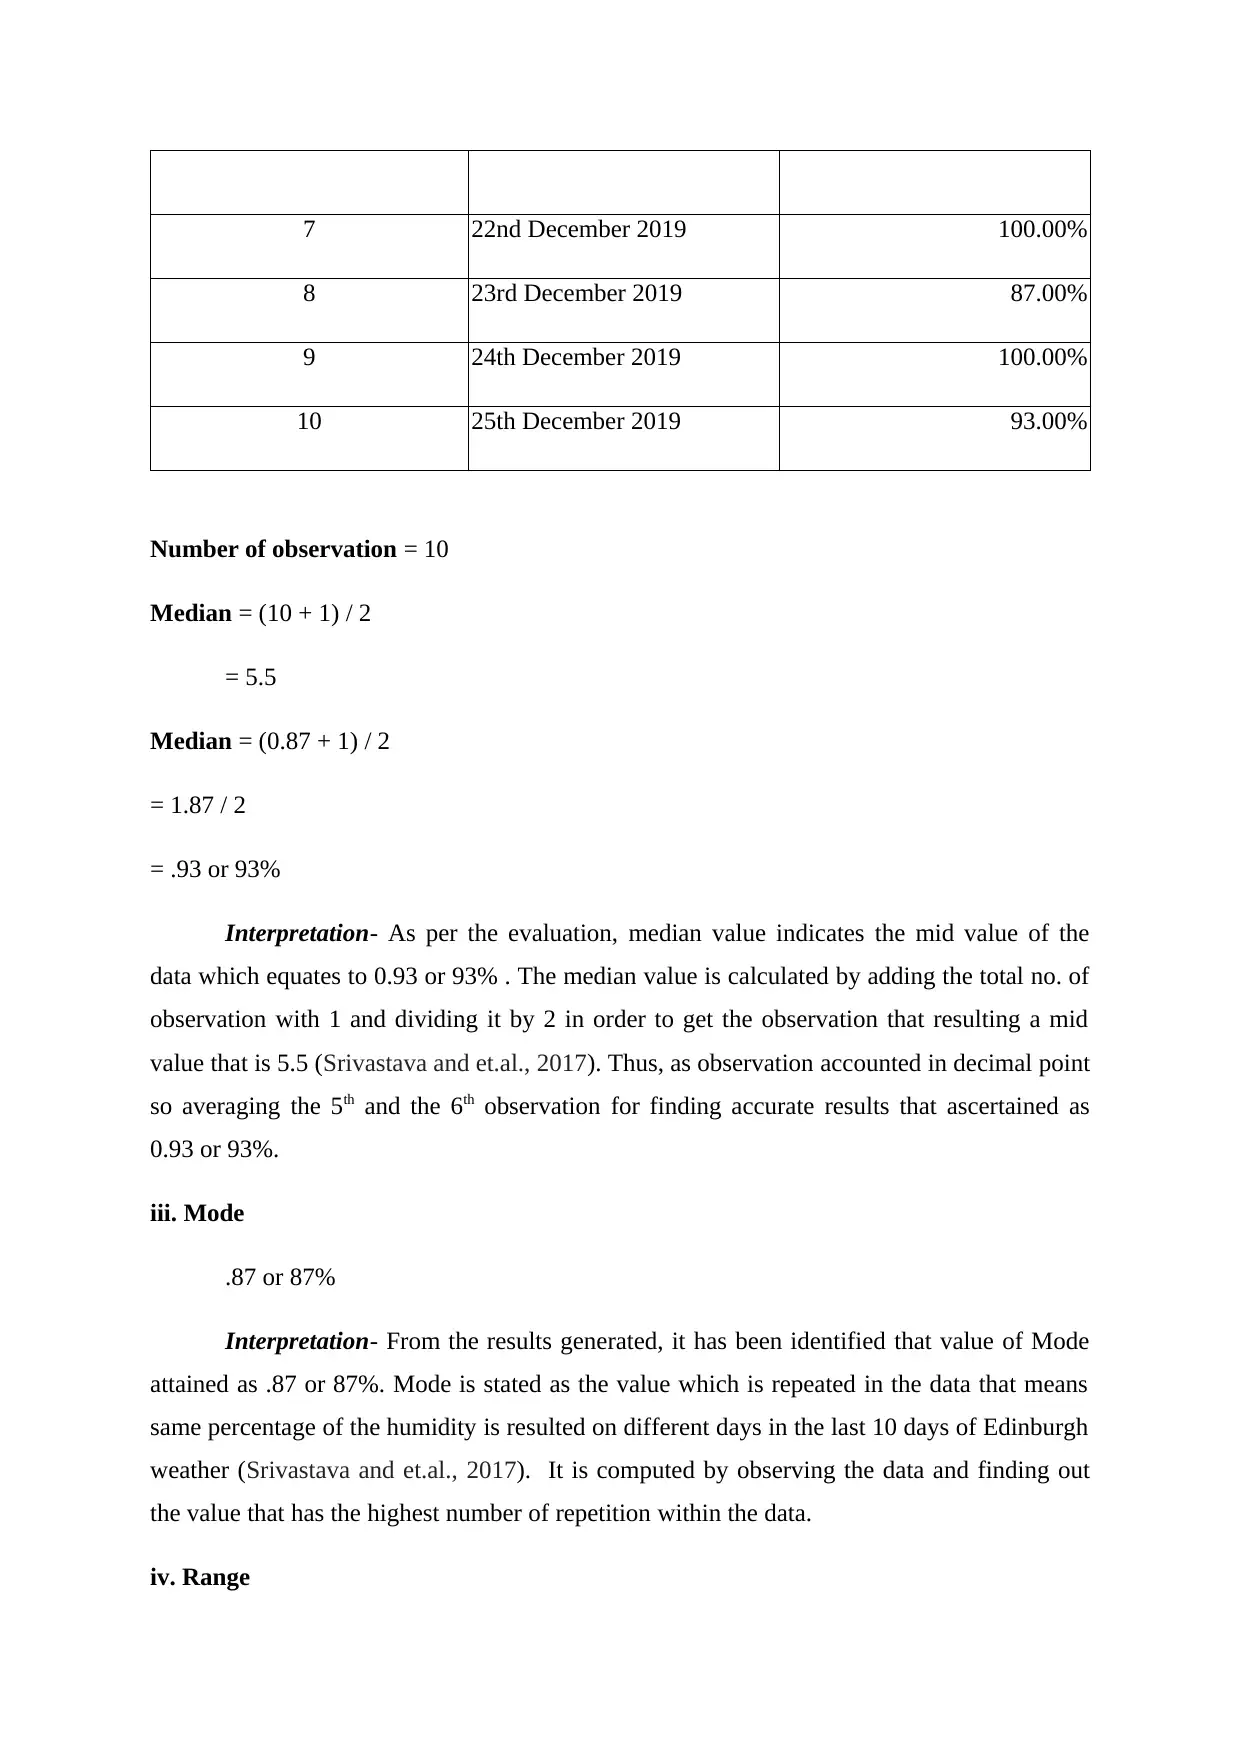
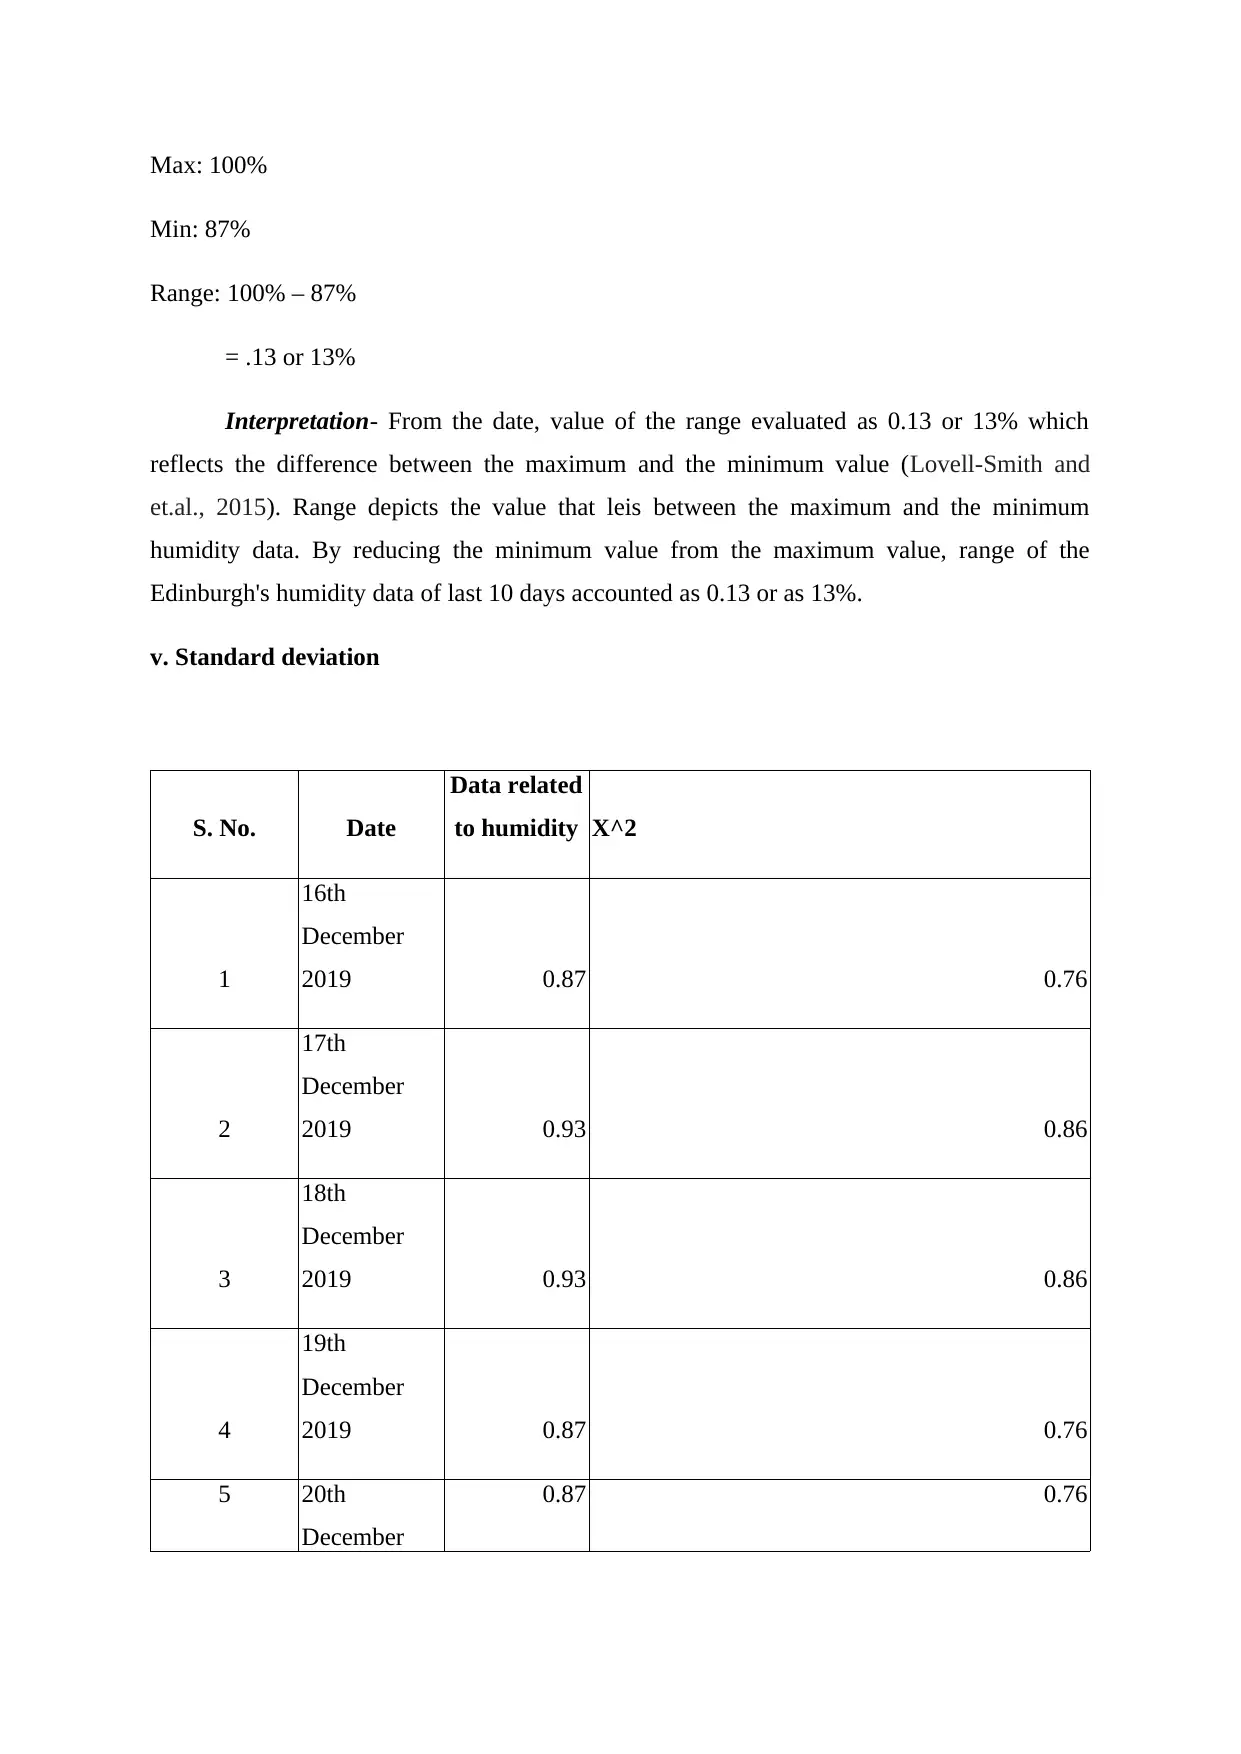
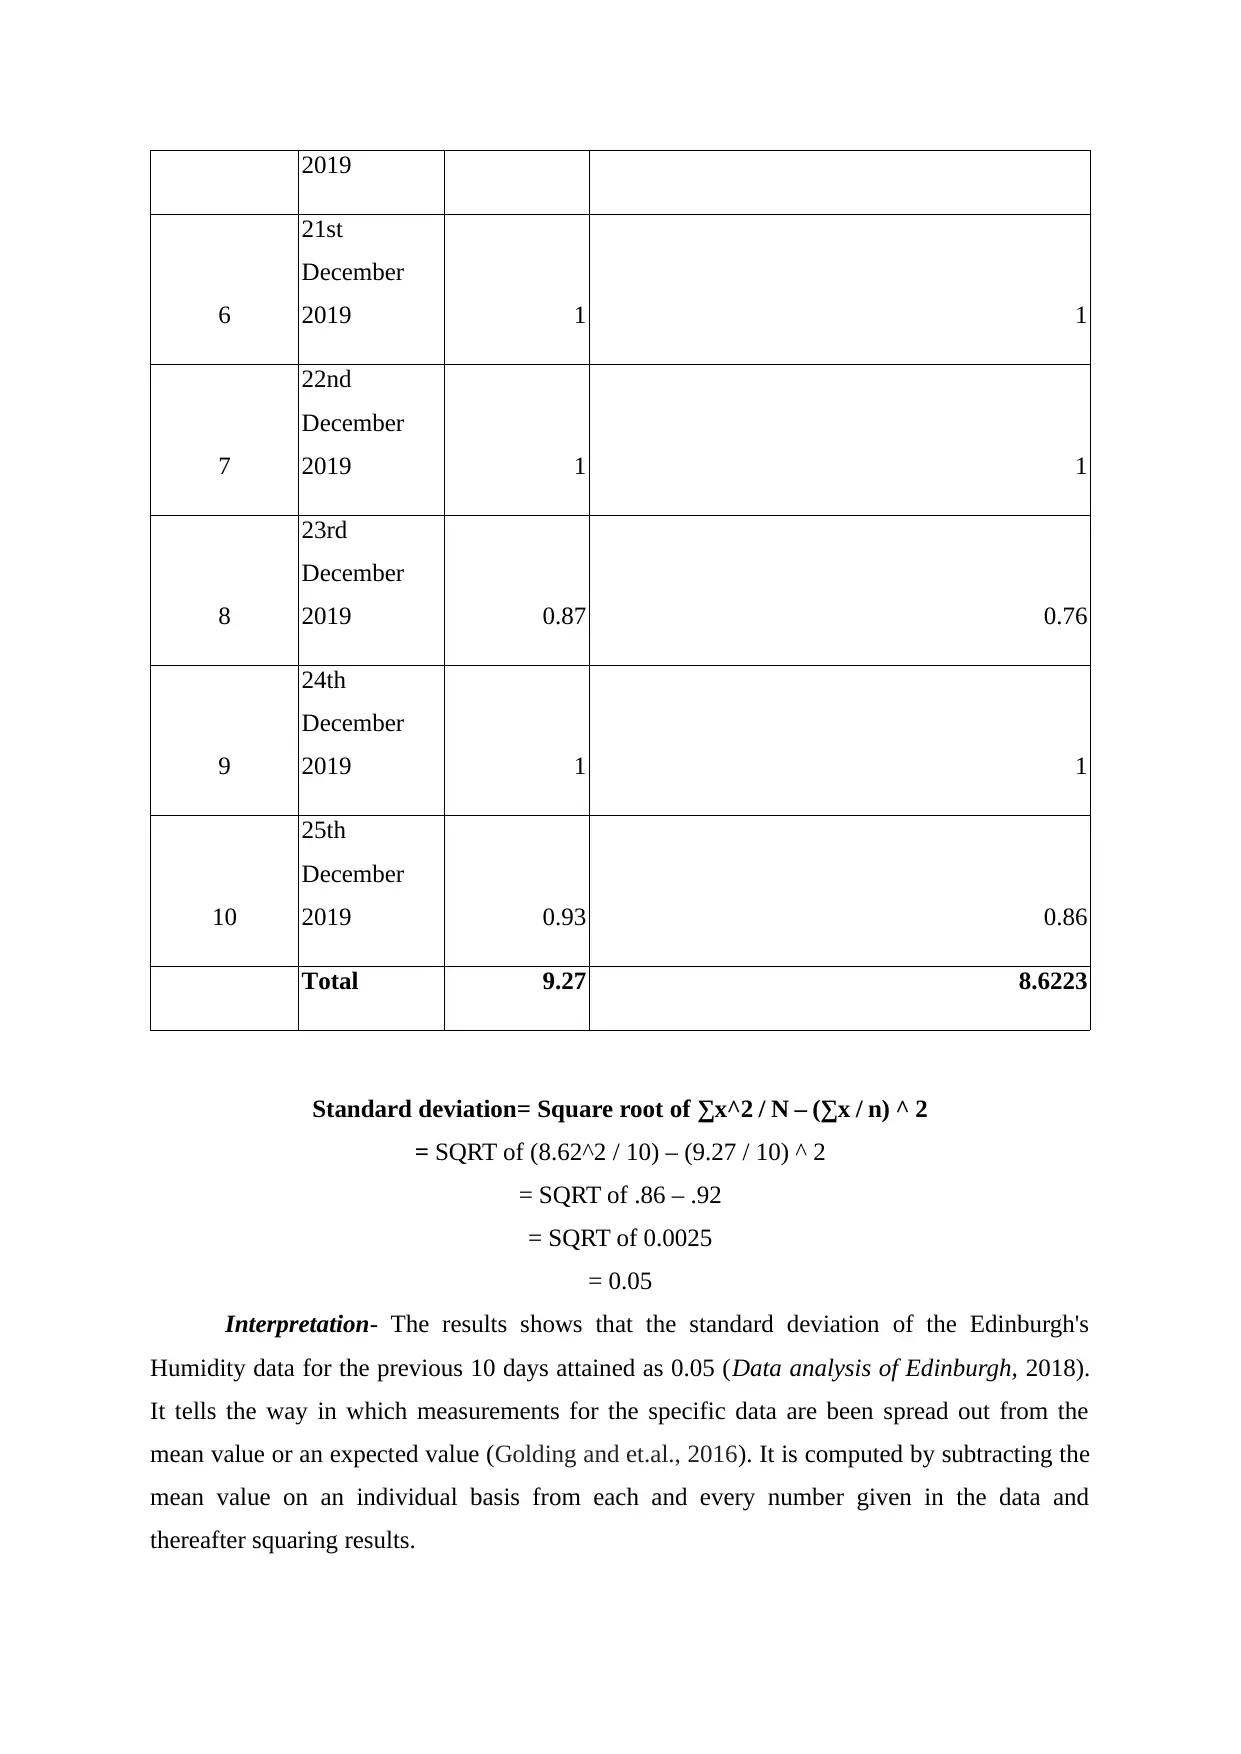
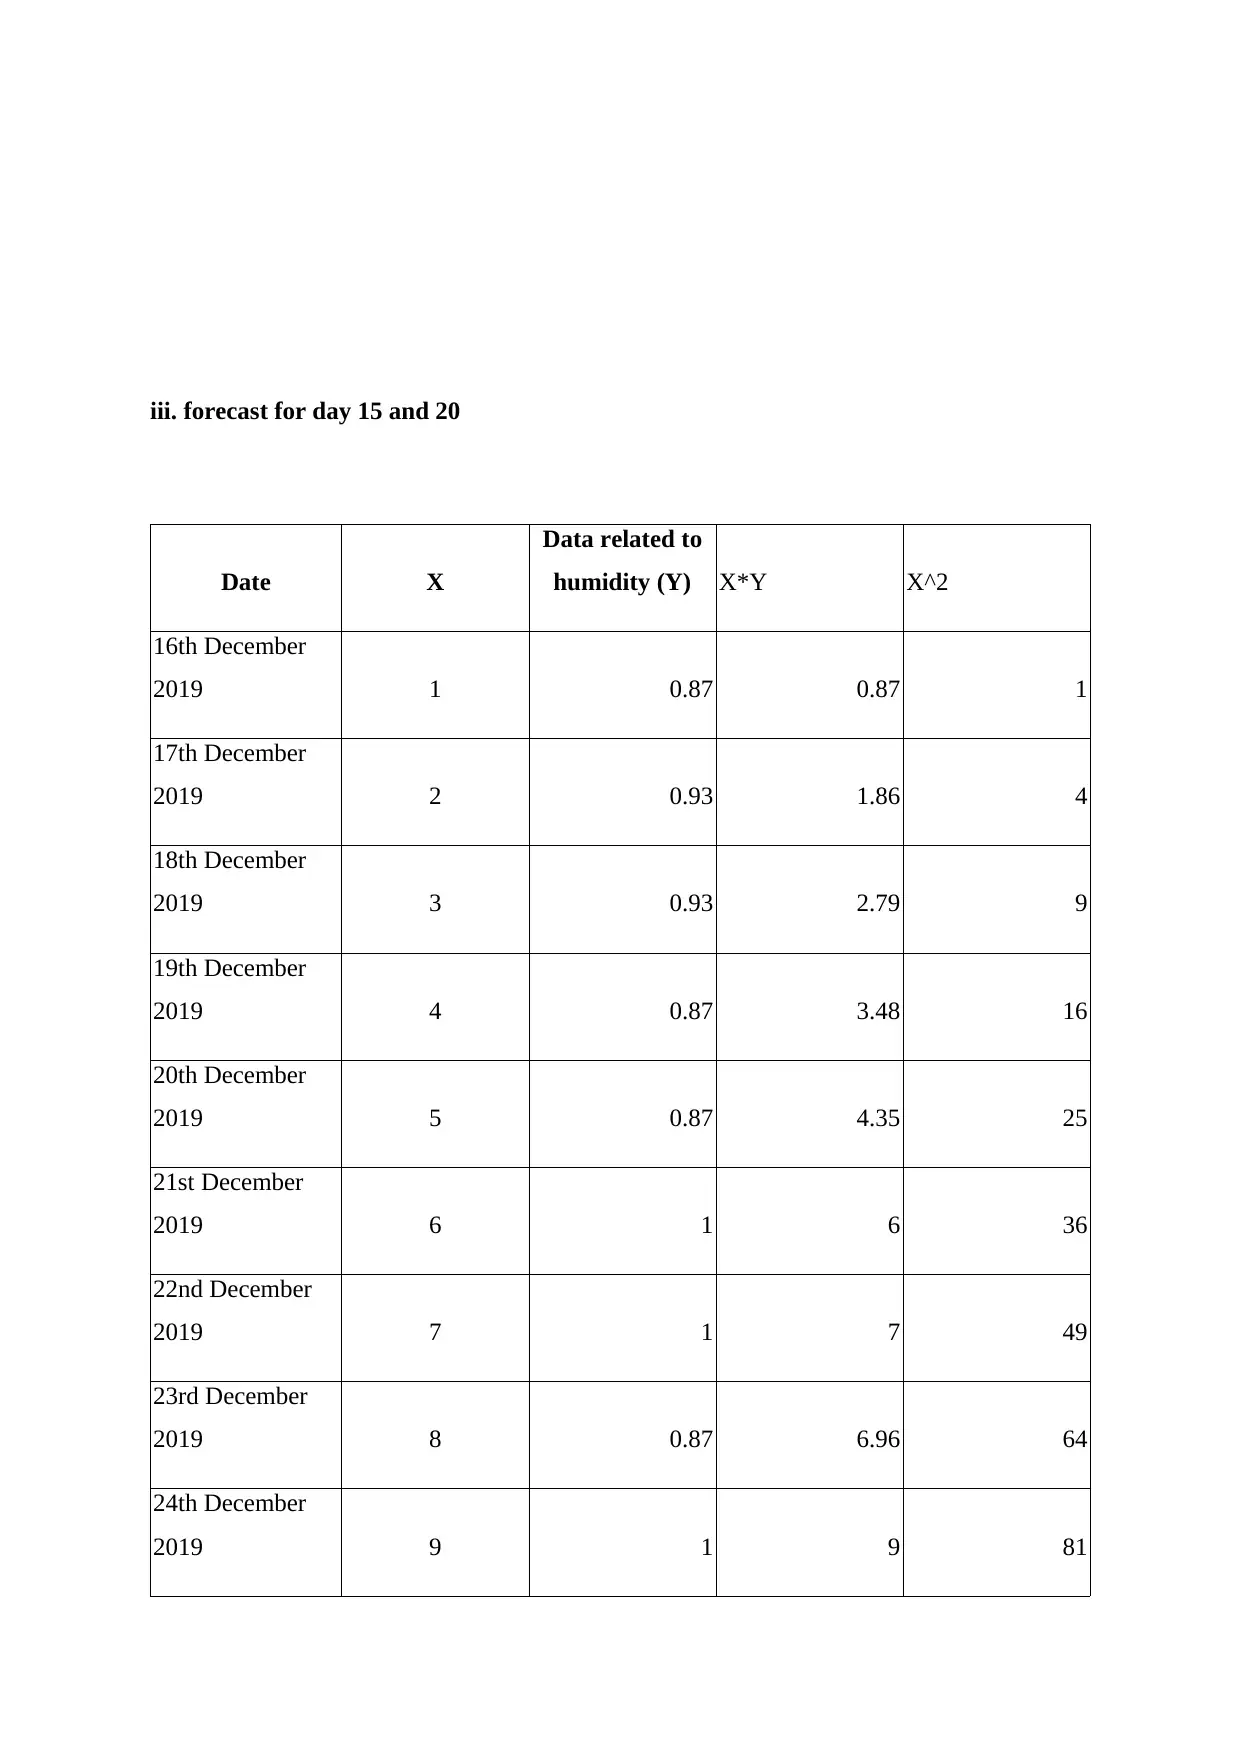
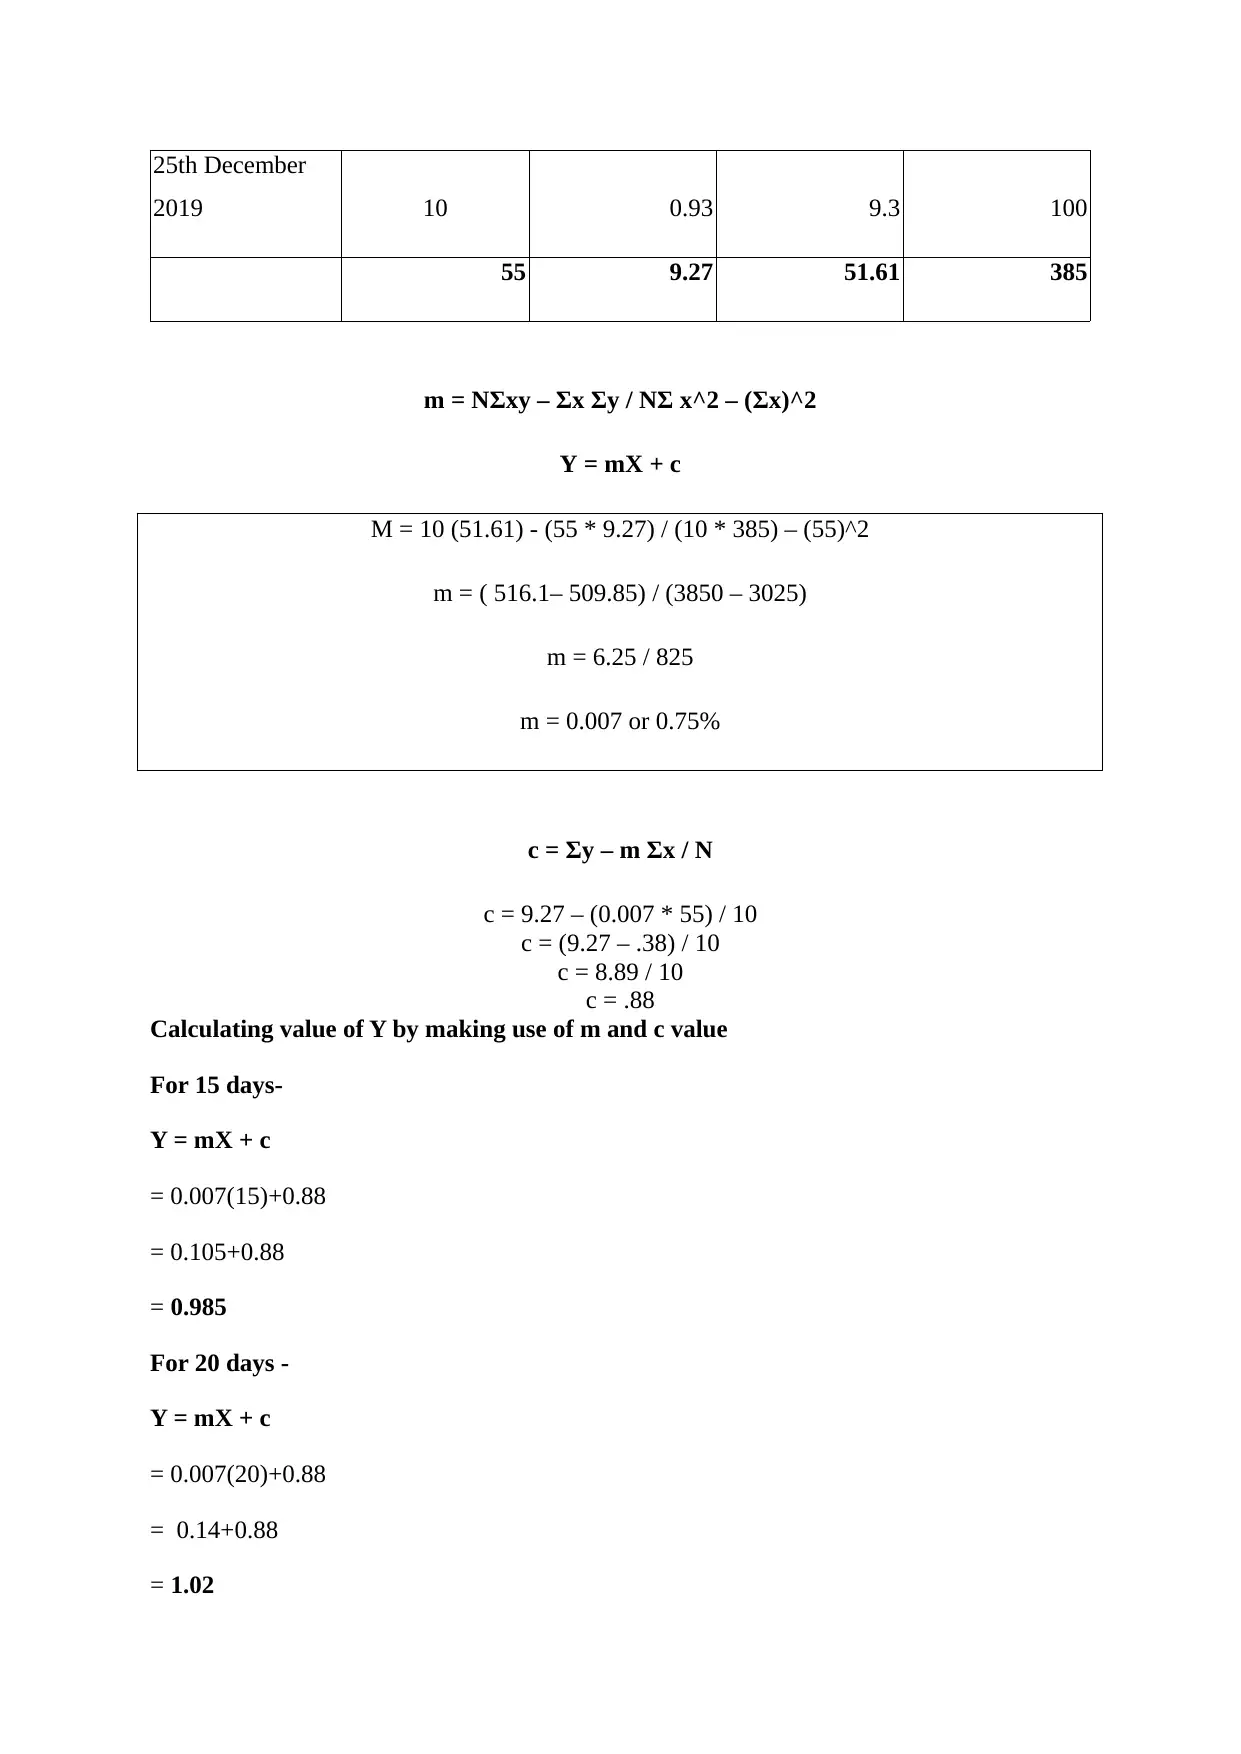
This report presents an analysis of humidity data for Edinburgh, UK, focusing on the period of December 2019. The report begins by classifying the humidity data into a table and representing it visually using a column graph. It then computes descriptive statistics, including mean, median, mode, range, and standard deviation, to understand the central tendency and variability of the data. Furthermore, the report applies a linear forecasting model to predict humidity values for the 15th and 20th days, providing insights into potential future humidity levels. The analysis includes detailed calculations and interpretations of the statistical measures, offering a comprehensive overview of the humidity trends in Edinburgh during the specified time frame.

REPORT
Secure Best Marks with AI Grader
Need help grading? Try our AI Grader for instant feedback on your assignments.

Table of Contents
INTRODUCTION......................................................................................................................3
1. classifying data into the table.............................................................................................3
2. representing data in form of chart .....................................................................................4
Column graph.........................................................................................................................4
3. computing descriptive statistics .........................................................................................5
4. Applying linear forecasting model in order to predict the value for 15th and 20th day . 9
CONCLUSION........................................................................................................................12
REFERENCES.........................................................................................................................13

INTRODUCTION
Numeracy and data analysis involves using the skills and the numbers for solving the
problems and in analyzing the data with an application of the statistical techniques (Gkatzia,
Lemon and Rieser, 2017). The present report focuses on Edinburgh, a city situated United
Kingdom. Furthermore, the report includes data regarding humidity of the last 10 days in
Edinburgh. Moreover, it involves evaluation of the descriptive statistics for the purpose of
assessing the data in a useful and meaningful manner.
1. classifying data into the table
S. No. Date
Data related to
humidity
1 16th December 2019 87.00%
2 17th December 2019 93.00%
3 18th December 2019 93.00%
4 19th December 2019 87.00%
5 20th December 2019 87.00%
6 21st December 2019 100.00%
7 22nd December 2019 100.00%
8 23rd December 2019 87.00%
9 24th December 2019 100.00%
10 25th December 2019 93.00%
Mean 0.92

Median 0.93
Mode 0.87
Range 0.13
Standard Deviation 0.05
Minimum 0.01
Maximum 0.87
2. representing data in form of chart
Line graph
0.8
0.85
0.9
0.95
1
1.05
Column G
Mode 0.87
Range 0.13
Standard Deviation 0.05
Minimum 0.01
Maximum 0.87
2. representing data in form of chart
Line graph
0.8
0.85
0.9
0.95
1
1.05
Column G
Secure Best Marks with AI Grader
Need help grading? Try our AI Grader for instant feedback on your assignments.

Column graph
3. computing descriptive statistics
i. Mean
S. No. Date Data related to humidity
1 16th December 2019 87.00%
2 17th December 2019 93.00%
3 18th December 2019 93.00%
4 19th December 2019 87.00%
5 20th December 2019 87.00%
6 21st December 2019 100.00%
16th December 2019
17th December 2019
18th December 2019
19th December 2019
20th December 2019
21st December 2019
22nd December 2019
23rd December 2019
24th December 2019
25th December 2019
0.8
0.85
0.9
0.95
1
1.05
87.00%
93.00% 93.00%
87.00% 87.00%
100.00%100.00%
87.00%
100.00%
93.00%
Column I

7 22nd December 2019 100.00%
8 23rd December 2019 87.00%
9 24th December 2019 100.00%
10 25th December 2019 93.00%
Sum of the humidity 927.00%
Total no. of observation 10
Mean 0.927
Interpretation- The above assessment shows that the value of mean resulted as 0.927
or 92% which reflects an average value of all the 10 days Humidity data of Edinburgh
(Gkatzia and et.al., 2015). Moreover, mean value is computed by dividing the sum of the
humidity data accounted as 927% with the total number of the observation that is 10 and thus
the resulted mean as 92.7%
ii. Median
Step 1:
S. No. Date Data related to humidity
1 16th December 2019 87.00%
2 17th December 2019 93.00%
3 18th December 2019 93.00%
4 19th December 2019 87.00%
5 20th December 2019 87.00%
6 21st December 2019 100.00%

7 22nd December 2019 100.00%
8 23rd December 2019 87.00%
9 24th December 2019 100.00%
10 25th December 2019 93.00%
Number of observation = 10
Median = (10 + 1) / 2
= 5.5
Median = (0.87 + 1) / 2
= 1.87 / 2
= .93 or 93%
Interpretation- As per the evaluation, median value indicates the mid value of the
data which equates to 0.93 or 93% . The median value is calculated by adding the total no. of
observation with 1 and dividing it by 2 in order to get the observation that resulting a mid
value that is 5.5 (Srivastava and et.al., 2017). Thus, as observation accounted in decimal point
so averaging the 5th and the 6th observation for finding accurate results that ascertained as
0.93 or 93%.
iii. Mode
.87 or 87%
Interpretation- From the results generated, it has been identified that value of Mode
attained as .87 or 87%. Mode is stated as the value which is repeated in the data that means
same percentage of the humidity is resulted on different days in the last 10 days of Edinburgh
weather (Srivastava and et.al., 2017). It is computed by observing the data and finding out
the value that has the highest number of repetition within the data.
iv. Range
Paraphrase This Document
Need a fresh take? Get an instant paraphrase of this document with our AI Paraphraser

Max: 100%
Min: 87%
Range: 100% – 87%
= .13 or 13%
Interpretation- From the date, value of the range evaluated as 0.13 or 13% which
reflects the difference between the maximum and the minimum value (Lovell-Smith and
et.al., 2015). Range depicts the value that leis between the maximum and the minimum
humidity data. By reducing the minimum value from the maximum value, range of the
Edinburgh's humidity data of last 10 days accounted as 0.13 or as 13%.
v. Standard deviation
S. No. Date
Data related
to humidity X^2
1
16th
December
2019 0.87 0.76
2
17th
December
2019 0.93 0.86
3
18th
December
2019 0.93 0.86
4
19th
December
2019 0.87 0.76
5 20th
December
0.87 0.76

2019
6
21st
December
2019 1 1
7
22nd
December
2019 1 1
8
23rd
December
2019 0.87 0.76
9
24th
December
2019 1 1
10
25th
December
2019 0.93 0.86
Total 9.27 8.6223
Standard deviation= Square root of ∑x^2 / N – (∑x / n) ^ 2
= SQRT of (8.62^2 / 10) – (9.27 / 10) ^ 2
= SQRT of .86 – .92
= SQRT of 0.0025
= 0.05
Interpretation- The results shows that the standard deviation of the Edinburgh's
Humidity data for the previous 10 days attained as 0.05 (Data analysis of Edinburgh, 2018).
It tells the way in which measurements for the specific data are been spread out from the
mean value or an expected value (Golding and et.al., 2016). It is computed by subtracting the
mean value on an individual basis from each and every number given in the data and
thereafter squaring results.

4. Applying linear forecasting model in order to predict the value for 15th and 20th day
Secure Best Marks with AI Grader
Need help grading? Try our AI Grader for instant feedback on your assignments.

iii. forecast for day 15 and 20
Date X
Data related to
humidity (Y) X*Y X^2
16th December
2019 1 0.87 0.87 1
17th December
2019 2 0.93 1.86 4
18th December
2019 3 0.93 2.79 9
19th December
2019 4 0.87 3.48 16
20th December
2019 5 0.87 4.35 25
21st December
2019 6 1 6 36
22nd December
2019 7 1 7 49
23rd December
2019 8 0.87 6.96 64
24th December
2019 9 1 9 81

25th December
2019 10 0.93 9.3 100
55 9.27 51.61 385
m = NΣxy – Σx Σy / NΣ x^2 – (Σx)^2
Y = mX + c
M = 10 (51.61) - (55 * 9.27) / (10 * 385) – (55)^2
m = ( 516.1– 509.85) / (3850 – 3025)
m = 6.25 / 825
m = 0.007 or 0.75%
c = Σy – m Σx / N
c = 9.27 – (0.007 * 55) / 10
c = (9.27 – .38) / 10
c = 8.89 / 10
c = .88
Calculating value of Y by making use of m and c value
For 15 days-
Y = mX + c
= 0.007(15)+0.88
= 0.105+0.88
= 0.985
For 20 days -
Y = mX + c
= 0.007(20)+0.88
= 0.14+0.88
= 1.02

Interpretation- By solving the equation that is Y = mX + c through application of the
linear forecasting model the humidity anticipated for 15th day as 0.985 and for the 20th day as
1.02. This is been calculated by solving an equation for evaluating the value of m and c and
thereafter putting the resulted value of m and c in computing Y (Vasiljević-Toskić and et.al.,
2019). m value is multiplied by number of days and then the accounted figure is added in the
value of c for the purpose of forecasting the humidity for coming 15th and 20th day.
CONCLUSION
By summarizing the above study, it is interpreted that humidity forecast of Edinburgh
in last 10 days resulted an increasing trend which means that humidity has and will be
increasing in the future climate of Edinburgh, UK (Davies and et.al., 2016). Employing of
statistical tools enables in finding out the average that is mean, mid value that is median,
repeated value that mode and range that is difference value of highest and lowest percentage
of humidity.
Paraphrase This Document
Need a fresh take? Get an instant paraphrase of this document with our AI Paraphraser

REFERENCES
Books and journals
Davies, G. M. and et.al., 2016. Vegetation structure and fire weather influence variation in
burn severity and fuel consumption during peatland wildfires. Biogeosciences. 12(18).
pp.15737-15762.
Gkatzia, D. and et.al., 2015. A game-based setup for data collection and task-based
evaluation of uncertain information presentation. In Proceedings of the 15th European
Workshop on Natural Language Generation (ENLG) (pp. 112-113).
Gkatzia, D., Lemon, O. and Rieser, V., 2017. Data-to-text generation improves decision-
making under uncertainty. IEEE Computational Intelligence Magazine.12(3). pp.10-17.
Golding, B. and et.al., 2016. MOGREPS-UK convection-permitting ensemble products for
surface water flood forecasting: Rationale and first results. Journal of
Hydrometeorology. 17(5). pp.1383-1406.
Lovell-Smith, J. W. and et.al., 2015. Metrological challenges for measurements of key
climatological observables. Part 4: atmospheric relative humidity. Metrologia. 53(1).
p.R40.
Srivastava, P. and et.al., 2017. Reference Evapotranspiration Retrievals from a Mesoscale
Model Based Weather Variables for Soil Moisture Deficit
Estimation. Sustainability. 9(11). p.1971.
Vasiljević-Toskić, M. and et.al., 2019, July. Wireless Weather Station with No Moving Parts.
In IEEE EUROCON 2019-18th International Conference on Smart Technologies (pp. 1-
5). IEEE.
Online
Data analysis of Edinburgh. 2018. [Online]. Avaialble
through:<https://www.timeanddate.com/weather/uk/bristol/historic>

1 out of 15

Your All-in-One AI-Powered Toolkit for Academic Success.
+13062052269
info@desklib.com
Available 24*7 on WhatsApp / Email
Unlock your academic potential
© 2024 | Zucol Services PVT LTD | All rights reserved.