Statistical Analysis of Employee Engagement: Assignment Solution
VerifiedAdded on 2022/12/28
|10
|1174
|85
Homework Assignment
AI Summary
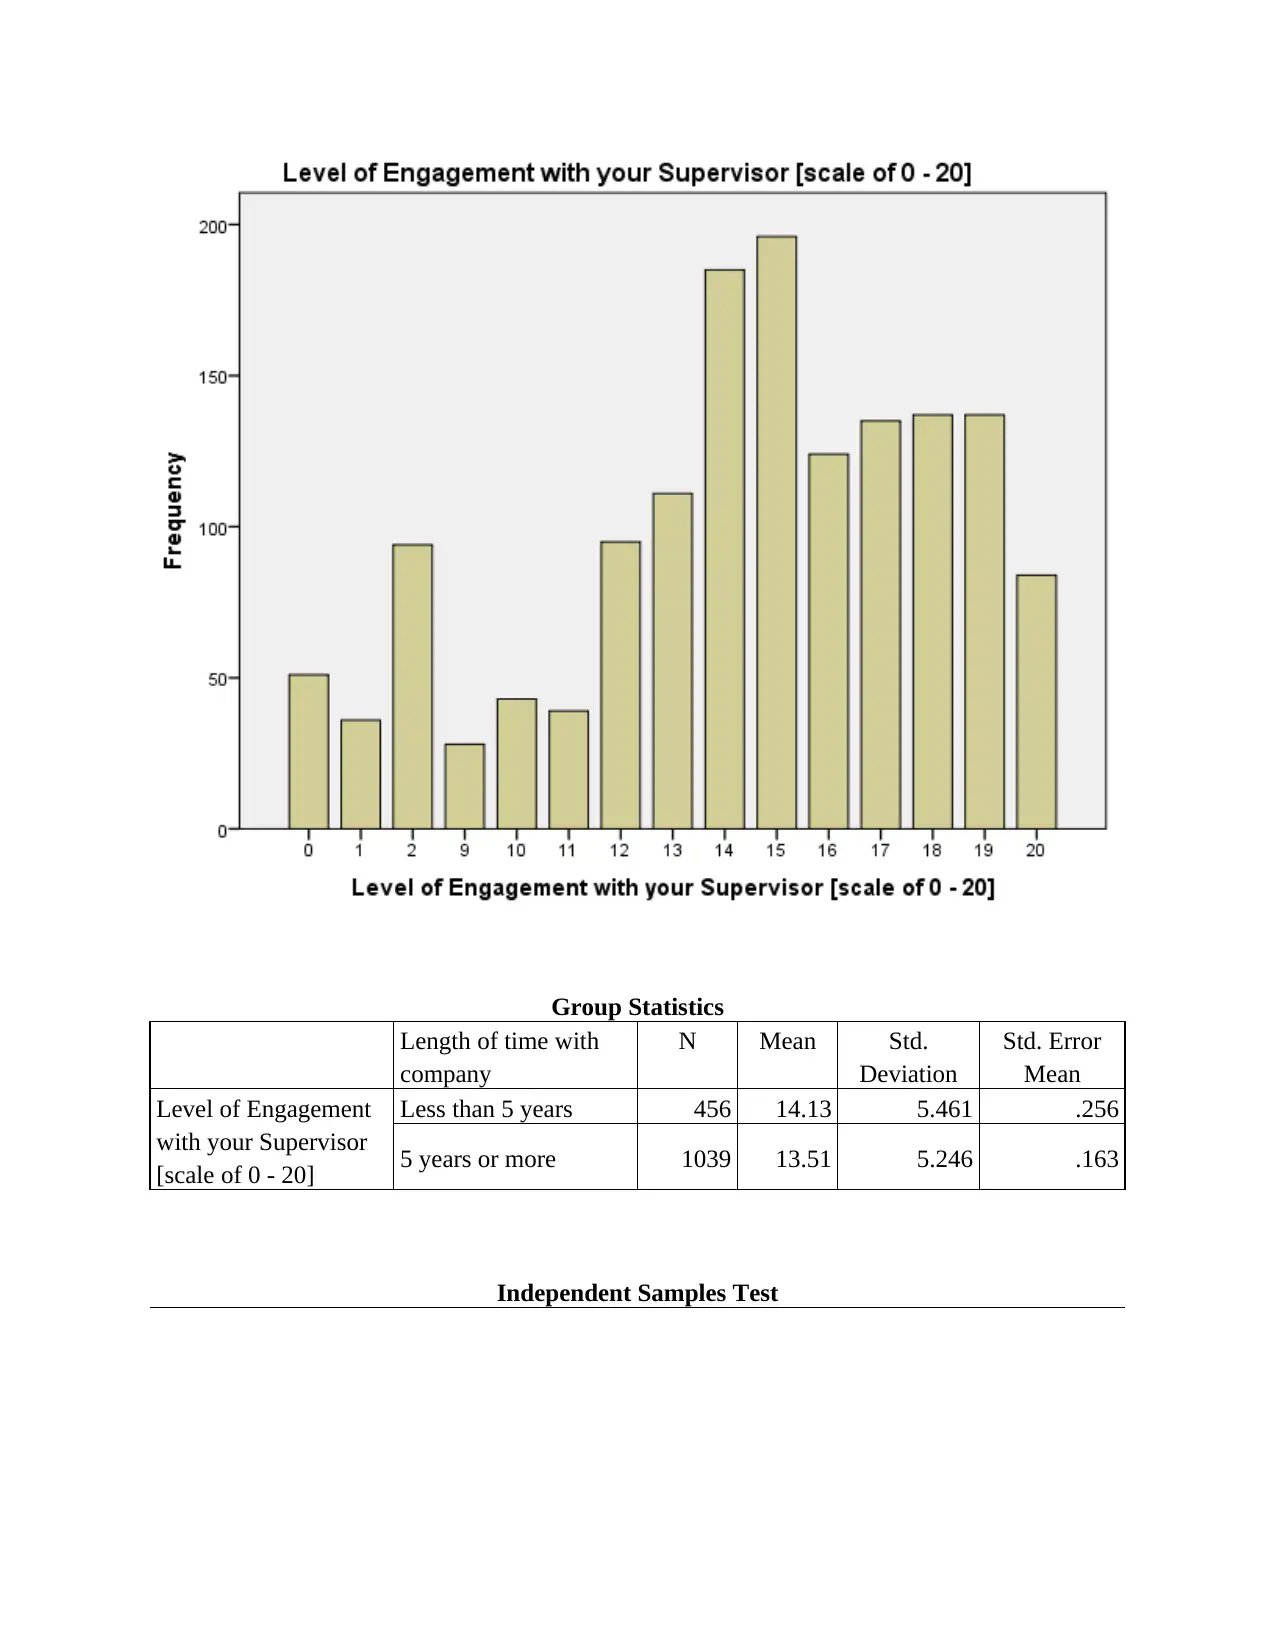
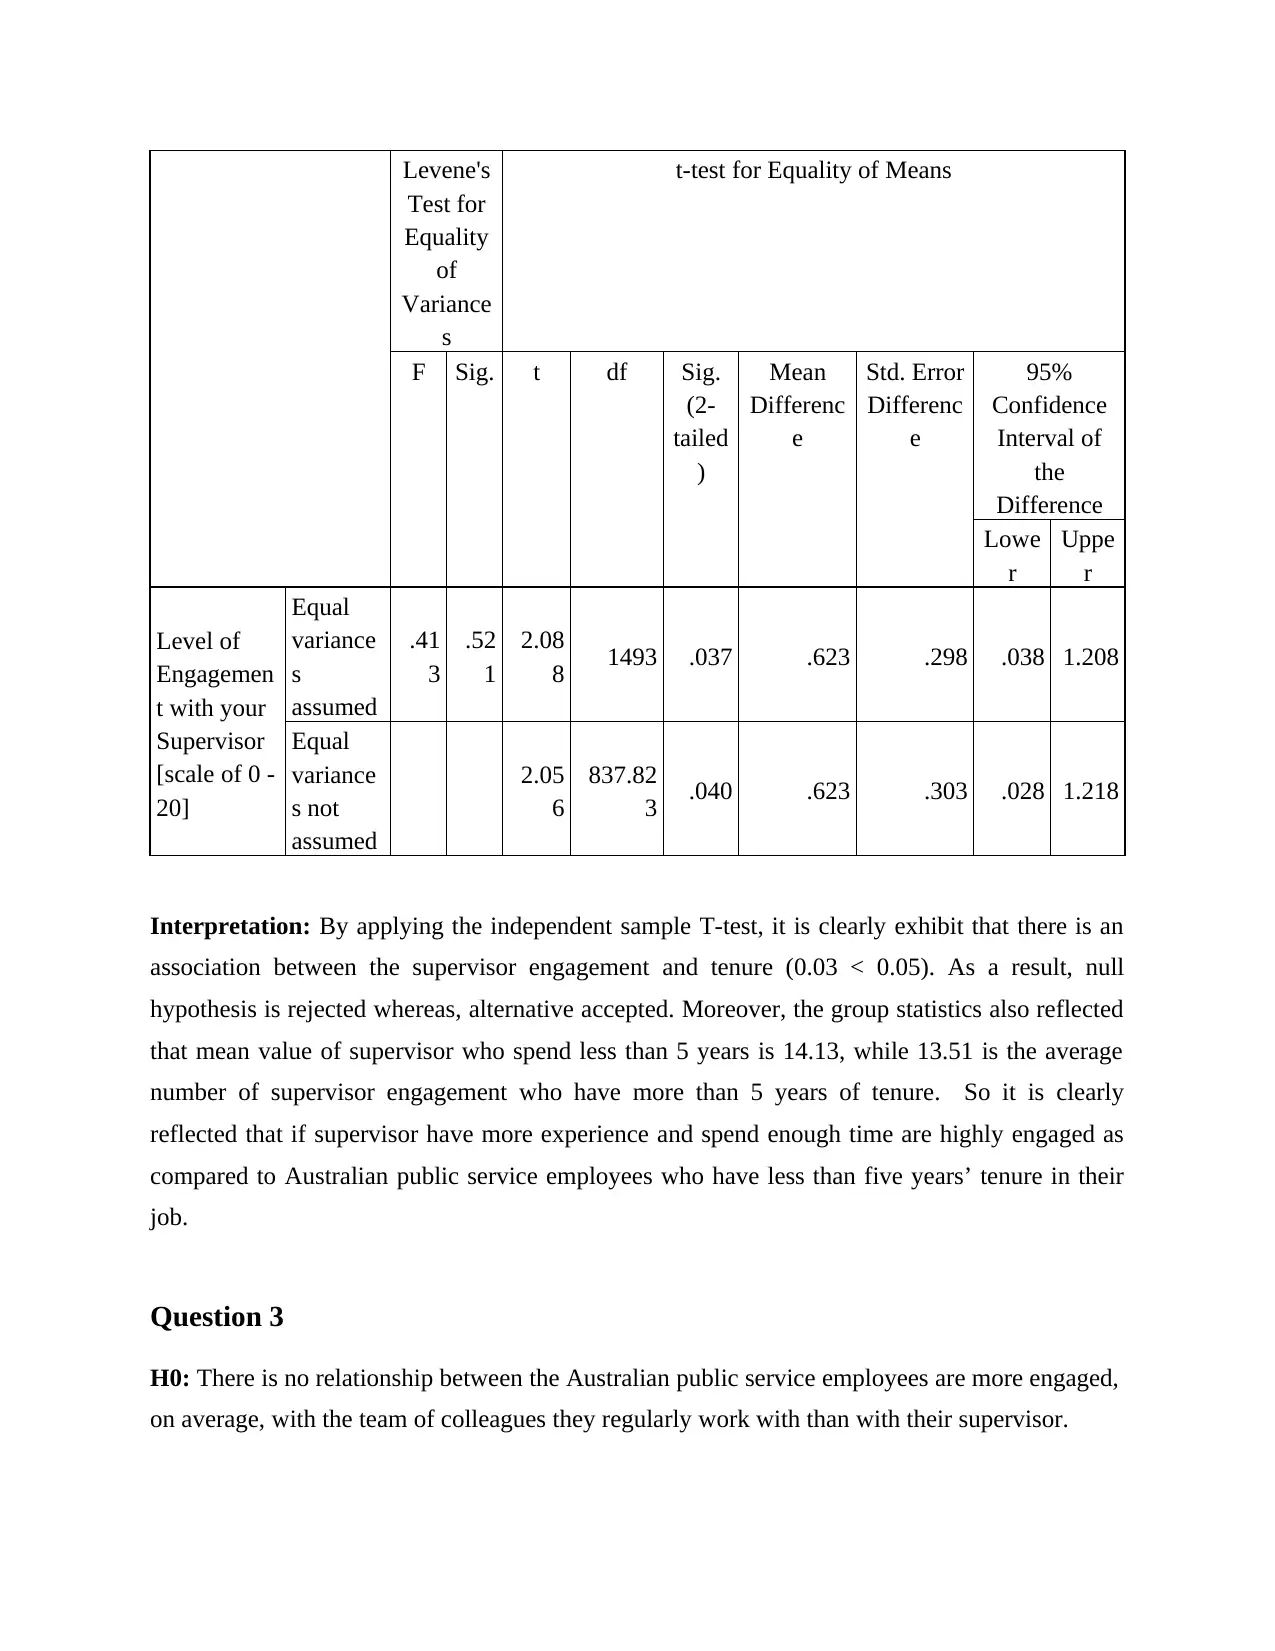
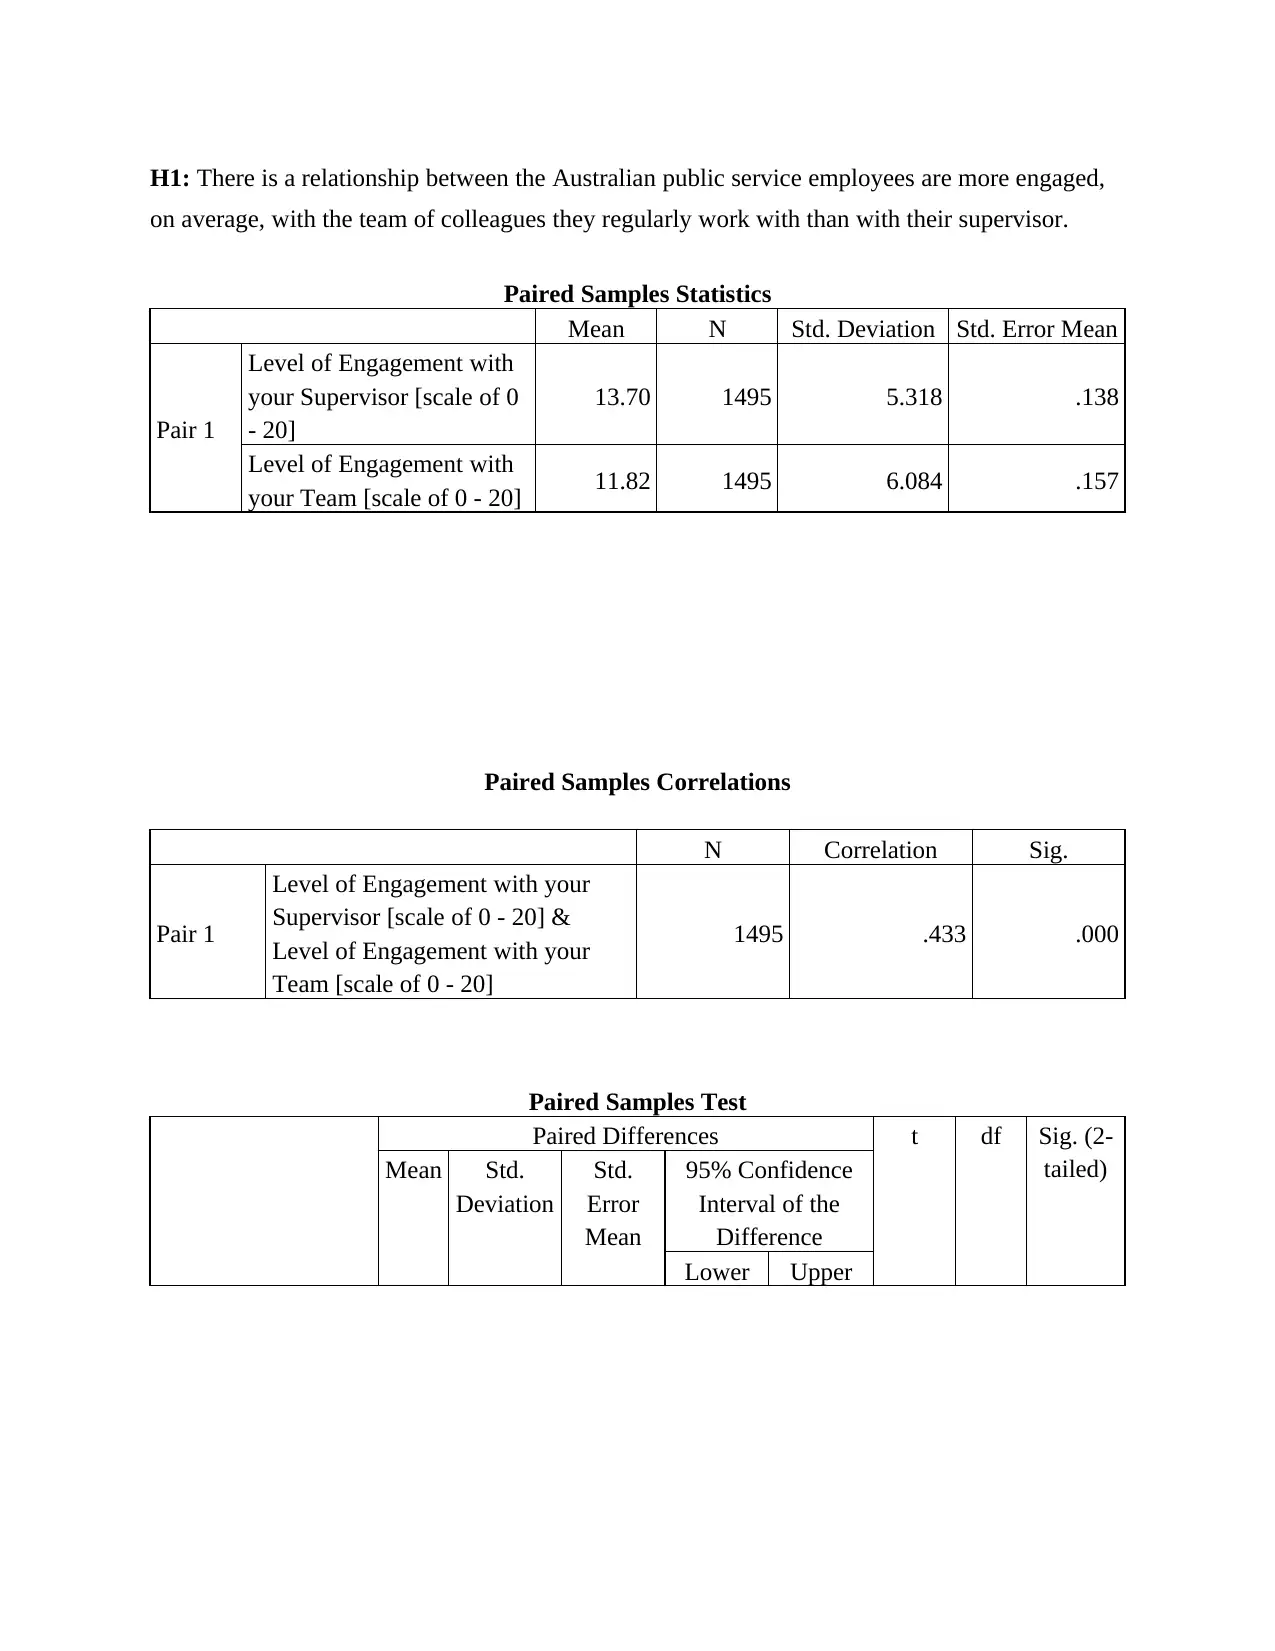
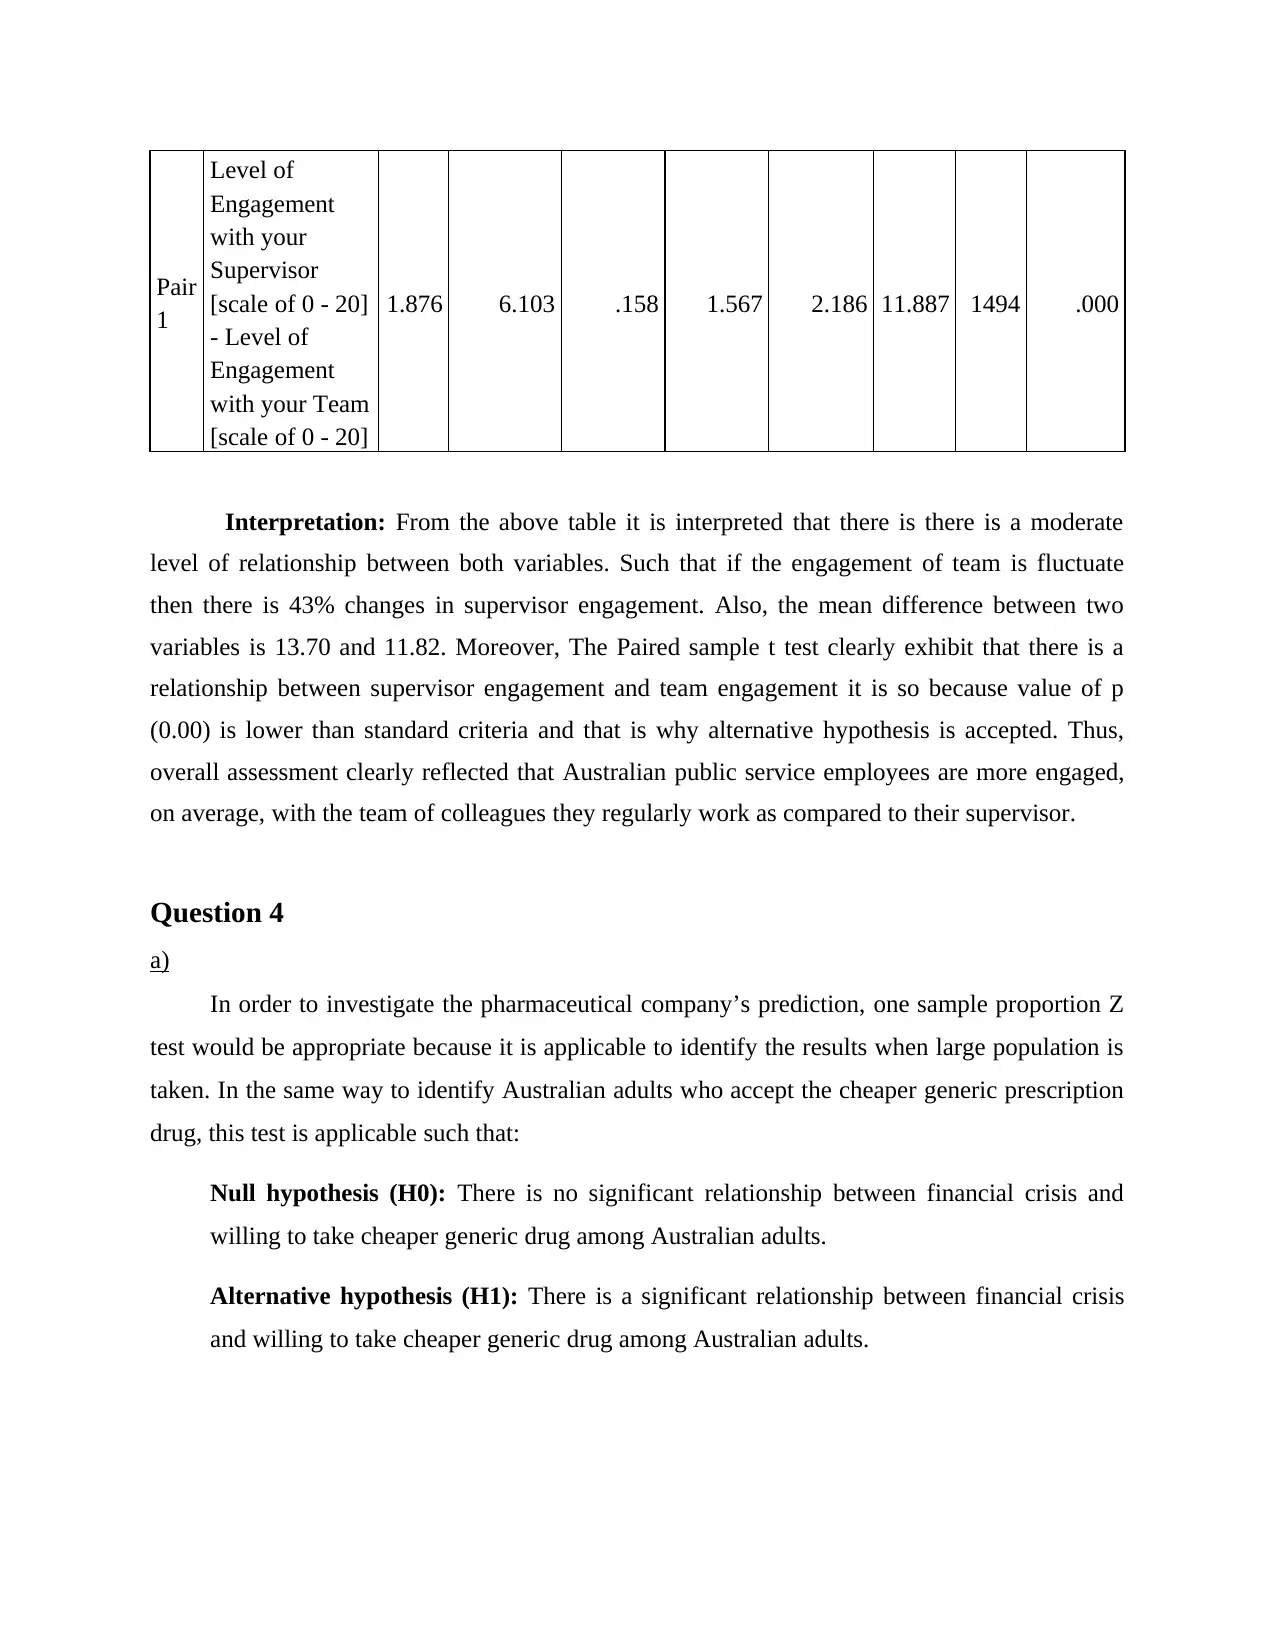
This statistics assignment analyzes employee engagement within an Australian public service context. It begins with a one-sample t-test to determine the relationship between team engagement and employee engagement, concluding that there is a significant positive relationship. The assignment then uses an independent samples t-test to compare the engagement levels of employees with varying tenures, finding that employees with less than five years of tenure are more engaged with their supervisors. A paired samples t-test investigates the relationship between supervisor and team engagement, revealing that employees are more engaged with their teams. Finally, the assignment discusses the appropriate statistical test (one-sample proportion Z-test) for analyzing the acceptance of cheaper generic drugs, and validates the pharmaceutical company's conclusion based on the p-value, confirming that financial crises do not significantly impact the acceptance rate.

Assessment
Paraphrase This Document
Need a fresh take? Get an instant paraphrase of this document with our AI Paraphraser

Table of Contents
Question 1........................................................................................................................................2
Question 2........................................................................................................................................3
Question 3........................................................................................................................................4
Question 4........................................................................................................................................6
a)..................................................................................................................................................6
b)..................................................................................................................................................6
c)..................................................................................................................................................6

Question 1
Null hypothesis (H0): There is no difference between the mean value of team engagement with
employee engagement
Alternative hypothesis (H1): There is a difference between the mean value of team engagement
with employee engagement
One-Sample Statistics
N Mean Std. Deviation Std. Error
Mean
Level of Engagement with
your Team [scale of 0 -
20]
1500 11.83 6.081 .157
⊘ This is a preview!⊘
Do you want full access?
Subscribe today to unlock all pages.

Trusted by 1+ million students worldwide

One-Sample Test
Test Value = 0
t df Sig. (2-
tailed)
Mean
Difference
95% Confidence Interval
of the Difference
Lower Upper
Level of Engagement
with your Team
[scale of 0 - 20]
75.328 1499 .000 11.828 11.52 12.14
Interpretation: From the above table, it is interpreted that the average number of total
selected sample is 11.83 and there is a significant relationship between both variables because
value of p is 0.00 which is lower than 0.05 and that is why, alternative hypothesis is accepted
over another. So it is stated that due to team engagement, majority of the team are regularly
engaged and as a result, their performance is also increases.
Question 2
Null hypothesis (H0): There is no association between Australian public service employees who
have less than five years’ tenure in their job are more engaged with their supervisor than
Australian public service employees who have five years or more tenure.
Alternative hypothesis (H1): There is an association between Australian public service
employees who have less than five years’ tenure in their job are more engaged with their
supervisor than Australian public service employees who have five years or more tenure.
Paraphrase This Document
Need a fresh take? Get an instant paraphrase of this document with our AI Paraphraser


Group Statistics
Length of time with
company
N Mean Std.
Deviation
Std. Error
Mean
Level of Engagement
with your Supervisor
[scale of 0 - 20]
Less than 5 years 456 14.13 5.461 .256
5 years or more 1039 13.51 5.246 .163
Independent Samples Test
Length of time with
company
N Mean Std.
Deviation
Std. Error
Mean
Level of Engagement
with your Supervisor
[scale of 0 - 20]
Less than 5 years 456 14.13 5.461 .256
5 years or more 1039 13.51 5.246 .163
Independent Samples Test
⊘ This is a preview!⊘
Do you want full access?
Subscribe today to unlock all pages.

Trusted by 1+ million students worldwide

Levene's
Test for
Equality
of
Variance
s
t-test for Equality of Means
F Sig. t df Sig.
(2-
tailed
)
Mean
Differenc
e
Std. Error
Differenc
e
95%
Confidence
Interval of
the
Difference
Lowe
r
Uppe
r
Level of
Engagemen
t with your
Supervisor
[scale of 0 -
20]
Equal
variance
s
assumed
.41
3
.52
1
2.08
8 1493 .037 .623 .298 .038 1.208
Equal
variance
s not
assumed
2.05
6
837.82
3 .040 .623 .303 .028 1.218
Interpretation: By applying the independent sample T-test, it is clearly exhibit that there is an
association between the supervisor engagement and tenure (0.03 < 0.05). As a result, null
hypothesis is rejected whereas, alternative accepted. Moreover, the group statistics also reflected
that mean value of supervisor who spend less than 5 years is 14.13, while 13.51 is the average
number of supervisor engagement who have more than 5 years of tenure. So it is clearly
reflected that if supervisor have more experience and spend enough time are highly engaged as
compared to Australian public service employees who have less than five years’ tenure in their
job.
Question 3
H0: There is no relationship between the Australian public service employees are more engaged,
on average, with the team of colleagues they regularly work with than with their supervisor.
Paraphrase This Document
Need a fresh take? Get an instant paraphrase of this document with our AI Paraphraser

H1: There is a relationship between the Australian public service employees are more engaged,
on average, with the team of colleagues they regularly work with than with their supervisor.
Paired Samples Statistics
Mean N Std. Deviation Std. Error Mean
Pair 1
Level of Engagement with
your Supervisor [scale of 0
- 20]
13.70 1495 5.318 .138
Level of Engagement with
your Team [scale of 0 - 20] 11.82 1495 6.084 .157
Paired Samples Correlations
N Correlation Sig.
Pair 1
Level of Engagement with your
Supervisor [scale of 0 - 20] &
Level of Engagement with your
Team [scale of 0 - 20]
1495 .433 .000
Paired Samples Test
Paired Differences t df Sig. (2-
tailed)Mean Std.
Deviation
Std.
Error
Mean
95% Confidence
Interval of the
Difference
Lower Upper

Pair
1
Level of
Engagement
with your
Supervisor
[scale of 0 - 20]
- Level of
Engagement
with your Team
[scale of 0 - 20]
1.876 6.103 .158 1.567 2.186 11.887 1494 .000
Interpretation: From the above table it is interpreted that there is there is a moderate
level of relationship between both variables. Such that if the engagement of team is fluctuate
then there is 43% changes in supervisor engagement. Also, the mean difference between two
variables is 13.70 and 11.82. Moreover, The Paired sample t test clearly exhibit that there is a
relationship between supervisor engagement and team engagement it is so because value of p
(0.00) is lower than standard criteria and that is why alternative hypothesis is accepted. Thus,
overall assessment clearly reflected that Australian public service employees are more engaged,
on average, with the team of colleagues they regularly work as compared to their supervisor.
Question 4
a)
In order to investigate the pharmaceutical company’s prediction, one sample proportion Z
test would be appropriate because it is applicable to identify the results when large population is
taken. In the same way to identify Australian adults who accept the cheaper generic prescription
drug, this test is applicable such that:
Null hypothesis (H0): There is no significant relationship between financial crisis and
willing to take cheaper generic drug among Australian adults.
Alternative hypothesis (H1): There is a significant relationship between financial crisis
and willing to take cheaper generic drug among Australian adults.
⊘ This is a preview!⊘
Do you want full access?
Subscribe today to unlock all pages.

Trusted by 1+ million students worldwide

b)
In order to draw conclusion about this study, scholar can use Australian adults so that it
will help to examine whether they would accept a cheaper generic prescription drug or not.
c)
Yes, the conclusion provided by Pharmaceutical company is valid because there is a no
significant relationship between the variables. Such that the p value of reflected (0.11) which is
greater than 0.05 and that is why null hypothesis is accepted over another. That is why, the
standard criteria clearly show that percentage of Australian adults willing to take a cheaper
generic prescription drug has remained the same, exactly 48%. Hence there is no fluctuation due
to financial crisis among the adults as the result showed and drug will be sold at the same rate as
well.
1 out of 10