Comprehensive Statistical Analysis of Humidity Data in Bradford, UK

Verified

Added on  2023/01/16

|9
|1504
|57
Report
AI Summary
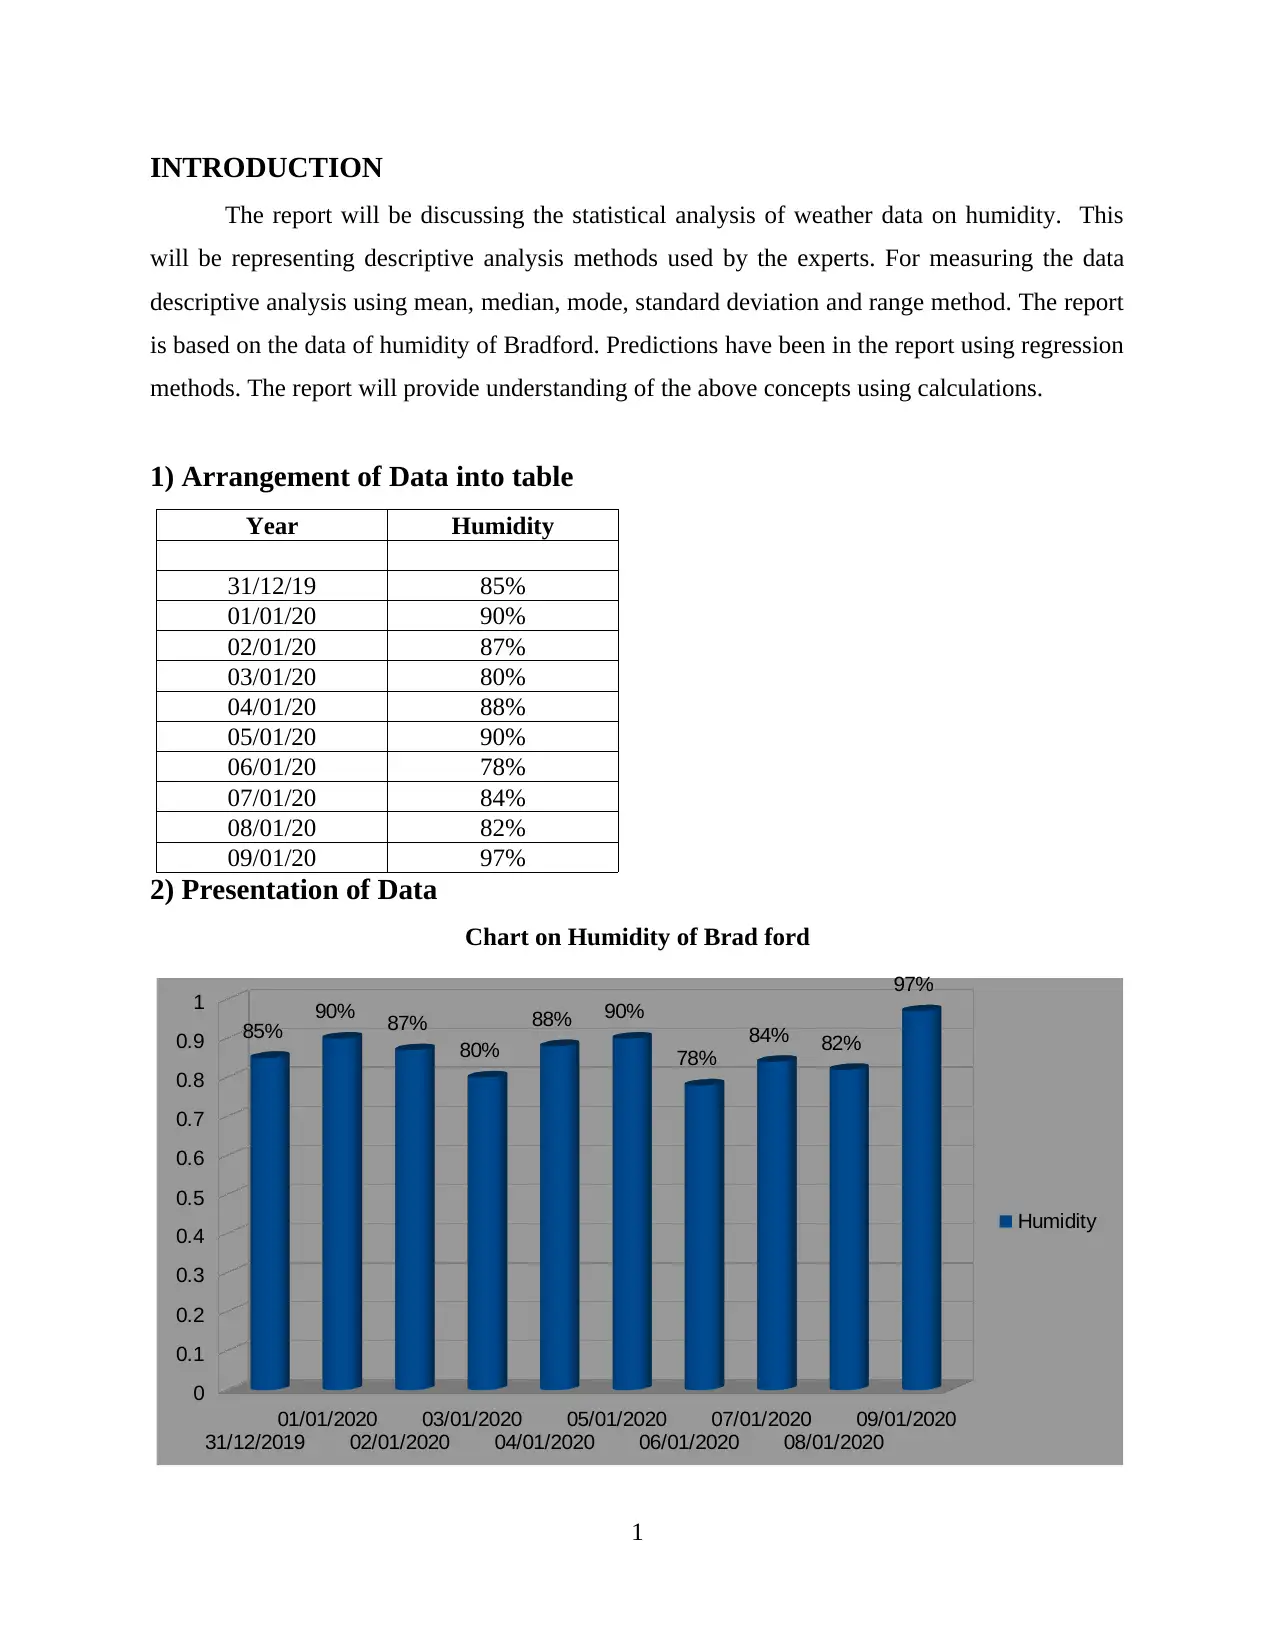
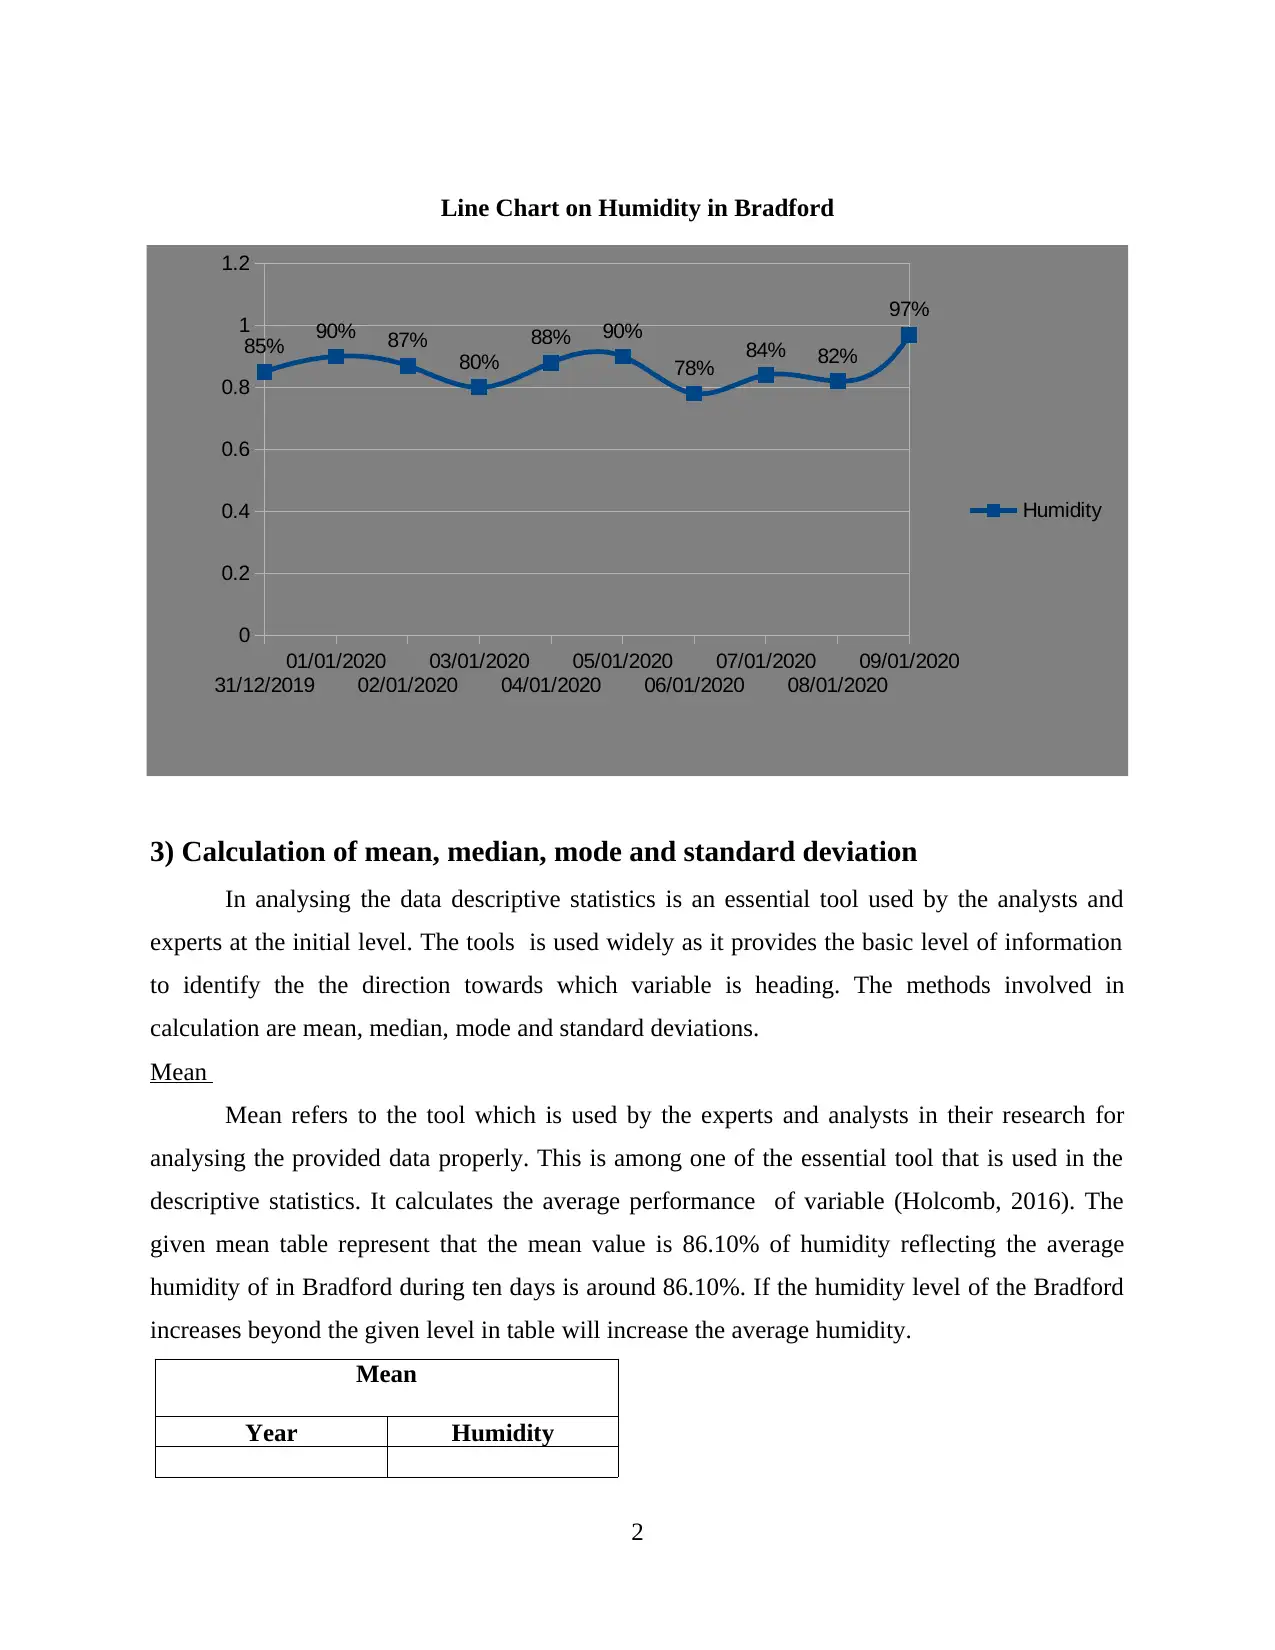
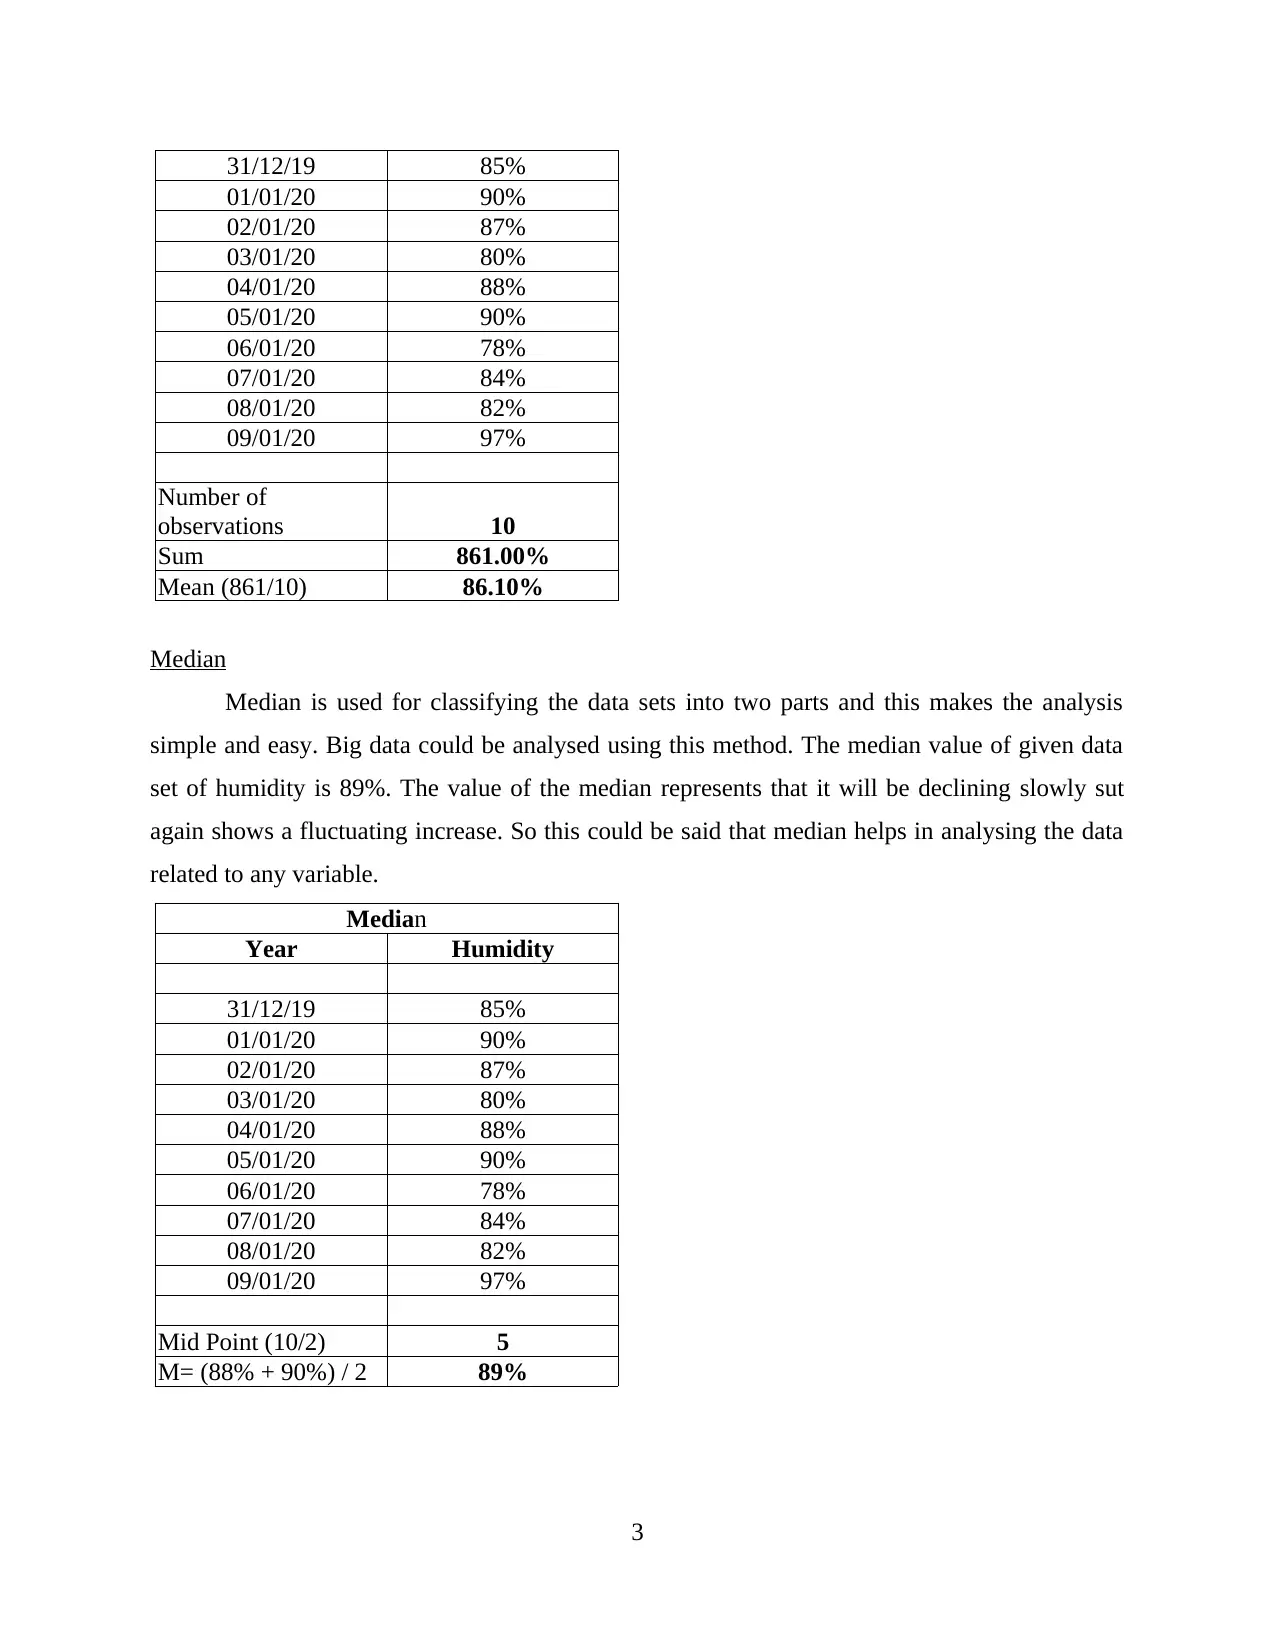
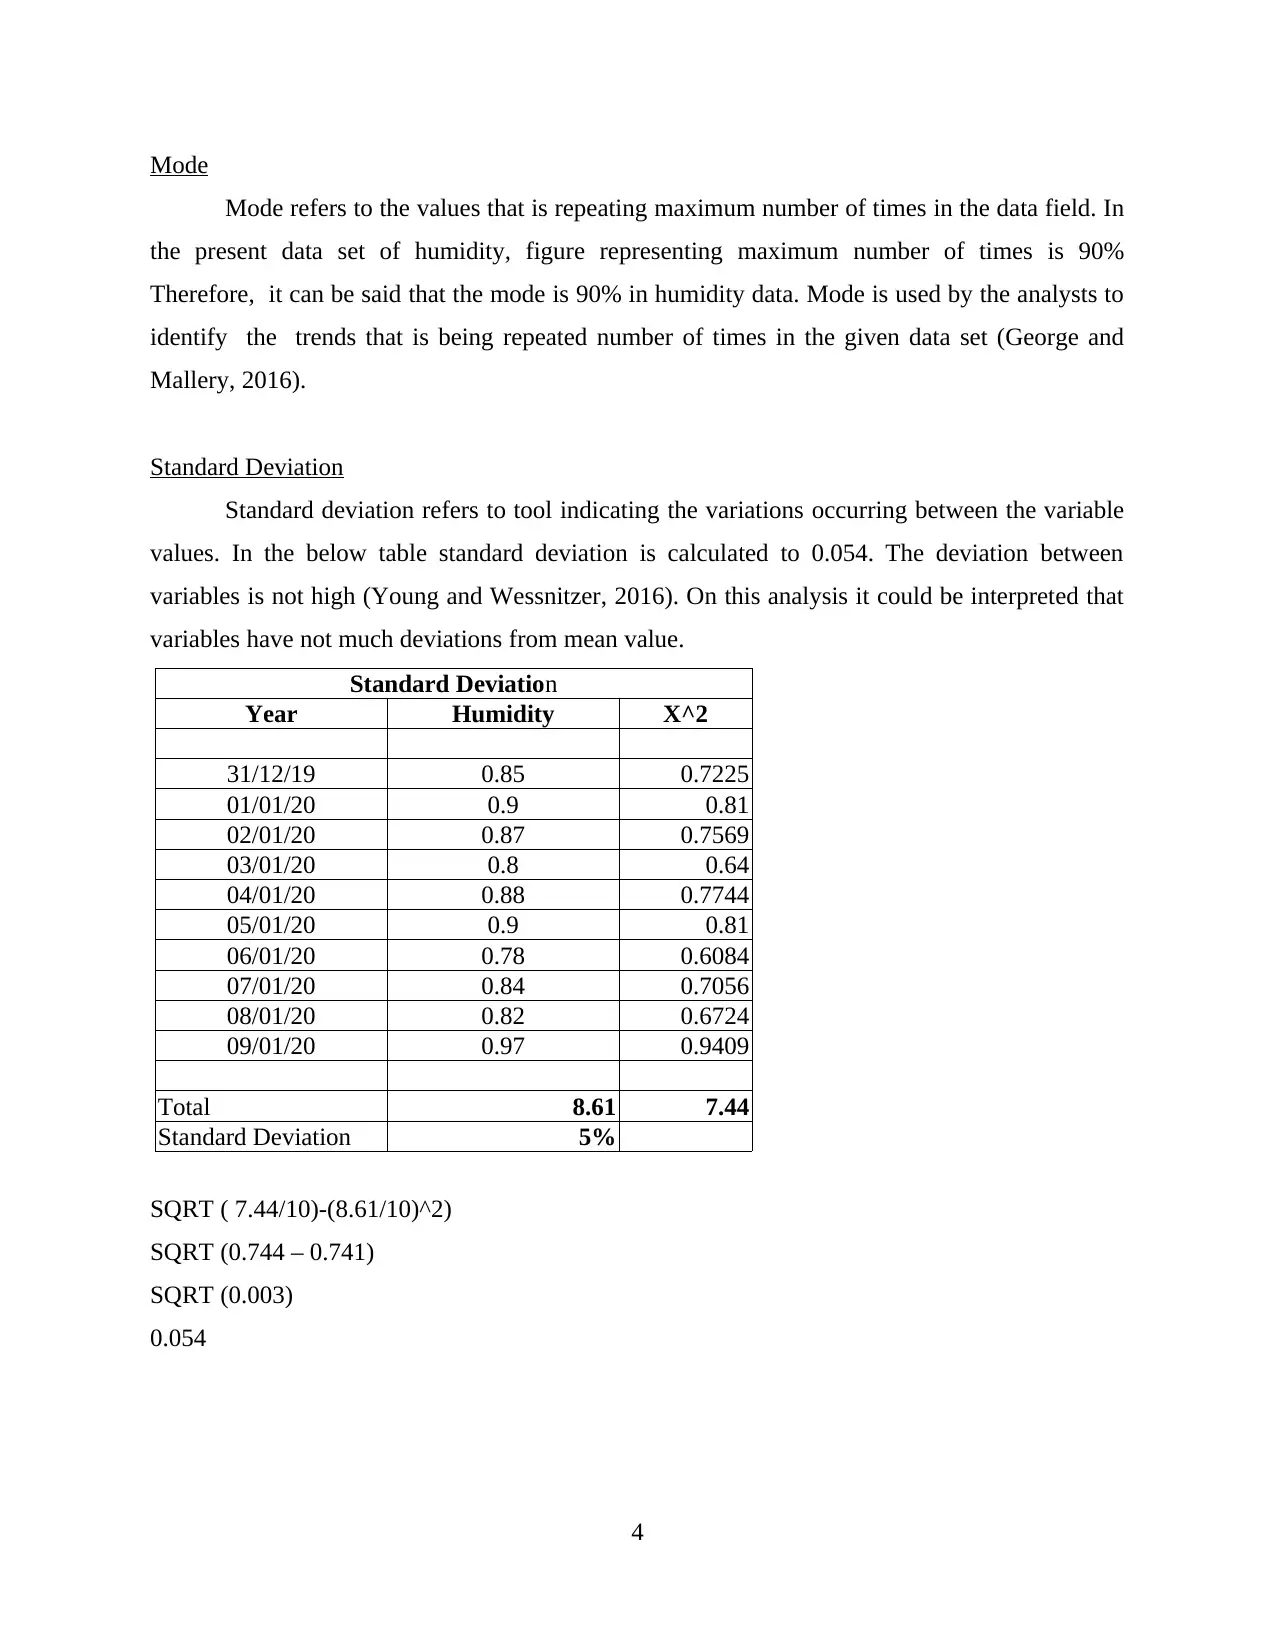
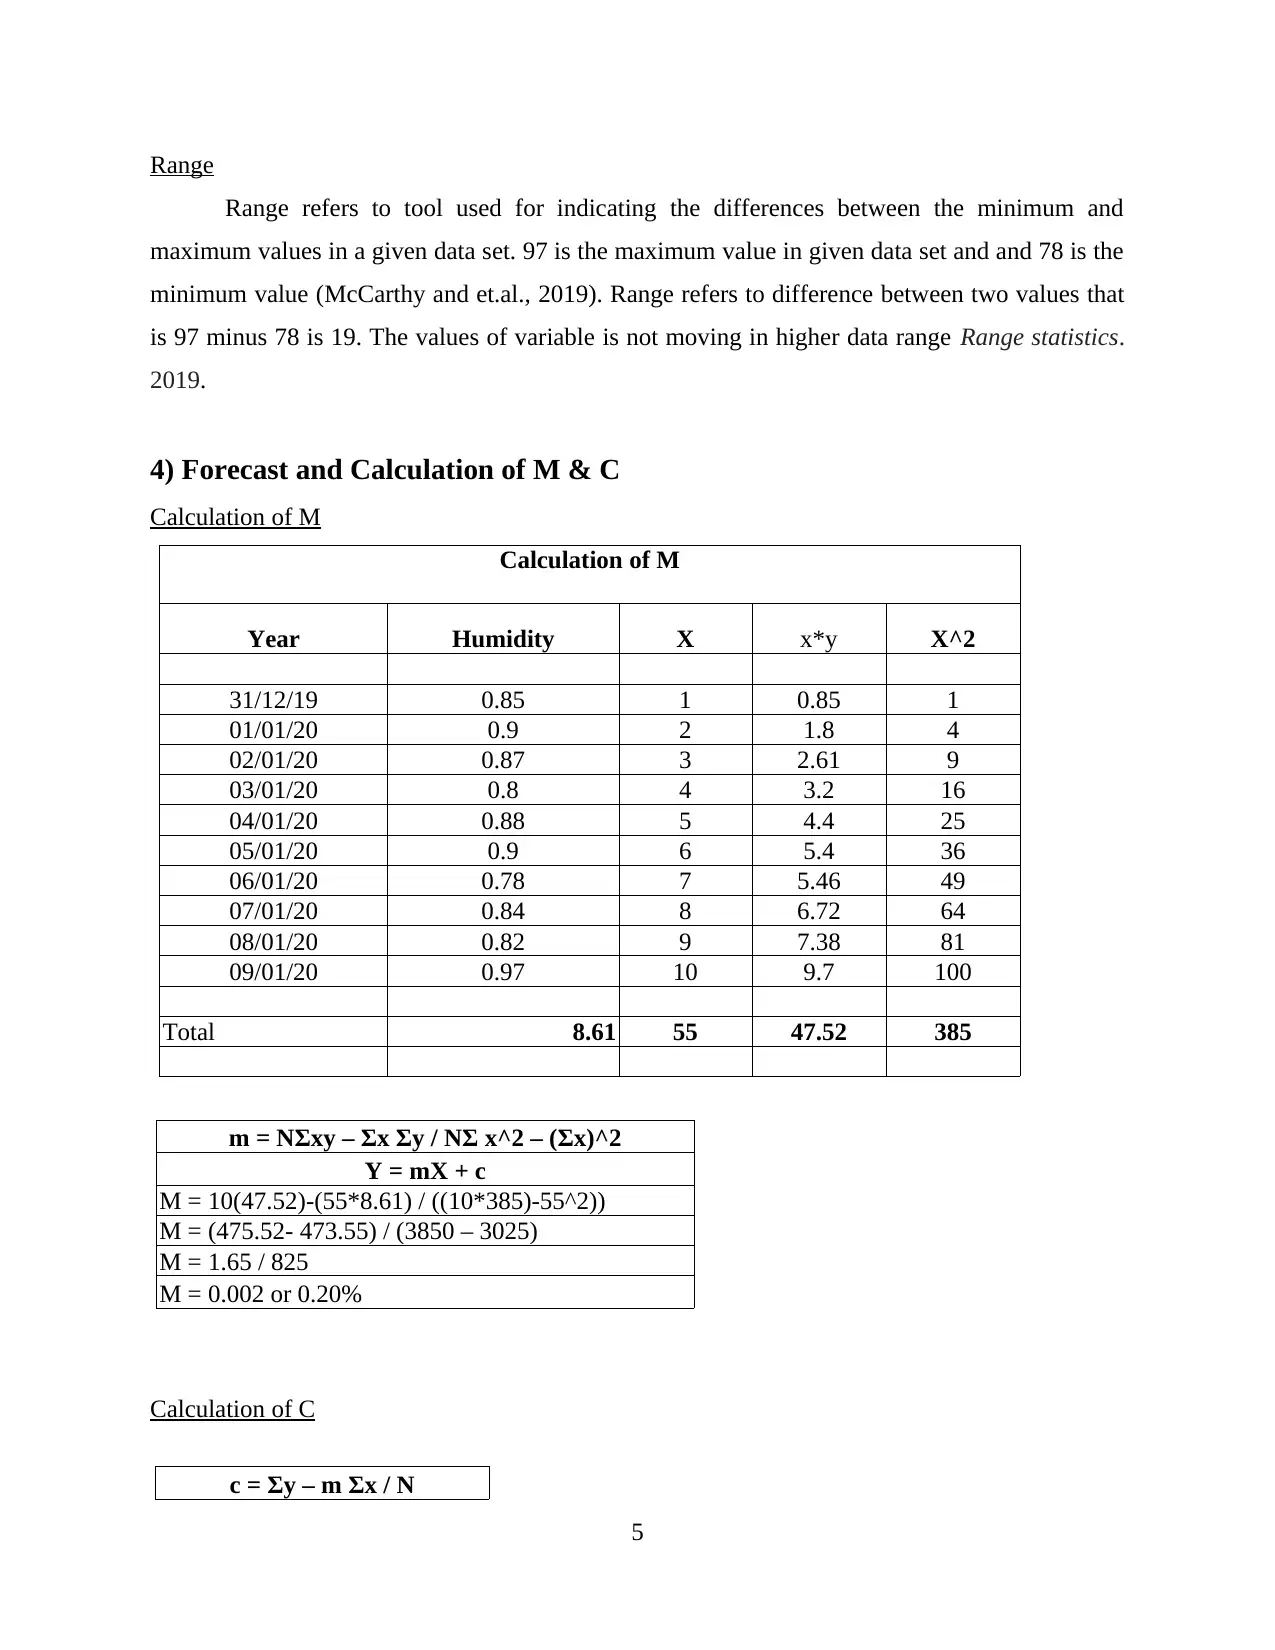
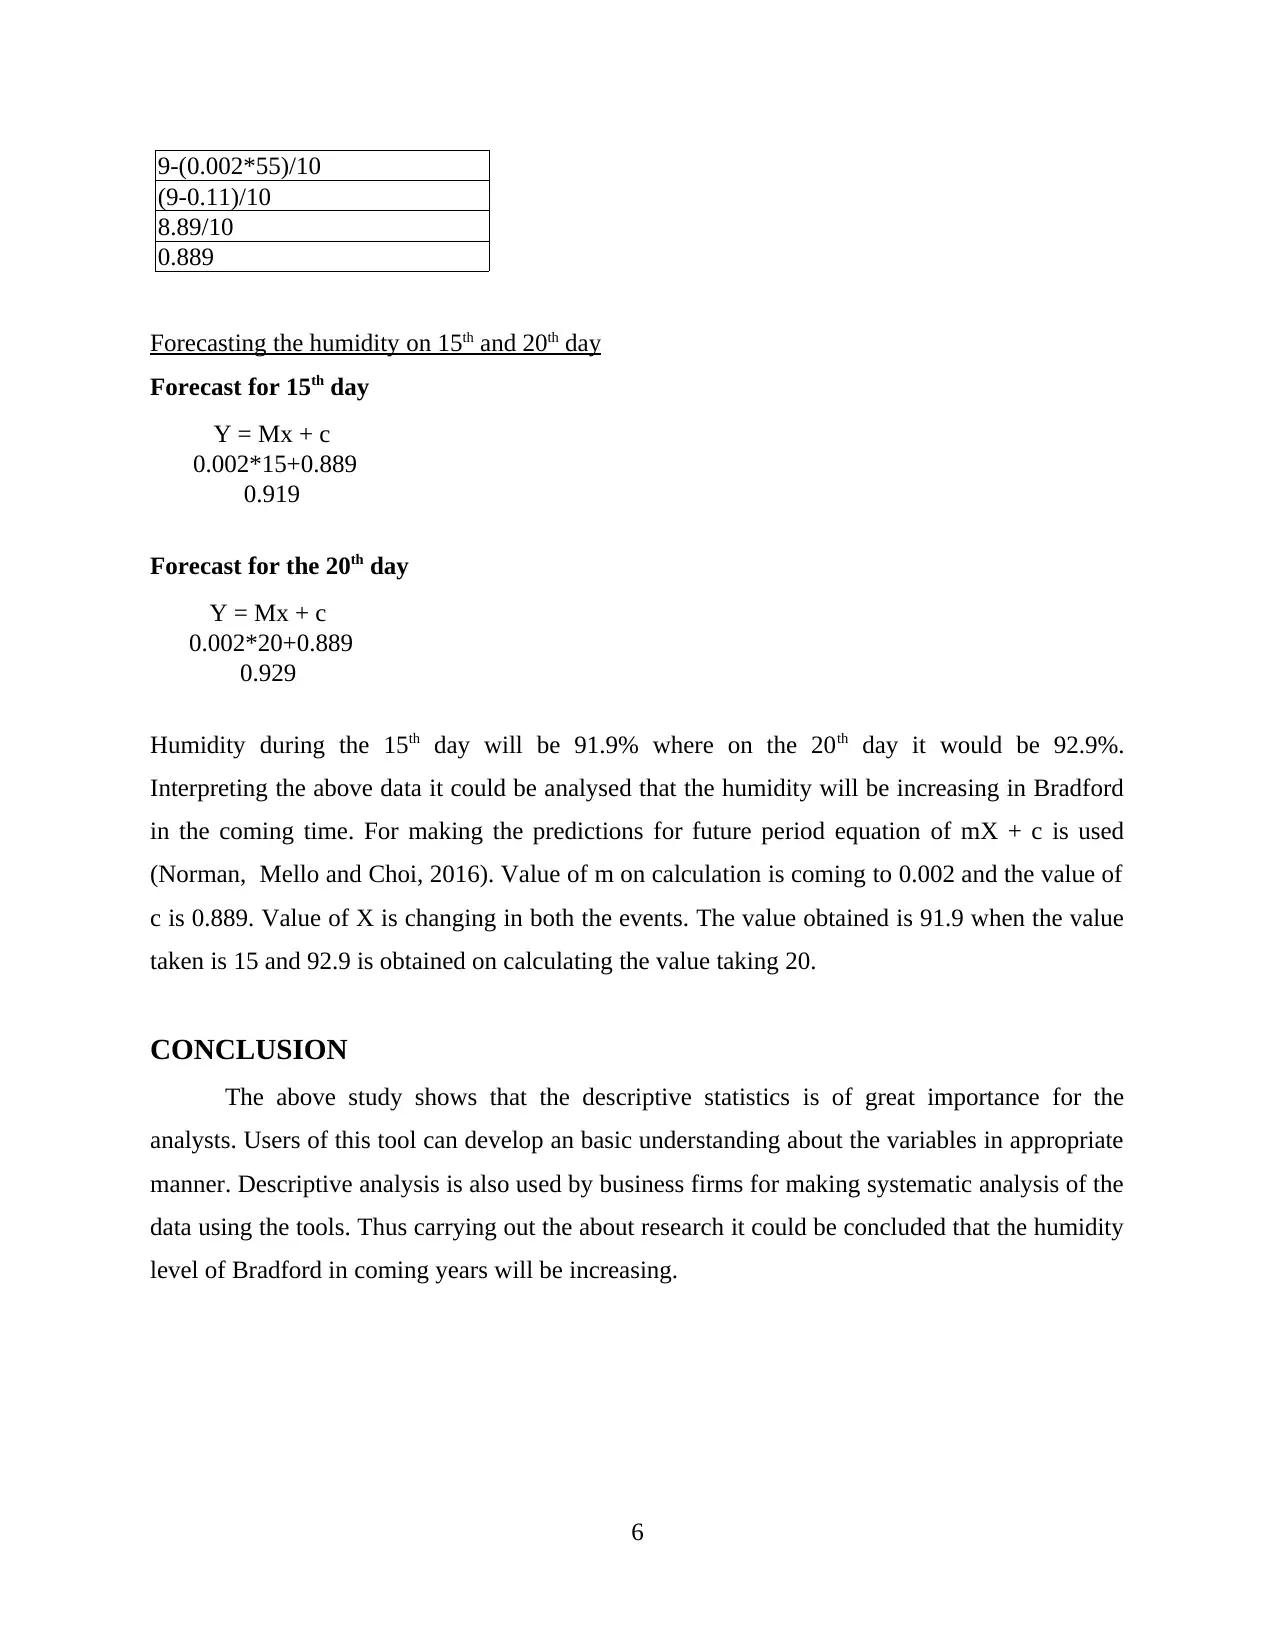
This report provides a comprehensive statistical analysis of humidity data collected in Bradford, UK. It begins with an introduction to descriptive analysis methods, including the calculation of mean, median, mode, standard deviation, and range, using the provided humidity data from December 31, 2019, to January 9, 2020. The report includes a table and charts to present the data visually. The core of the analysis involves calculating the mean (86.10%), median (89%), mode (90%), and standard deviation (0.054) to understand the central tendencies and variability of the humidity levels. Furthermore, the report employs regression methods to forecast humidity levels for the 15th and 20th days, predicting 91.9% and 92.9% humidity, respectively. The conclusion highlights the importance of descriptive statistics for data analysis and forecasting, suggesting an increasing trend in humidity levels in Bradford. The report references several books and journals related to descriptive statistics and forecasting methods.
tabler-icon-diamond-filled.svg

Contribute Materials

Your contribution can guide someone’s learning journey. Share your documents today.
Document Page
tabler-icon-diamond-filled.svg

Secure Best Marks with AI Grader

Need help grading? Try our AI Grader for instant feedback on your assignments.
Document Page
TABLE OF CONTENTS
INTRODUCTION...........................................................................................................................1
1) Arrangement of Data into table...................................................................................................1
2) Presentation of Data.....................................................................................................................1
3) Calculation of mean, median, mode and standard deviation.......................................................2
Mean ...........................................................................................................................................2
Median.........................................................................................................................................3
Mode............................................................................................................................................4
Standard Deviation.......................................................................................................................4
Range...........................................................................................................................................4
4. Forecast and Calculation of M & C.............................................................................................5
Calculation of M..........................................................................................................................5
Calculation of C...........................................................................................................................5
Forecasting the humidity on 15th and 20th day...........................................................................6
CONCLUSION ...............................................................................................................................6
REFERENCES................................................................................................................................7
Document Page
INTRODUCTION
The report will be discussing the statistical analysis of weather data on humidity. This
will be representing descriptive analysis methods used by the experts. For measuring the data
descriptive analysis using mean, median, mode, standard deviation and range method. The report
is based on the data of humidity of Bradford. Predictions have been in the report using regression
methods. The report will provide understanding of the above concepts using calculations.
1) Arrangement of Data into table
Year Humidity
31/12/19 85%
01/01/20 90%
02/01/20 87%
03/01/20 80%
04/01/20 88%
05/01/20 90%
06/01/20 78%
07/01/20 84%
08/01/20 82%
09/01/20 97%
2) Presentation of Data
Chart on Humidity of Brad ford
1
31/12/2019
01/01/2020
02/01/2020
03/01/2020
04/01/2020
05/01/2020
06/01/2020
07/01/2020
08/01/2020
09/01/2020
0
0.1
0.2
0.3
0.4
0.5
0.6
0.7
0.8
0.9
1
85% 90% 87%
80%
88% 90%
78%
84% 82%
97%
Humidity
Document Page
Line Chart on Humidity in Bradford
3) Calculation of mean, median, mode and standard deviation
In analysing the data descriptive statistics is an essential tool used by the analysts and
experts at the initial level. The tools is used widely as it provides the basic level of information
to identify the the direction towards which variable is heading. The methods involved in
calculation are mean, median, mode and standard deviations.
Mean
Mean refers to the tool which is used by the experts and analysts in their research for
analysing the provided data properly. This is among one of the essential tool that is used in the
descriptive statistics. It calculates the average performance of variable (Holcomb, 2016). The
given mean table represent that the mean value is 86.10% of humidity reflecting the average
humidity of in Bradford during ten days is around 86.10%. If the humidity level of the Bradford
increases beyond the given level in table will increase the average humidity.
Mean
Year Humidity
2
31/12/2019
01/01/2020
02/01/2020
03/01/2020
04/01/2020
05/01/2020
06/01/2020
07/01/2020
08/01/2020
09/01/2020
0
0.2
0.4
0.6
0.8
1
1.2
85% 90% 87%
80%
88% 90%
78% 84% 82%
97%
Humidity
tabler-icon-diamond-filled.svg

Secure Best Marks with AI Grader

Need help grading? Try our AI Grader for instant feedback on your assignments.
Document Page
31/12/19 85%
01/01/20 90%
02/01/20 87%
03/01/20 80%
04/01/20 88%
05/01/20 90%
06/01/20 78%
07/01/20 84%
08/01/20 82%
09/01/20 97%
Number of
observations 10
Sum 861.00%
Mean (861/10) 86.10%
Median
Median is used for classifying the data sets into two parts and this makes the analysis
simple and easy. Big data could be analysed using this method. The median value of given data
set of humidity is 89%. The value of the median represents that it will be declining slowly sut
again shows a fluctuating increase. So this could be said that median helps in analysing the data
related to any variable.
Median
Year Humidity
31/12/19 85%
01/01/20 90%
02/01/20 87%
03/01/20 80%
04/01/20 88%
05/01/20 90%
06/01/20 78%
07/01/20 84%
08/01/20 82%
09/01/20 97%
Mid Point (10/2) 5
M= (88% + 90%) / 2 89%
3
Document Page
Mode
Mode refers to the values that is repeating maximum number of times in the data field. In
the present data set of humidity, figure representing maximum number of times is 90%
Therefore, it can be said that the mode is 90% in humidity data. Mode is used by the analysts to
identify the trends that is being repeated number of times in the given data set (George and
Mallery, 2016).
Standard Deviation
Standard deviation refers to tool indicating the variations occurring between the variable
values. In the below table standard deviation is calculated to 0.054. The deviation between
variables is not high (Young and Wessnitzer, 2016). On this analysis it could be interpreted that
variables have not much deviations from mean value.
Standard Deviation
Year Humidity X^2
31/12/19 0.85 0.7225
01/01/20 0.9 0.81
02/01/20 0.87 0.7569
03/01/20 0.8 0.64
04/01/20 0.88 0.7744
05/01/20 0.9 0.81
06/01/20 0.78 0.6084
07/01/20 0.84 0.7056
08/01/20 0.82 0.6724
09/01/20 0.97 0.9409
Total 8.61 7.44
Standard Deviation 5%
SQRT ( 7.44/10)-(8.61/10)^2)
SQRT (0.744 – 0.741)
SQRT (0.003)
0.054
4
Document Page
Range
Range refers to tool used for indicating the differences between the minimum and
maximum values in a given data set. 97 is the maximum value in given data set and and 78 is the
minimum value (McCarthy and et.al., 2019). Range refers to difference between two values that
is 97 minus 78 is 19. The values of variable is not moving in higher data range Range statistics.
2019.
4) Forecast and Calculation of M & C
Calculation of M
Calculation of M
Year Humidity X x*y X^2
31/12/19 0.85 1 0.85 1
01/01/20 0.9 2 1.8 4
02/01/20 0.87 3 2.61 9
03/01/20 0.8 4 3.2 16
04/01/20 0.88 5 4.4 25
05/01/20 0.9 6 5.4 36
06/01/20 0.78 7 5.46 49
07/01/20 0.84 8 6.72 64
08/01/20 0.82 9 7.38 81
09/01/20 0.97 10 9.7 100
Total 8.61 55 47.52 385
m = NΣxy – Σx Σy / NΣ x^2 – (Σx)^2
Y = mX + c
M = 10(47.52)-(55*8.61) / ((10*385)-55^2))
M = (475.52- 473.55) / (3850 – 3025)
M = 1.65 / 825
M = 0.002 or 0.20%
Calculation of C
c = Σy – m Σx / N
5
tabler-icon-diamond-filled.svg

Paraphrase This Document

Need a fresh take? Get an instant paraphrase of this document with our AI Paraphraser
Document Page
9-(0.002*55)/10
(9-0.11)/10
8.89/10
0.889
Forecasting the humidity on 15th and 20th day
Forecast for 15th day
Y = Mx + c
0.002*15+0.889
0.919
Forecast for the 20th day
Y = Mx + c
0.002*20+0.889
0.929
Humidity during the 15th day will be 91.9% where on the 20th day it would be 92.9%.
Interpreting the above data it could be analysed that the humidity will be increasing in Bradford
in the coming time. For making the predictions for future period equation of mX + c is used
(Norman, Mello and Choi, 2016). Value of m on calculation is coming to 0.002 and the value of
c is 0.889. Value of X is changing in both the events. The value obtained is 91.9 when the value
taken is 15 and 92.9 is obtained on calculating the value taking 20.
CONCLUSION
The above study shows that the descriptive statistics is of great importance for the
analysts. Users of this tool can develop an basic understanding about the variables in appropriate
manner. Descriptive analysis is also used by business firms for making systematic analysis of the
data using the tools. Thus carrying out the about research it could be concluded that the humidity
level of Bradford in coming years will be increasing.
6
Document Page
REFERENCES
Books and Journals
Holcomb, Z.C., 2016. Fundamentals of descriptive statistics. Routledge.
George, D. and Mallery, P., 2016. Descriptive statistics. In IBM SPSS Statistics 23 Step by
Step (pp. 126-134). Routledge.
McCarthy, R.V. and et.al., 2019. What Do Descriptive Statistics Tell Us. In Applying Predictive
Analytics (pp. 57-87). Springer, Cham.
Norman, C., Mello, M. and Choi, B., 2016. Identifying frequent users of an urban emergency
medical service using descriptive statistics and regression analyses. Western Journal of
Emergency Medicine, 17(1), p.39.
Young, J. and Wessnitzer, J., 2016. Descriptive statistics, graphs, and visualisation. In Modern
statistical methods for HCI (pp. 37-56). Springer, Cham.
Online
Range statistics. 2019. [Online]. Available through:< https://explorable.com/range-in-statistics>.
7
chevron_up_icon
1 out of 9
circle_padding
hide_on_mobile
zoom_out_icon
logo.png

Your All-in-One AI-Powered Toolkit for Academic Success.

Available 24*7 on WhatsApp / Email

[object Object]