Statistical Analysis Report: Marathon Performance and Caffeine Impact
VerifiedAdded on 2021/02/19
|33
|3057
|487
Report
AI Summary
This report presents a statistical analysis of marathon performance, employing various methodologies to examine relationships between variables. The study begins with descriptive statistics, exploring correlations between height, body mass, marathon time, and skinfolds. Regression analysis is then used to assess the influence of these variables on marathon time, with interpretations of R, R-squared, and ANOVA results. The report includes graphical representations and a discussion of homoscedasticity. Furthermore, the report delves into a parsimonious model, incorporating additional variables like OBLA and VO2max. The second part of the report focuses on the impact of caffeine supplementation on marathon performance, including graphical analysis and the suitability of parametric tests. Non-parametric tests, such as the Mann-Whitney test, are used to analyze the relationship between caffeine dosage and marathon time, and the results are interpreted. The limitations of the study, such as the presence of multicollinearity, are also acknowledged. The report provides a comprehensive statistical examination of the factors affecting marathon performance and the influence of caffeine supplementation.
STATISTICS
Paraphrase This Document
Need a fresh take? Get an instant paraphrase of this document with our AI Paraphraser
Table of Contents
INTRODUCTION...........................................................................................................................3
PART 1............................................................................................................................................3
1. Constructing a table showing an evaluation of descriptive statistics.......................................3
2. Preliminary analysis ................................................................................................................4
3. Regression analysis .................................................................................................................5
4. Graphs .....................................................................................................................................7
......................................................................................................................................................8
......................................................................................................................................................9
....................................................................................................................................................10
5. Abstract in relation to above outcomes .................................................................................10
6. use of parsimonious model ...................................................................................................11
7.Limitations .............................................................................................................................22
PART 2..........................................................................................................................................22
8. Producing graph ....................................................................................................................22
9. Using the graph, commenting on suitability of the parametric test in order to analyse the
data ............................................................................................................................................24
....................................................................................................................................................25
....................................................................................................................................................26
10. Analysing the relationship in between marathon performance and the caffeine
supplementation ........................................................................................................................27
11. Abstract ...............................................................................................................................31
REFERENCES..............................................................................................................................33
INTRODUCTION
Statistics referred as the form of the mathematical analysis which uses quantified models,
synopses, representation for the given experimental and the real life based. Statistics involves
application of the methodologies for gathering, analysing, reviewing and drawing conclusions
from the dataset. Some of the statistical measures includes mean, standard deviation, variance,
regression analysis. It is used in making better and informed decision making for the particular
situation or the hypothesis evaluated from the specific dataset. The present study is based on the
application of different statistical measures that involves descriptive statistics, SPSS and
regression analysis that will be showing an analysis of the relationship between the variables.
Furthermore, the study includes relevant interpretations and the findings generated from the data.
PART 1
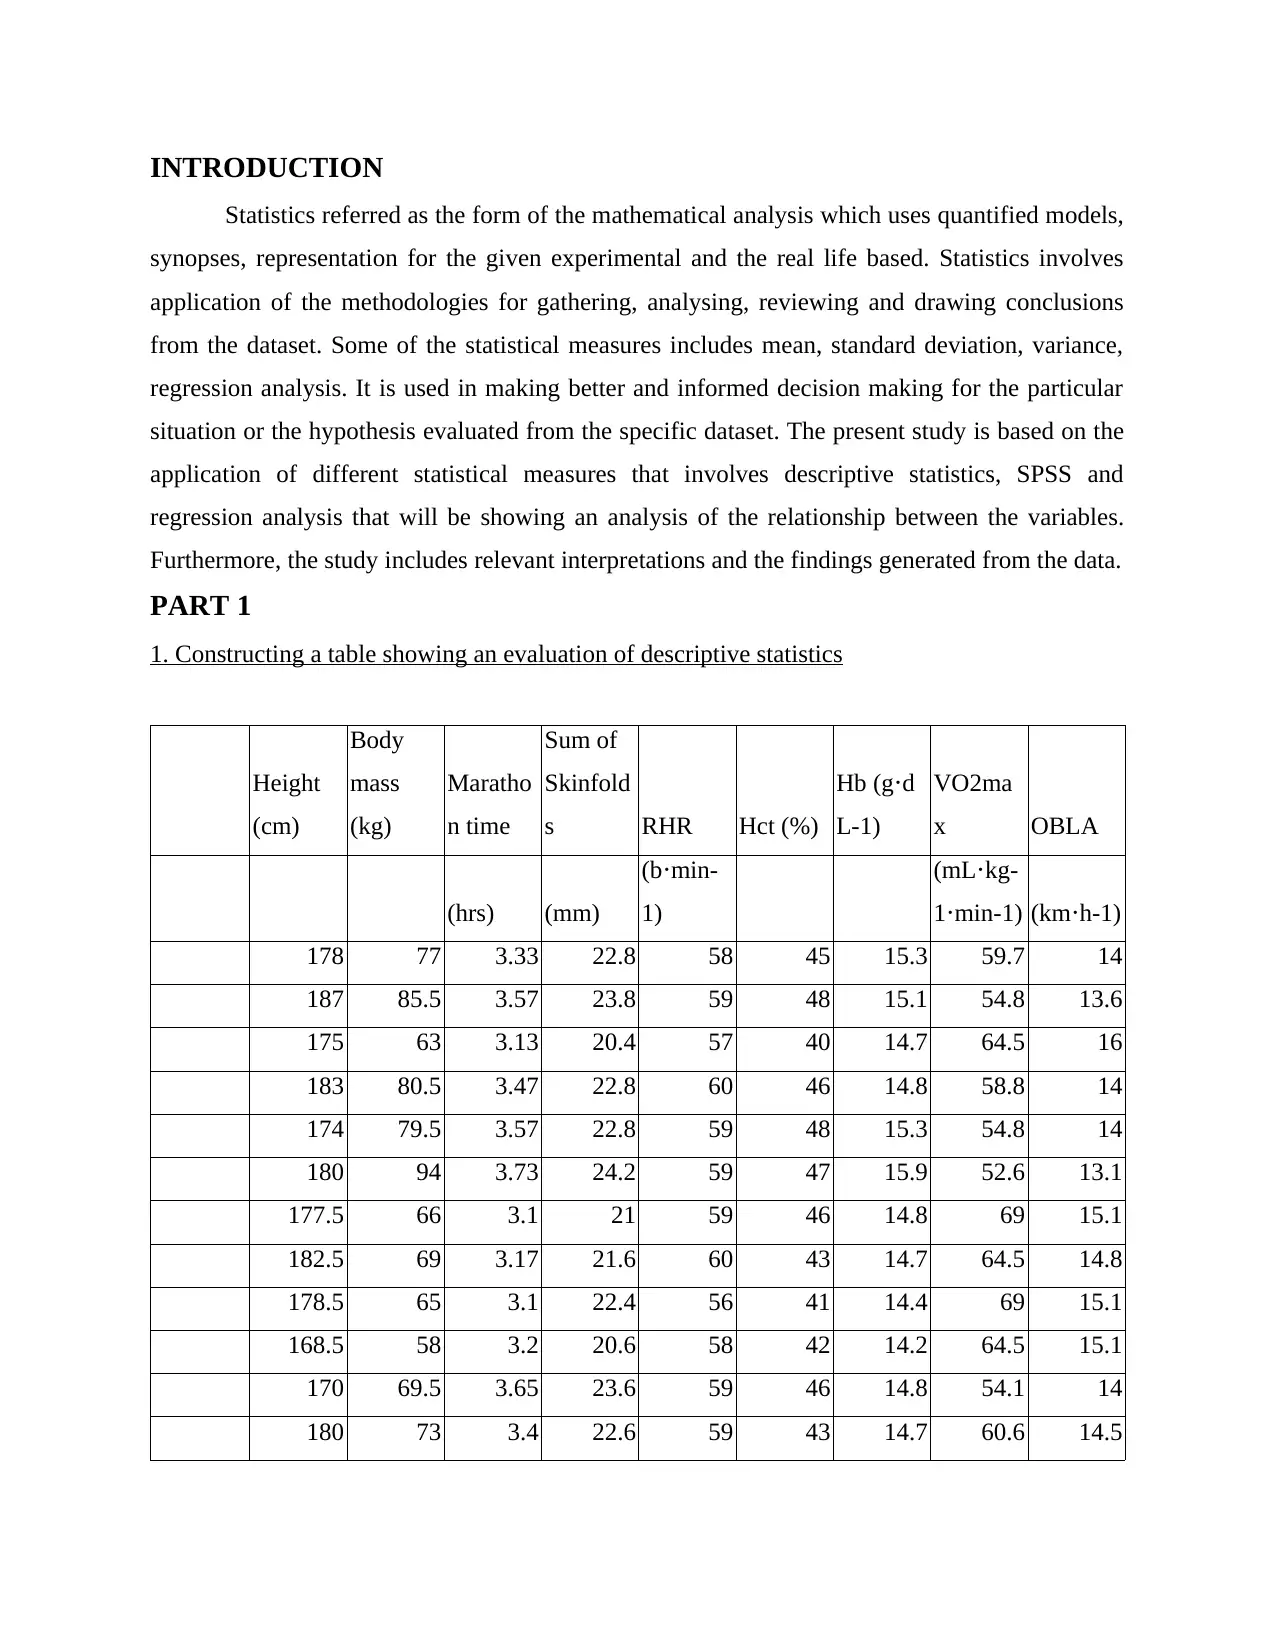
1. Constructing a table showing an evaluation of descriptive statistics
Height
(cm)
Body
mass
(kg)
Maratho
n time
Sum of
Skinfold
s RHR Hct (%)
Hb (g d⋅
L-1)
VO2ma
x OBLA
(hrs) (mm)
(b min-⋅
1)
(mL kg-⋅
1 min-1)⋅ (km h-1)⋅
178 77 3.33 22.8 58 45 15.3 59.7 14
187 85.5 3.57 23.8 59 48 15.1 54.8 13.6
175 63 3.13 20.4 57 40 14.7 64.5 16
183 80.5 3.47 22.8 60 46 14.8 58.8 14
174 79.5 3.57 22.8 59 48 15.3 54.8 14
180 94 3.73 24.2 59 47 15.9 52.6 13.1
177.5 66 3.1 21 59 46 14.8 69 15.1
182.5 69 3.17 21.6 60 43 14.7 64.5 14.8
178.5 65 3.1 22.4 56 41 14.4 69 15.1
168.5 58 3.2 20.6 58 42 14.2 64.5 15.1
170 69.5 3.65 23.6 59 46 14.8 54.1 14
180 73 3.4 22.6 59 43 14.7 60.6 14.5
Statistics referred as the form of the mathematical analysis which uses quantified models,
synopses, representation for the given experimental and the real life based. Statistics involves
application of the methodologies for gathering, analysing, reviewing and drawing conclusions
from the dataset. Some of the statistical measures includes mean, standard deviation, variance,
regression analysis. It is used in making better and informed decision making for the particular
situation or the hypothesis evaluated from the specific dataset. The present study is based on the
application of different statistical measures that involves descriptive statistics, SPSS and
regression analysis that will be showing an analysis of the relationship between the variables.
Furthermore, the study includes relevant interpretations and the findings generated from the data.
PART 1
1. Constructing a table showing an evaluation of descriptive statistics
Height
(cm)
Body
mass
(kg)
Maratho
n time
Sum of
Skinfold
s RHR Hct (%)
Hb (g d⋅
L-1)
VO2ma
x OBLA
(hrs) (mm)
(b min-⋅
1)
(mL kg-⋅
1 min-1)⋅ (km h-1)⋅
178 77 3.33 22.8 58 45 15.3 59.7 14
187 85.5 3.57 23.8 59 48 15.1 54.8 13.6
175 63 3.13 20.4 57 40 14.7 64.5 16
183 80.5 3.47 22.8 60 46 14.8 58.8 14
174 79.5 3.57 22.8 59 48 15.3 54.8 14
180 94 3.73 24.2 59 47 15.9 52.6 13.1
177.5 66 3.1 21 59 46 14.8 69 15.1
182.5 69 3.17 21.6 60 43 14.7 64.5 14.8
178.5 65 3.1 22.4 56 41 14.4 69 15.1
168.5 58 3.2 20.6 58 42 14.2 64.5 15.1
170 69.5 3.65 23.6 59 46 14.8 54.1 14
180 73 3.4 22.6 59 43 14.7 60.6 14.5
⊘ This is a preview!⊘
Do you want full access?
Subscribe today to unlock all pages.
Trusted by 1+ million students worldwide
186.5 74 3.37 23.1 60 46 14.7 55.6 13.6
188 68 3.28 21.6 57 44 14.8 66.7 16
173 80 3.43 23.4 58 44 15.2 55.6 13.6
171 66 2.97 20.9 57 46 14.5 61.5 15.1
169 54.5 3.08 20.4 57 38 13.6 66.7 16.7
181 64 2.92 21.8 58 43 13.6 70.2 15.7
188 84 3.3 23.8 56 47 14.9 58 13.3
173 73 3.23 20.8 58 46 14.7 58 14.3
179 89 3.53 23.6 59 47 15 56.3 13.8
184 94 3.53 24 57 50 15.6 59.7 12.9
Mean
178.477
2727273
73.9318
181818
3.32090
90909
22.3636
363636
58.1818
181818
44.8181
818182
14.7863
636364
60.6909
090909
14.4681
818182
Std.
Dev.
6.19999
47633
10.9634
62538
0.22400
91216
1.27673
14871
1.22031
86015
2.87246
97128
0.54274
03611
5.40880
315
1.02835
34521
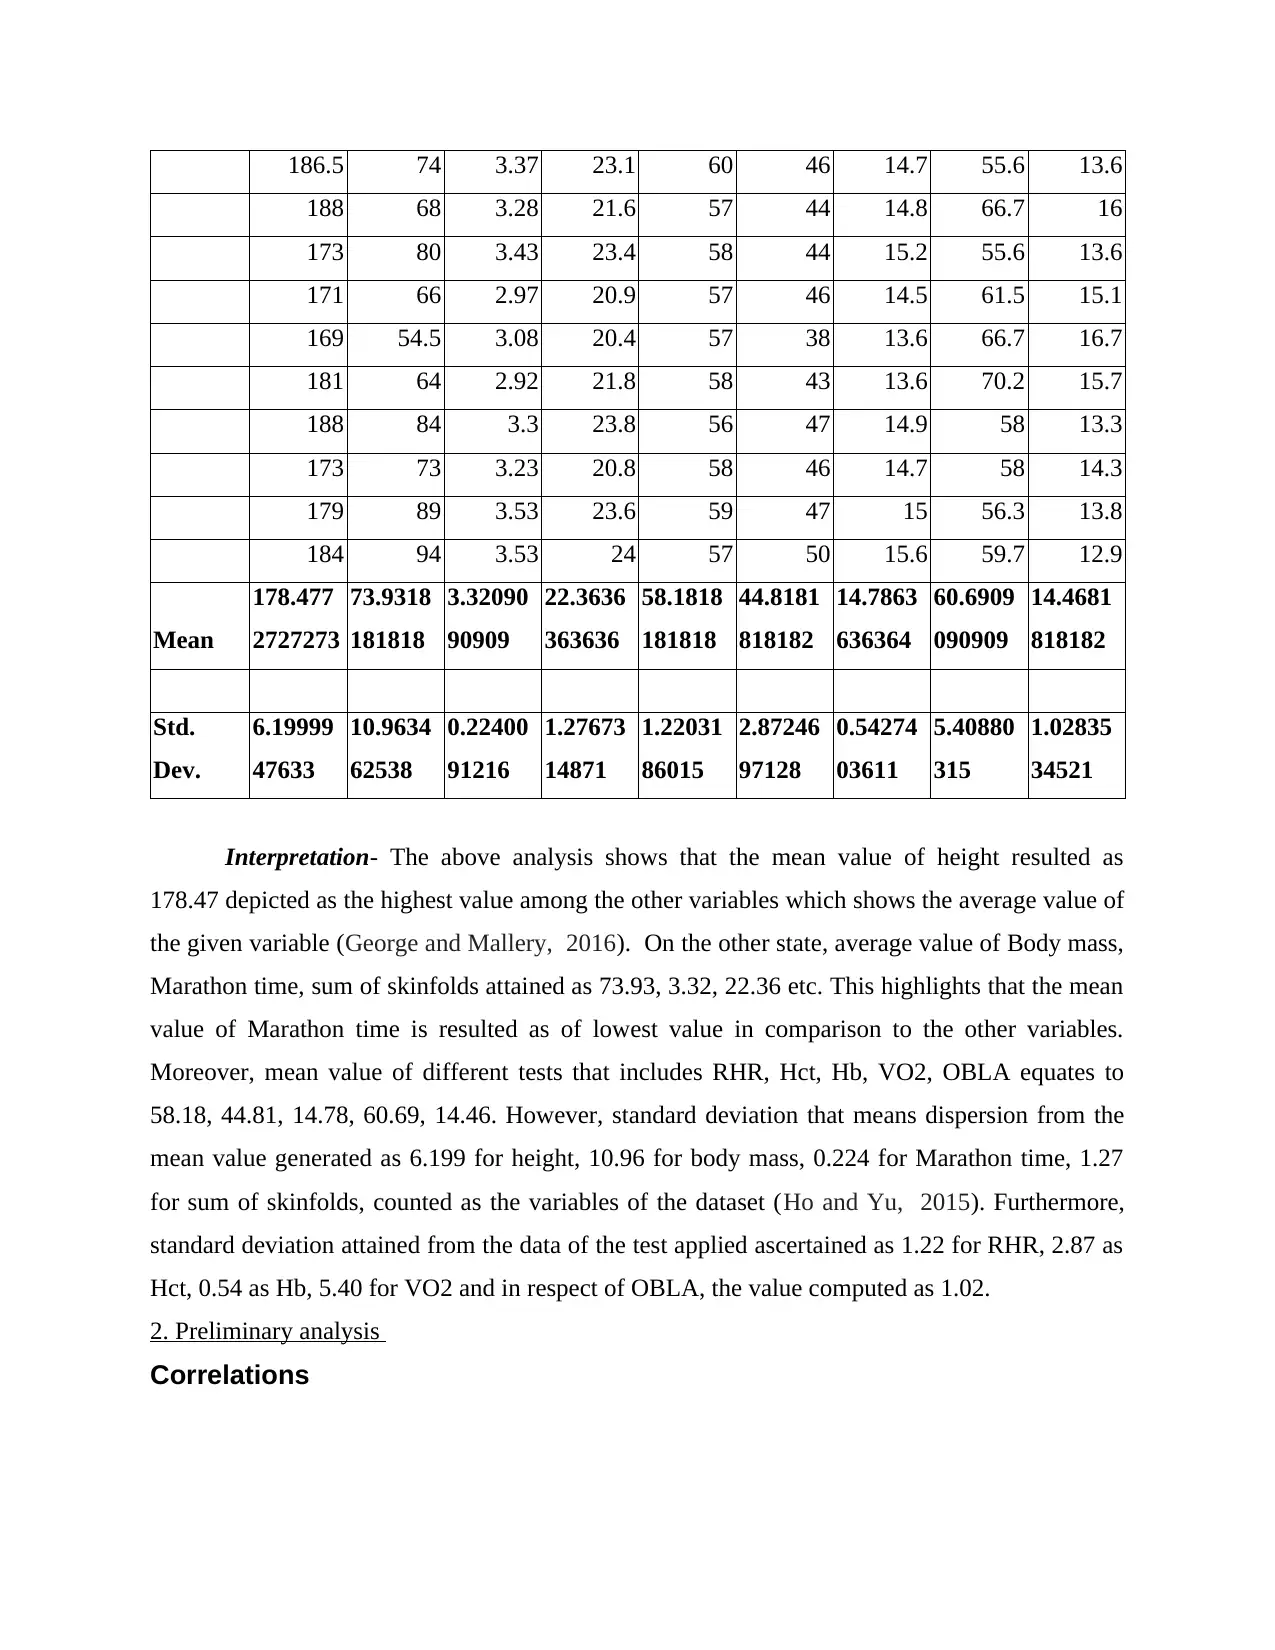
Interpretation- The above analysis shows that the mean value of height resulted as
178.47 depicted as the highest value among the other variables which shows the average value of
the given variable (George and Mallery, 2016). On the other state, average value of Body mass,
Marathon time, sum of skinfolds attained as 73.93, 3.32, 22.36 etc. This highlights that the mean
value of Marathon time is resulted as of lowest value in comparison to the other variables.
Moreover, mean value of different tests that includes RHR, Hct, Hb, VO2, OBLA equates to
58.18, 44.81, 14.78, 60.69, 14.46. However, standard deviation that means dispersion from the
mean value generated as 6.199 for height, 10.96 for body mass, 0.224 for Marathon time, 1.27
for sum of skinfolds, counted as the variables of the dataset (Ho and Yu, 2015). Furthermore,
standard deviation attained from the data of the test applied ascertained as 1.22 for RHR, 2.87 as
Hct, 0.54 as Hb, 5.40 for VO2 and in respect of OBLA, the value computed as 1.02.
2. Preliminary analysis
Correlations
188 68 3.28 21.6 57 44 14.8 66.7 16
173 80 3.43 23.4 58 44 15.2 55.6 13.6
171 66 2.97 20.9 57 46 14.5 61.5 15.1
169 54.5 3.08 20.4 57 38 13.6 66.7 16.7
181 64 2.92 21.8 58 43 13.6 70.2 15.7
188 84 3.3 23.8 56 47 14.9 58 13.3
173 73 3.23 20.8 58 46 14.7 58 14.3
179 89 3.53 23.6 59 47 15 56.3 13.8
184 94 3.53 24 57 50 15.6 59.7 12.9
Mean
178.477
2727273
73.9318
181818
3.32090
90909
22.3636
363636
58.1818
181818
44.8181
818182
14.7863
636364
60.6909
090909
14.4681
818182
Std.
Dev.
6.19999
47633
10.9634
62538
0.22400
91216
1.27673
14871
1.22031
86015
2.87246
97128
0.54274
03611
5.40880
315
1.02835
34521
Interpretation- The above analysis shows that the mean value of height resulted as
178.47 depicted as the highest value among the other variables which shows the average value of
the given variable (George and Mallery, 2016). On the other state, average value of Body mass,
Marathon time, sum of skinfolds attained as 73.93, 3.32, 22.36 etc. This highlights that the mean
value of Marathon time is resulted as of lowest value in comparison to the other variables.
Moreover, mean value of different tests that includes RHR, Hct, Hb, VO2, OBLA equates to
58.18, 44.81, 14.78, 60.69, 14.46. However, standard deviation that means dispersion from the
mean value generated as 6.199 for height, 10.96 for body mass, 0.224 for Marathon time, 1.27
for sum of skinfolds, counted as the variables of the dataset (Ho and Yu, 2015). Furthermore,
standard deviation attained from the data of the test applied ascertained as 1.22 for RHR, 2.87 as
Hct, 0.54 as Hb, 5.40 for VO2 and in respect of OBLA, the value computed as 1.02.
2. Preliminary analysis
Correlations
Paraphrase This Document
Need a fresh take? Get an instant paraphrase of this document with our AI Paraphraser
Correlations
Height (cm) Body mass (kg) Marathon time Sum of Skinfolds
Height (cm)
Pearson Correlation 1 .492* .205 .484*
Sig. (2-tailed) .020 .361 .023
N 22 22 22 22
Body mass (kg)
Pearson Correlation .492* 1 .776** .857**
Sig. (2-tailed) .020 .000 .000
N 22 22 22 22
Marathon time
Pearson Correlation .205 .776** 1 .802**
Sig. (2-tailed) .361 .000 .000
N 22 22 22 22
Sum of Skinfolds
Pearson Correlation .484* .857** .802** 1
Sig. (2-tailed) .023 .000 .000
N 22 22 22 22
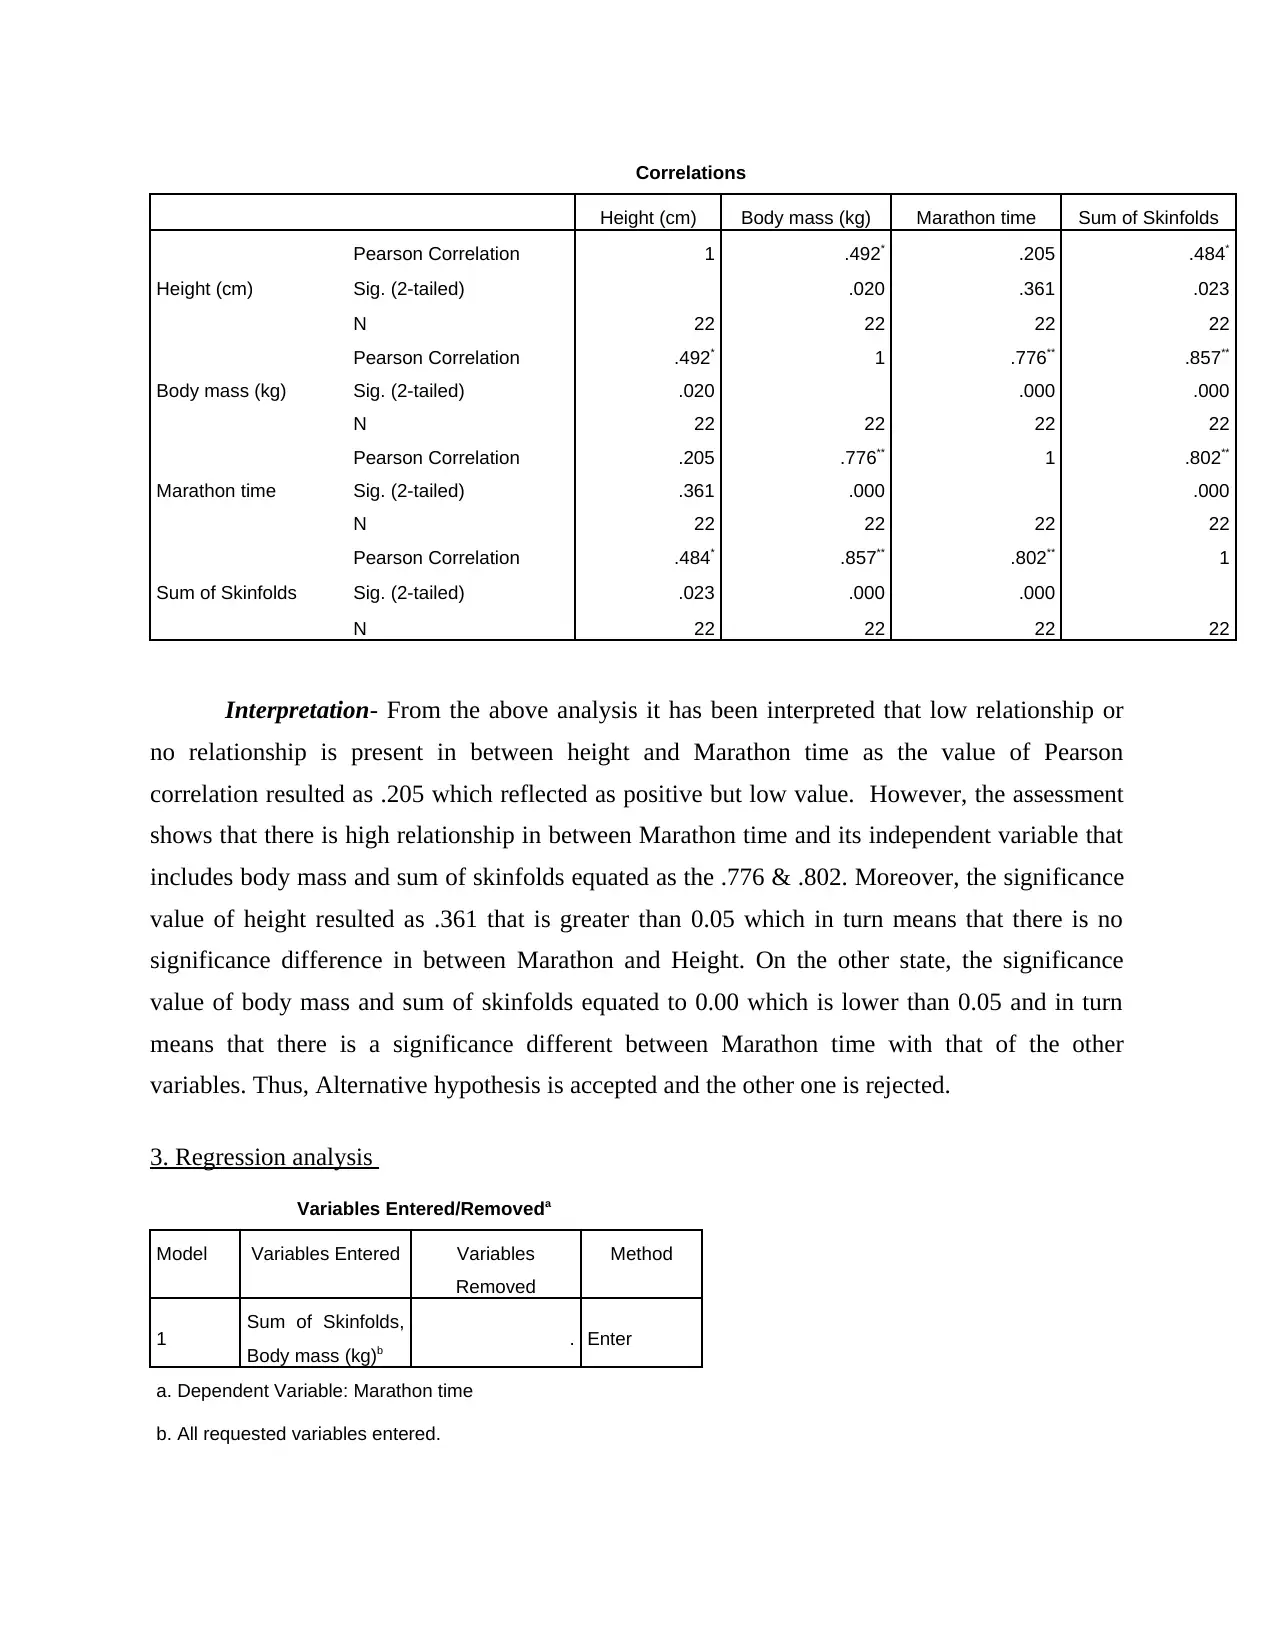
Interpretation- From the above analysis it has been interpreted that low relationship or
no relationship is present in between height and Marathon time as the value of Pearson
correlation resulted as .205 which reflected as positive but low value. However, the assessment
shows that there is high relationship in between Marathon time and its independent variable that
includes body mass and sum of skinfolds equated as the .776 & .802. Moreover, the significance
value of height resulted as .361 that is greater than 0.05 which in turn means that there is no
significance difference in between Marathon and Height. On the other state, the significance
value of body mass and sum of skinfolds equated to 0.00 which is lower than 0.05 and in turn
means that there is a significance different between Marathon time with that of the other
variables. Thus, Alternative hypothesis is accepted and the other one is rejected.
3. Regression analysis
Variables Entered/Removeda
Model Variables Entered Variables
Removed
Method
1 Sum of Skinfolds,
Body mass (kg)b . Enter
a. Dependent Variable: Marathon time
b. All requested variables entered.
Height (cm) Body mass (kg) Marathon time Sum of Skinfolds
Height (cm)
Pearson Correlation 1 .492* .205 .484*
Sig. (2-tailed) .020 .361 .023
N 22 22 22 22
Body mass (kg)
Pearson Correlation .492* 1 .776** .857**
Sig. (2-tailed) .020 .000 .000
N 22 22 22 22
Marathon time
Pearson Correlation .205 .776** 1 .802**
Sig. (2-tailed) .361 .000 .000
N 22 22 22 22
Sum of Skinfolds
Pearson Correlation .484* .857** .802** 1
Sig. (2-tailed) .023 .000 .000
N 22 22 22 22
Interpretation- From the above analysis it has been interpreted that low relationship or
no relationship is present in between height and Marathon time as the value of Pearson
correlation resulted as .205 which reflected as positive but low value. However, the assessment
shows that there is high relationship in between Marathon time and its independent variable that
includes body mass and sum of skinfolds equated as the .776 & .802. Moreover, the significance
value of height resulted as .361 that is greater than 0.05 which in turn means that there is no
significance difference in between Marathon and Height. On the other state, the significance
value of body mass and sum of skinfolds equated to 0.00 which is lower than 0.05 and in turn
means that there is a significance different between Marathon time with that of the other
variables. Thus, Alternative hypothesis is accepted and the other one is rejected.
3. Regression analysis
Variables Entered/Removeda
Model Variables Entered Variables
Removed
Method
1 Sum of Skinfolds,
Body mass (kg)b . Enter
a. Dependent Variable: Marathon time
b. All requested variables entered.
Model Summaryb
Model R R Square Adjusted R Square Std. Error of the
Estimate
1 .820a .672 .638 .135
a. Predictors: (Constant), Sum of Skinfolds, Body mass (kg)
b. Dependent Variable: Marathon time
ANOVAa
Model Sum of Squares df Mean Square F Sig.
1
Regression .709 2 .354 19.500 .000b
Residual .345 19 .018
Total 1.054 21
a. Dependent Variable: Marathon time
b. Predictors: (Constant), Sum of Skinfolds, Body mass (kg)
Coefficientsa
Model Unstandardized Coefficients Standardized
Coefficients
t Sig.
B Std. Error Beta
1
(Constant) .795 .699 1.137 .270
Body mass (kg) .007 .005 .335 1.314 .205
Sum of Skinfolds .090 .045 .515 2.023 .057
a. Dependent Variable: Marathon time
Residuals Statisticsa
Minimum Maximum Mean Std. Deviation N
Predicted Value 3.01 3.62 3.32 .184 22
Residual -.282 .248 .000 .128 22
Std. Predicted Value -1.689 1.650 .000 1.000 22
⊘ This is a preview!⊘
Do you want full access?
Subscribe today to unlock all pages.
Trusted by 1+ million students worldwide
Std. Residual -2.093 1.837 .000 .951 22
a. Dependent Variable: Marathon time
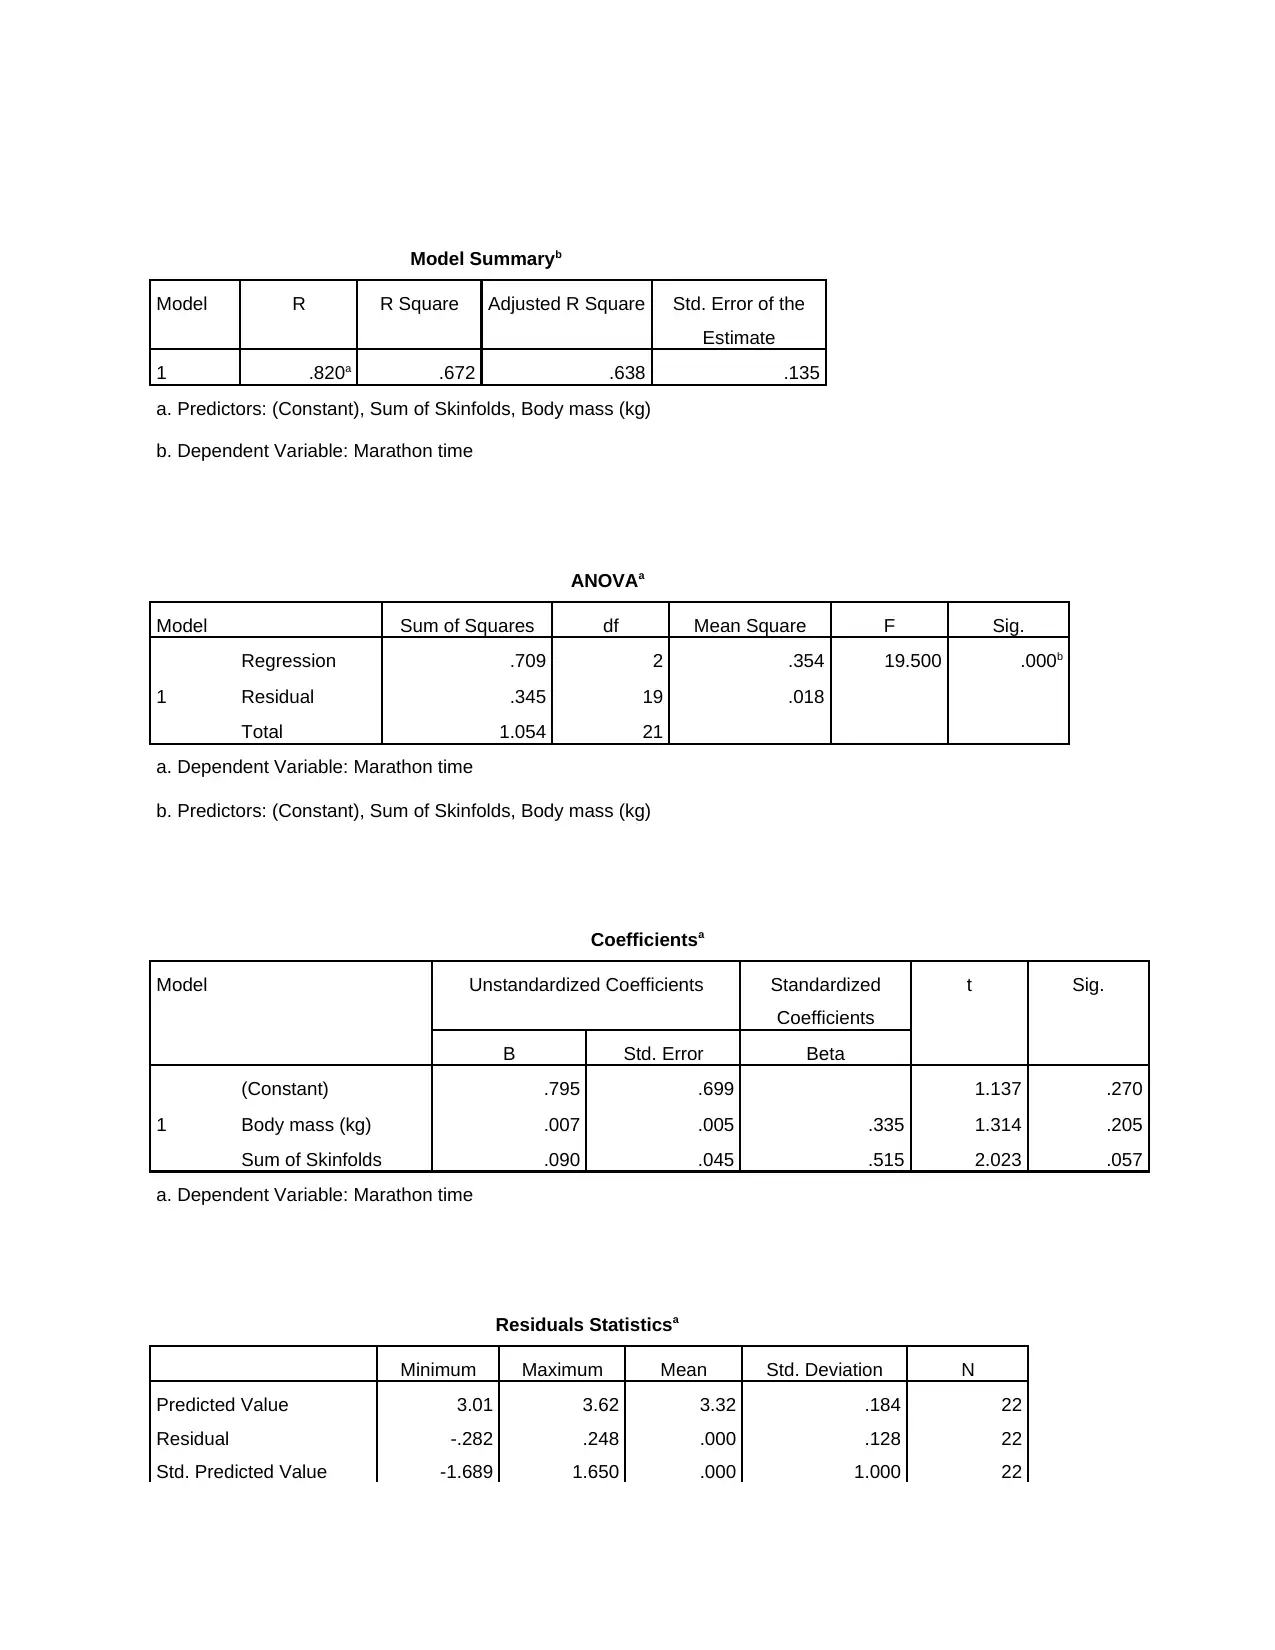
Interpretation- From the above evaluation it has been assessed that the value of R
equated as .820 which indicates strong relationship between the Marathon Time and its
independent variable that includes Sum of skinfolds as its Beta value represented as 0.090 which
reflects that due to change in sum of skinfolds, Marathon time changes with a greater value. The
value of R square attained as .672 which shows that due to the change in one variable, other
variable also changes with little percentage value. As the R value equated to .820 which shows
that strong and positive relationship is present between dependent and independent variable.
4. Graphs
a. Dependent Variable: Marathon time
Interpretation- From the above evaluation it has been assessed that the value of R
equated as .820 which indicates strong relationship between the Marathon Time and its
independent variable that includes Sum of skinfolds as its Beta value represented as 0.090 which
reflects that due to change in sum of skinfolds, Marathon time changes with a greater value. The
value of R square attained as .672 which shows that due to the change in one variable, other
variable also changes with little percentage value. As the R value equated to .820 which shows
that strong and positive relationship is present between dependent and independent variable.
4. Graphs
Paraphrase This Document
Need a fresh take? Get an instant paraphrase of this document with our AI Paraphraser
⊘ This is a preview!⊘
Do you want full access?
Subscribe today to unlock all pages.
Trusted by 1+ million students worldwide
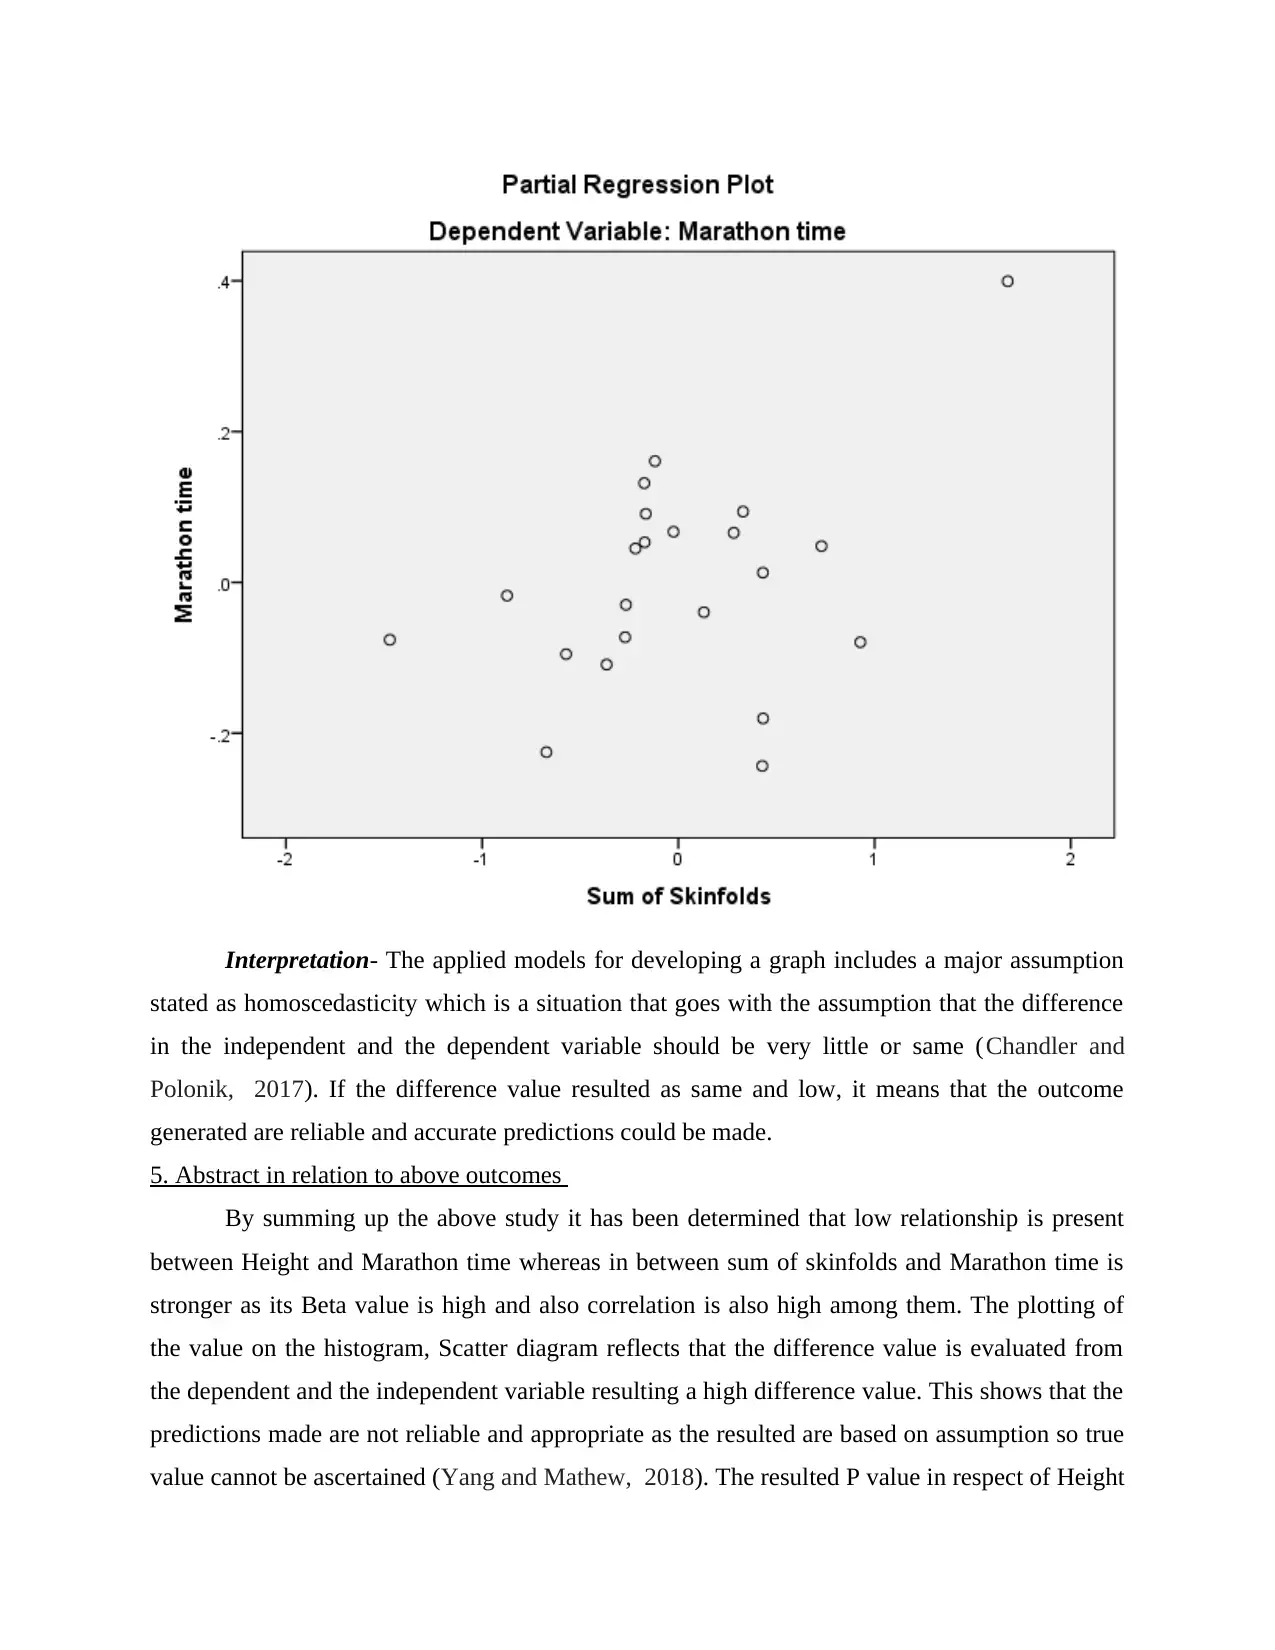
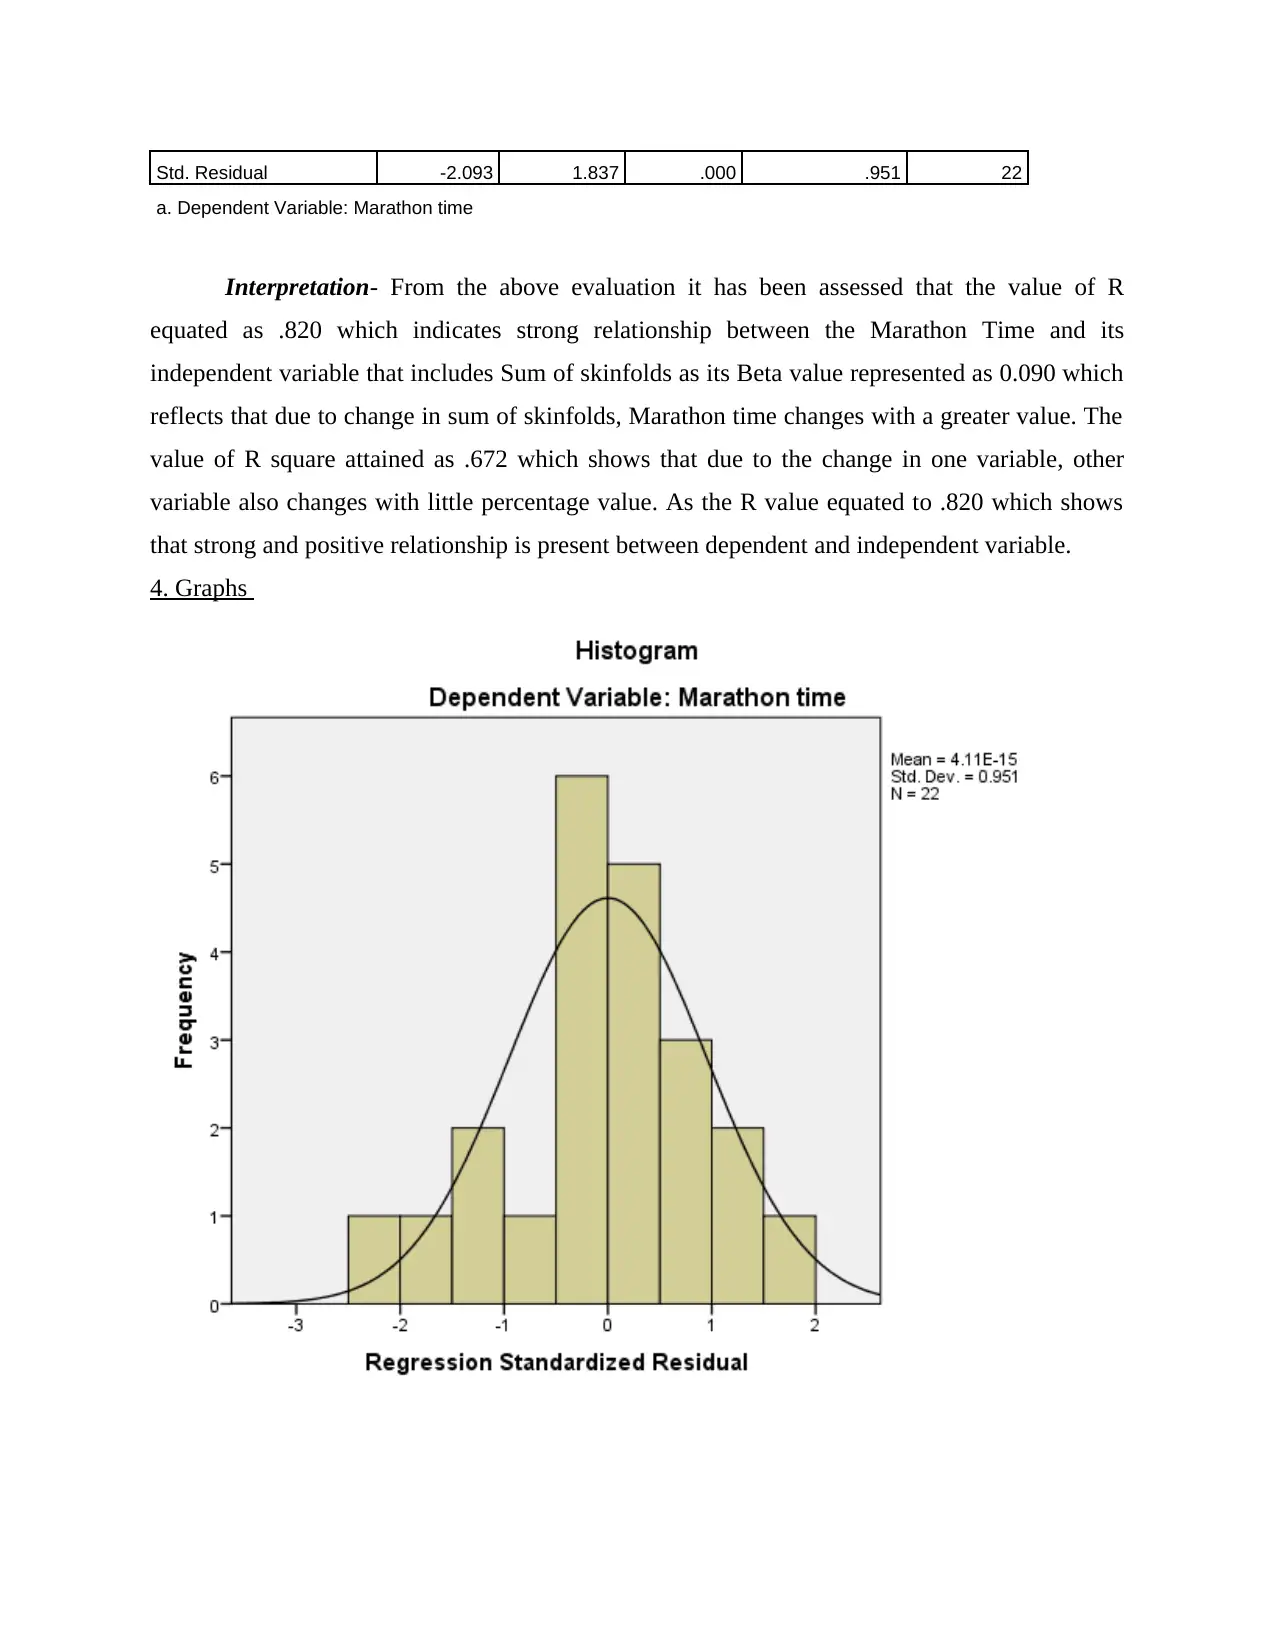
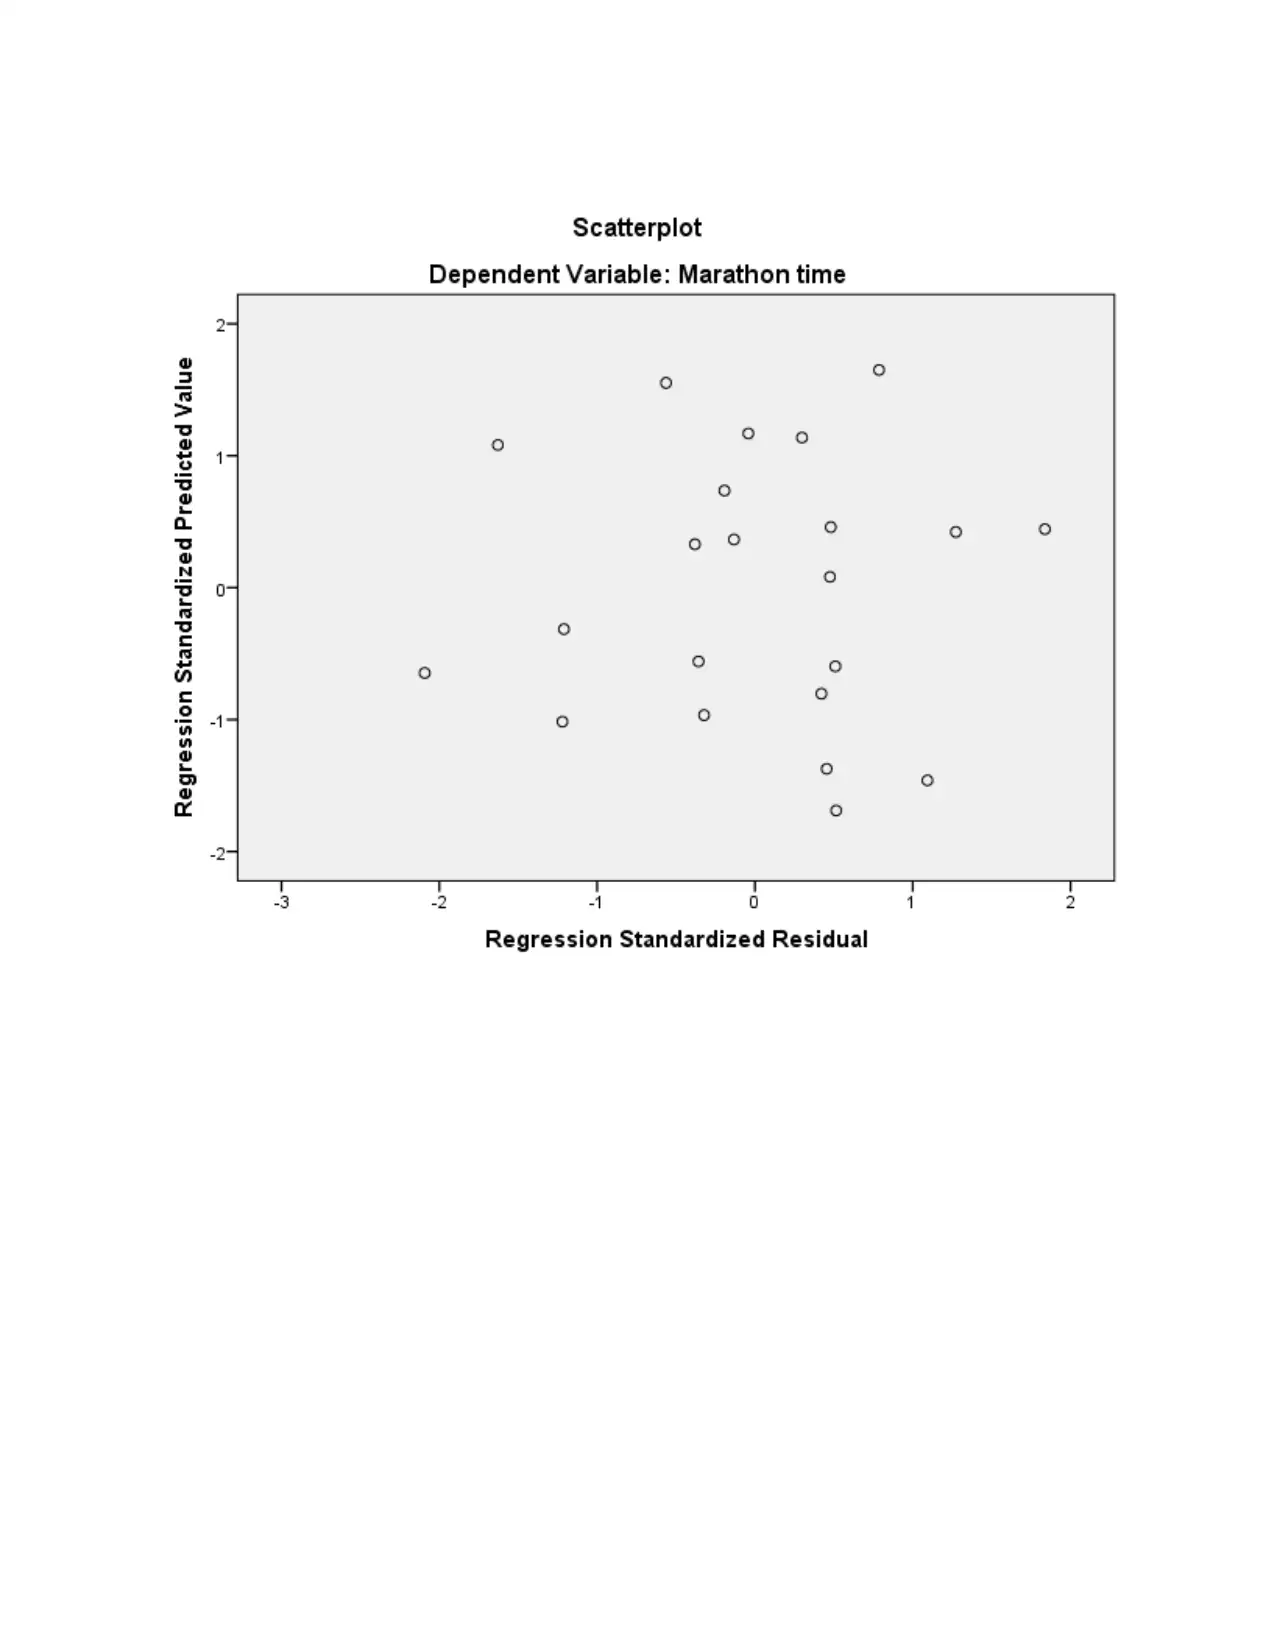
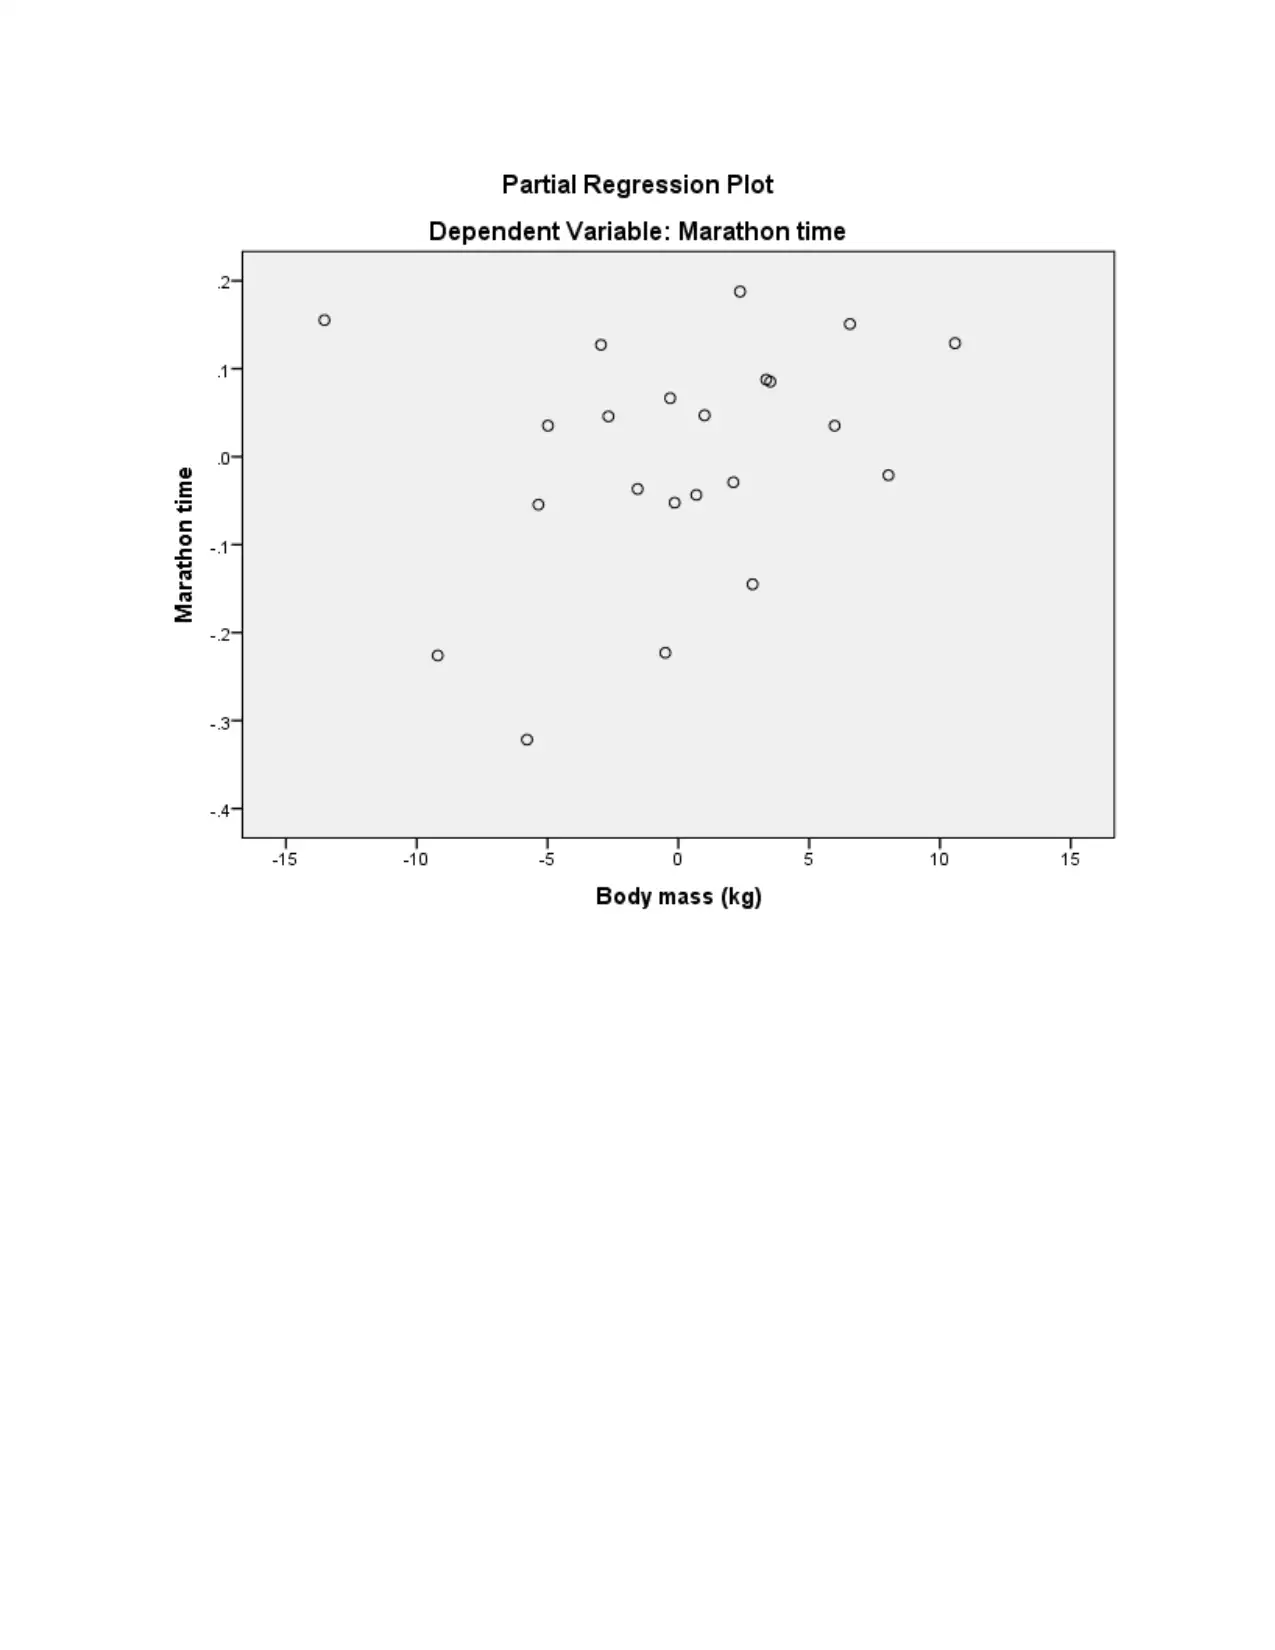
Interpretation- The applied models for developing a graph includes a major assumption
stated as homoscedasticity which is a situation that goes with the assumption that the difference
in the independent and the dependent variable should be very little or same (Chandler and
Polonik, 2017). If the difference value resulted as same and low, it means that the outcome
generated are reliable and accurate predictions could be made.
5. Abstract in relation to above outcomes
By summing up the above study it has been determined that low relationship is present
between Height and Marathon time whereas in between sum of skinfolds and Marathon time is
stronger as its Beta value is high and also correlation is also high among them. The plotting of
the value on the histogram, Scatter diagram reflects that the difference value is evaluated from
the dependent and the independent variable resulting a high difference value. This shows that the
predictions made are not reliable and appropriate as the resulted are based on assumption so true
value cannot be ascertained (Yang and Mathew, 2018). The resulted P value in respect of Height
Paraphrase This Document
Need a fresh take? Get an instant paraphrase of this document with our AI Paraphraser
is greater than 0.05 so null hypothesis is accepted and the other one is rejected while in context
of other variable that includes body mass & sum of skinfolds, as the value is less than 0.05 so
alternative hypothesis is accepted and the null hypothesis is rejected and this in turn depicts that
significance difference is present in between the variables.
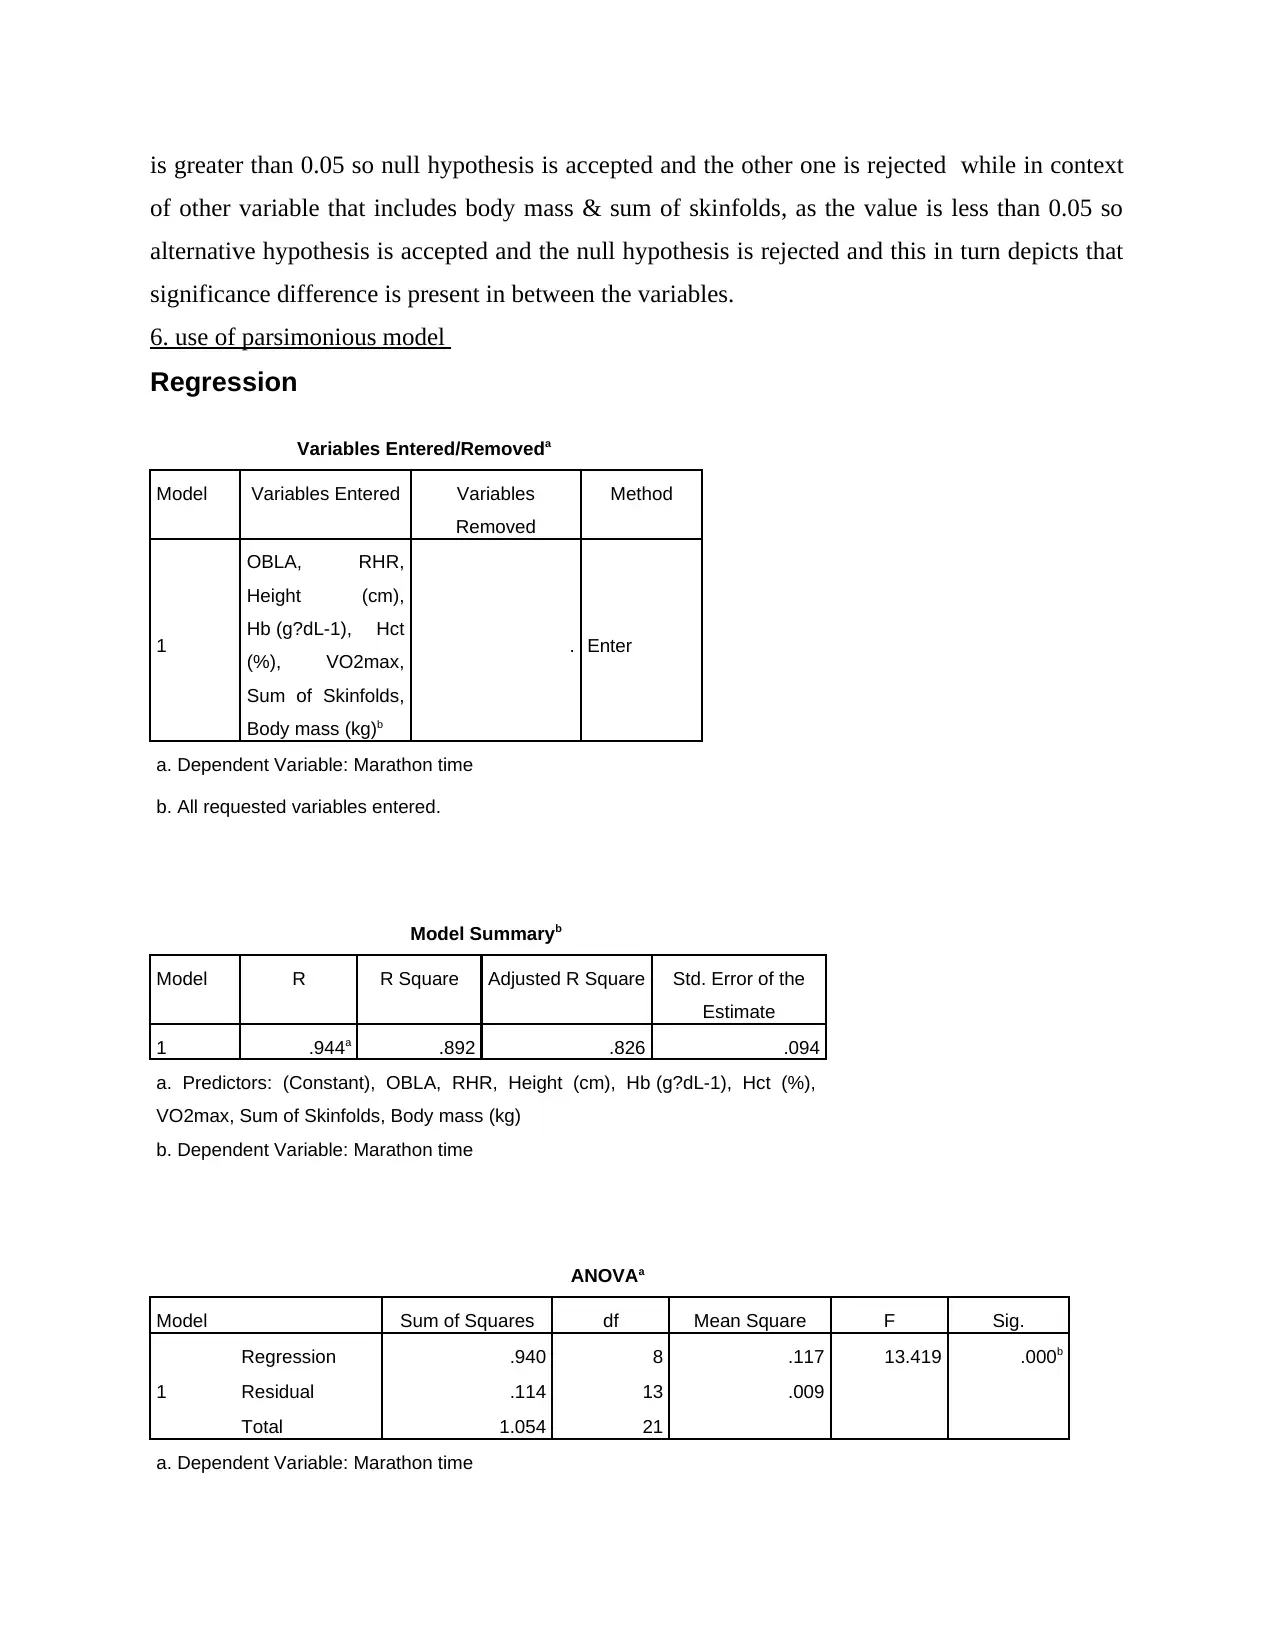
6. use of parsimonious model
Regression
Variables Entered/Removeda
Model Variables Entered Variables
Removed
Method
1
OBLA, RHR,
Height (cm),
Hb (g?dL-1), Hct
(%), VO2max,
Sum of Skinfolds,
Body mass (kg)b
. Enter
a. Dependent Variable: Marathon time
b. All requested variables entered.
Model Summaryb
Model R R Square Adjusted R Square Std. Error of the
Estimate
1 .944a .892 .826 .094
a. Predictors: (Constant), OBLA, RHR, Height (cm), Hb (g?dL-1), Hct (%),
VO2max, Sum of Skinfolds, Body mass (kg)
b. Dependent Variable: Marathon time
ANOVAa
Model Sum of Squares df Mean Square F Sig.
1
Regression .940 8 .117 13.419 .000b
Residual .114 13 .009
Total 1.054 21
a. Dependent Variable: Marathon time
of other variable that includes body mass & sum of skinfolds, as the value is less than 0.05 so
alternative hypothesis is accepted and the null hypothesis is rejected and this in turn depicts that
significance difference is present in between the variables.
6. use of parsimonious model
Regression
Variables Entered/Removeda
Model Variables Entered Variables
Removed
Method
1
OBLA, RHR,
Height (cm),
Hb (g?dL-1), Hct
(%), VO2max,
Sum of Skinfolds,
Body mass (kg)b
. Enter
a. Dependent Variable: Marathon time
b. All requested variables entered.
Model Summaryb
Model R R Square Adjusted R Square Std. Error of the
Estimate
1 .944a .892 .826 .094
a. Predictors: (Constant), OBLA, RHR, Height (cm), Hb (g?dL-1), Hct (%),
VO2max, Sum of Skinfolds, Body mass (kg)
b. Dependent Variable: Marathon time
ANOVAa
Model Sum of Squares df Mean Square F Sig.
1
Regression .940 8 .117 13.419 .000b
Residual .114 13 .009
Total 1.054 21
a. Dependent Variable: Marathon time
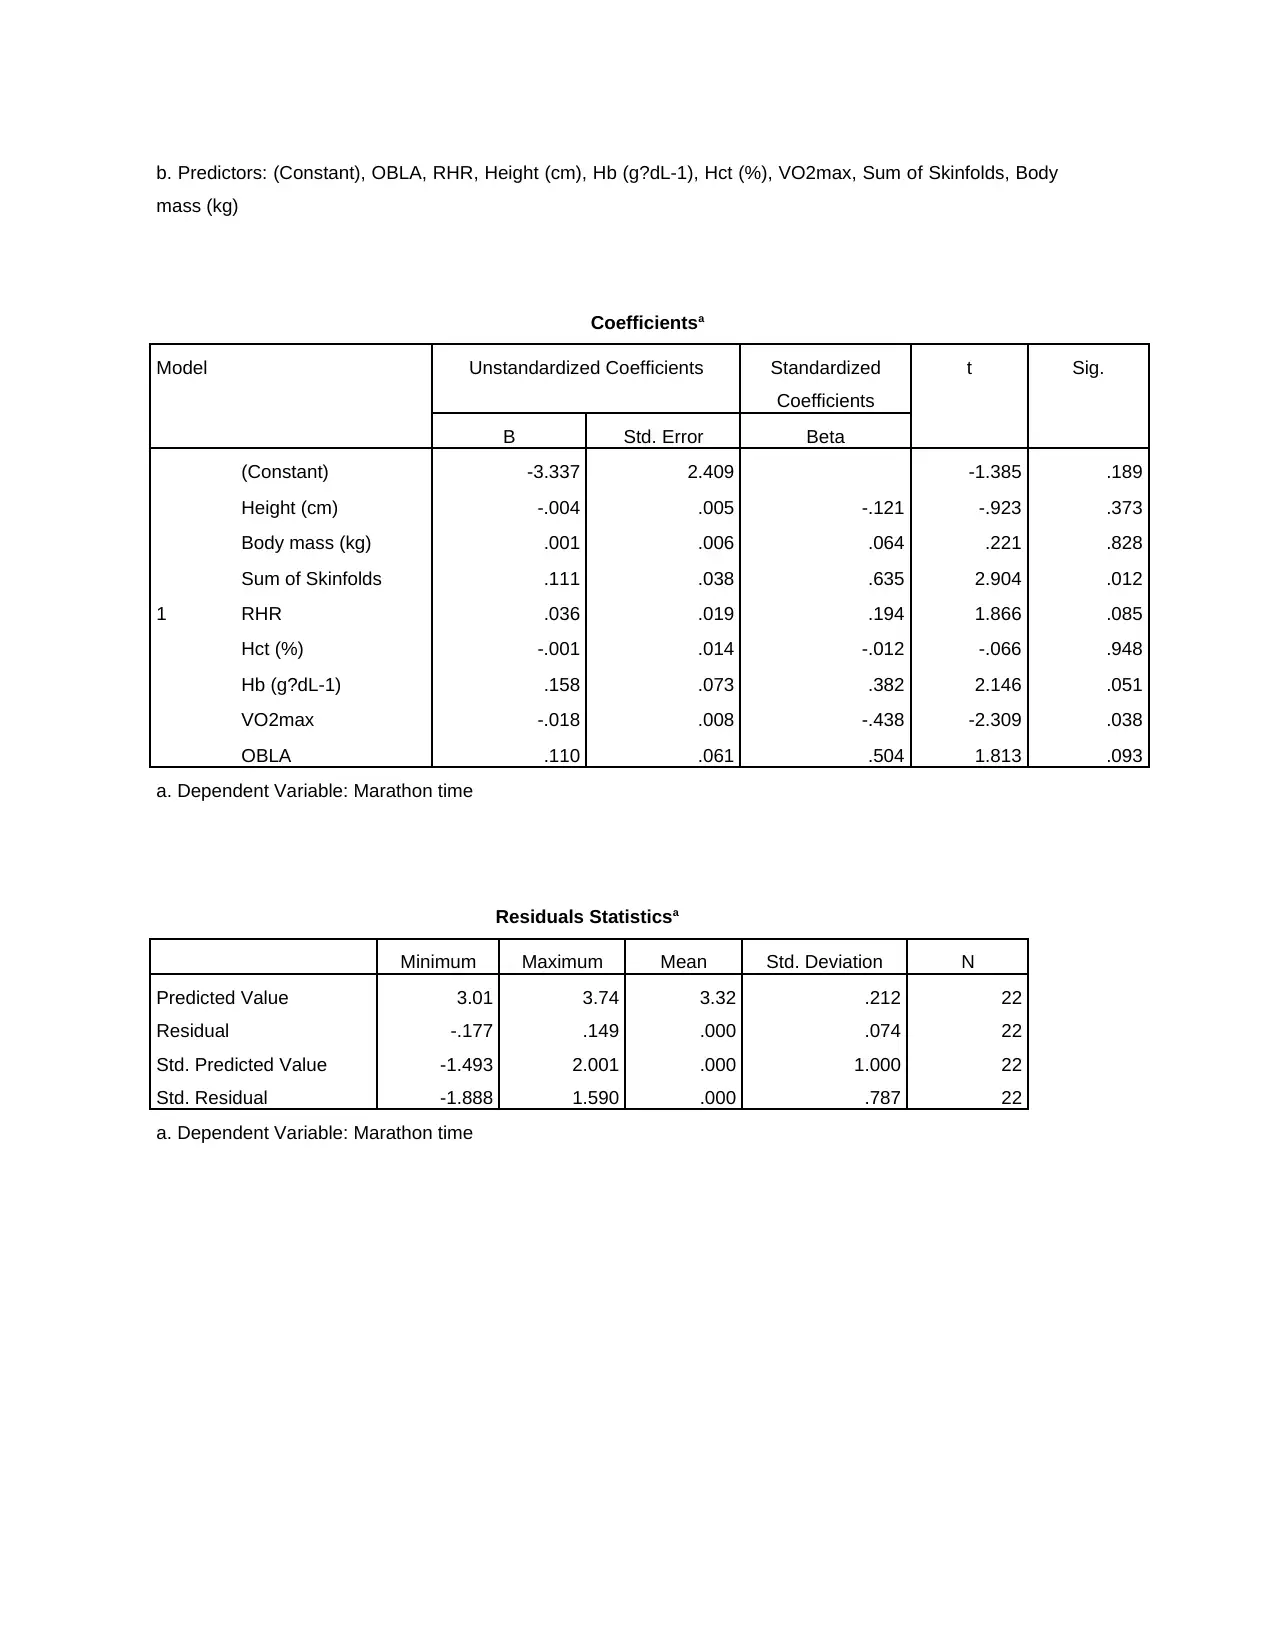
b. Predictors: (Constant), OBLA, RHR, Height (cm), Hb (g?dL-1), Hct (%), VO2max, Sum of Skinfolds, Body
mass (kg)
Coefficientsa
Model Unstandardized Coefficients Standardized
Coefficients
t Sig.
B Std. Error Beta
1
(Constant) -3.337 2.409 -1.385 .189
Height (cm) -.004 .005 -.121 -.923 .373
Body mass (kg) .001 .006 .064 .221 .828
Sum of Skinfolds .111 .038 .635 2.904 .012
RHR .036 .019 .194 1.866 .085
Hct (%) -.001 .014 -.012 -.066 .948
Hb (g?dL-1) .158 .073 .382 2.146 .051
VO2max -.018 .008 -.438 -2.309 .038
OBLA .110 .061 .504 1.813 .093
a. Dependent Variable: Marathon time
Residuals Statisticsa
Minimum Maximum Mean Std. Deviation N
Predicted Value 3.01 3.74 3.32 .212 22
Residual -.177 .149 .000 .074 22
Std. Predicted Value -1.493 2.001 .000 1.000 22
Std. Residual -1.888 1.590 .000 .787 22
a. Dependent Variable: Marathon time
⊘ This is a preview!⊘
Do you want full access?
Subscribe today to unlock all pages.
Trusted by 1+ million students worldwide
1 out of 33

Your All-in-One AI-Powered Toolkit for Academic Success.
+13062052269
info@desklib.com
Available 24*7 on WhatsApp / Email
![[object Object]](/_next/static/media/star-bottom.7253800d.svg)
Unlock your academic potential
Copyright © 2020–2026 A2Z Services. All Rights Reserved. Developed and managed by ZUCOL.