Statistical Analysis Project: Evaluating Mazda 3 Cars in NSW
VerifiedAdded on 2020/07/22
|27
|3158
|51
Project
AI Summary
This statistical analysis project examines the prices of used Mazda 3 cars in New South Wales, focusing on 2014 and 2015 models. The project employs descriptive statistics to compare price ranges, and proportions to assess the availability of white cars. It utilizes one-sample t-tests to analyze odometer readings and independent sample t-tests to compare prices between private sellers and dealers. Linear and multiple regression analyses are conducted to determine the relationship between price and variables such as age, odometer, and transmission. The project includes a business letter summarizing the findings for a client, highlighting the impact of various factors on car prices and providing recommendations for purchasing decisions. The analysis concludes that while price differences exist between the two model years, they are not significant, and the primary factors influencing price are age, odometer, and transmission type.
Statistical Analysis Project
Paraphrase This Document
Need a fresh take? Get an instant paraphrase of this document with our AI Paraphraser
TABLE OF CONTENTS
INTRODUCTION...........................................................................................................................3
PART A...........................................................................................................................................3
QUESTION A.................................................................................................................................3
Stating the descriptive statistics of the price of two and three years old car...............................3
QUESTION B..................................................................................................................................5
To,....................................................................................................................................................5
PART B...........................................................................................................................................6
Question 1 Stating the proportion of car available for sale is white............................................6
Question 2 Assessing two and years used car having odometer less than 50000 km.................6
TASK 3: WRITTEN ANSWER......................................................................................................7
PART C...........................................................................................................................................8
TASK 1............................................................................................................................................8
Question 1 Independent sample t test..........................................................................................8
Question 2 Presenting linear regression analysis related to age and price..................................8
Question 3 Presenting multiple regression analysis of variables like price, age, odometer and
transmission.................................................................................................................................9
TASK 2............................................................................................................................................9
Presenting results of evaluation to the client via business letter.................................................9
CONCLUSION APPENDIX.........................................................................................................10
APPENDIX....................................................................................................................................11
Appendix 1: Question 2 of part b..............................................................................................11
Question 1 Stating the proportion of car available for sale is white..........................................12
Question 2 Assessing two and years used car having odometer less than 50000 km...............12
Appendix 2: 1 of Part C.............................................................................................................12
Appendix 3: 2 of Part C.............................................................................................................13
Appendix 4: 3 of Part C.............................................................................................................19
Appendix 4: 3 of Part C.............................................................................................................19
⊘ This is a preview!⊘
Do you want full access?
Subscribe today to unlock all pages.
Trusted by 1+ million students worldwide
INTRODUCTION
Statistical analysis implies for the process of collecting, exploring and analyzing large
data set which in turn helps in discovering suitable pattern or trend. Such analysis is highly
significant which in turn provides assistance in evaluating quantitative data set in an appropriate
manner and thereby aid in decision making. On the basis of cited case situation, individual
wishes to purchase two and three year old cars such as Mazda 3 pertaining to the state of New
South Wales. In this context, report will provide deeper insight about the manner in which
statistical tools namely regression, one sample and independent t test helps in taking appropriate
decision.
PART A
QUESTION A
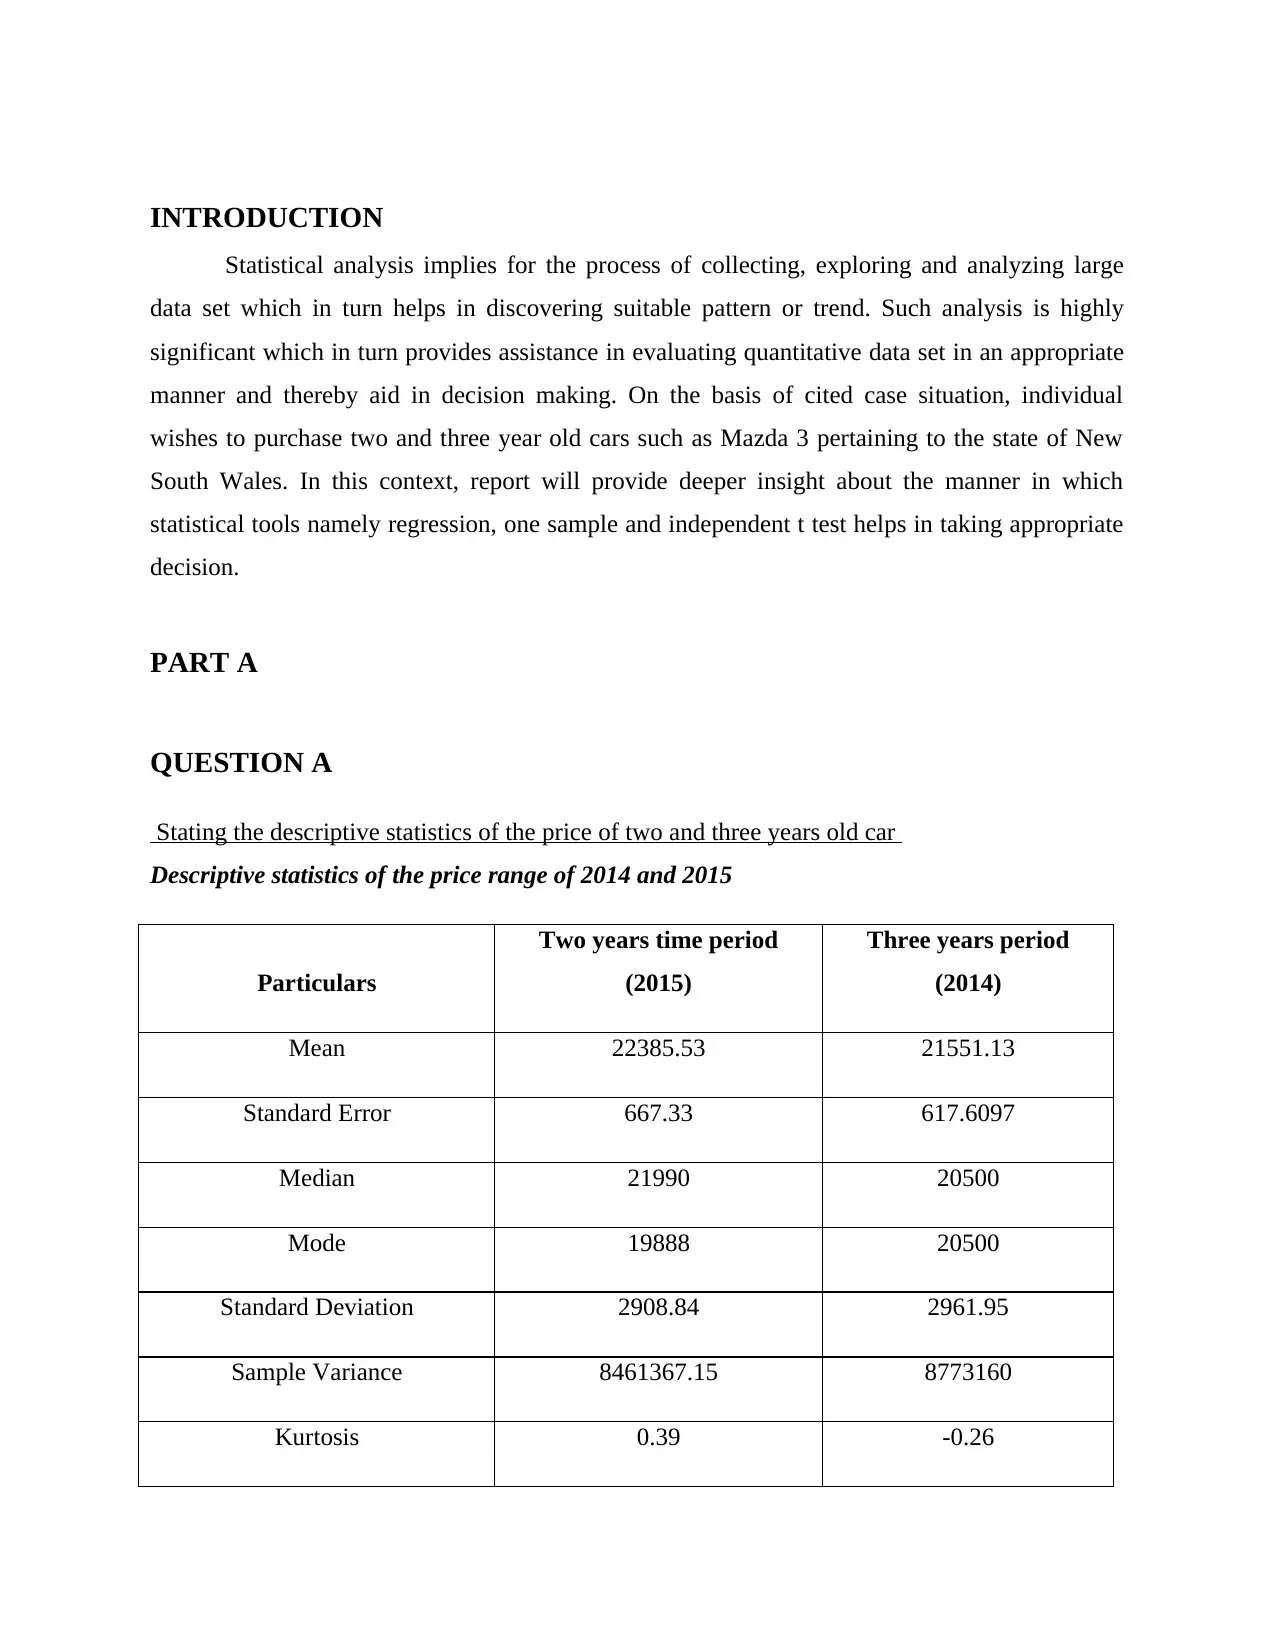
Stating the descriptive statistics of the price of two and three years old car
Descriptive statistics of the price range of 2014 and 2015
Particulars
Two years time period
(2015)
Three years period
(2014)
Mean 22385.53 21551.13
Standard Error 667.33 617.6097
Median 21990 20500
Mode 19888 20500
Standard Deviation 2908.84 2961.95
Sample Variance 8461367.15 8773160
Kurtosis 0.39 -0.26
Statistical analysis implies for the process of collecting, exploring and analyzing large
data set which in turn helps in discovering suitable pattern or trend. Such analysis is highly
significant which in turn provides assistance in evaluating quantitative data set in an appropriate
manner and thereby aid in decision making. On the basis of cited case situation, individual
wishes to purchase two and three year old cars such as Mazda 3 pertaining to the state of New
South Wales. In this context, report will provide deeper insight about the manner in which
statistical tools namely regression, one sample and independent t test helps in taking appropriate
decision.
PART A
QUESTION A
Stating the descriptive statistics of the price of two and three years old car
Descriptive statistics of the price range of 2014 and 2015
Particulars
Two years time period
(2015)
Three years period
(2014)
Mean 22385.53 21551.13
Standard Error 667.33 617.6097
Median 21990 20500
Mode 19888 20500
Standard Deviation 2908.84 2961.95
Sample Variance 8461367.15 8773160
Kurtosis 0.39 -0.26
Paraphrase This Document
Need a fresh take? Get an instant paraphrase of this document with our AI Paraphraser
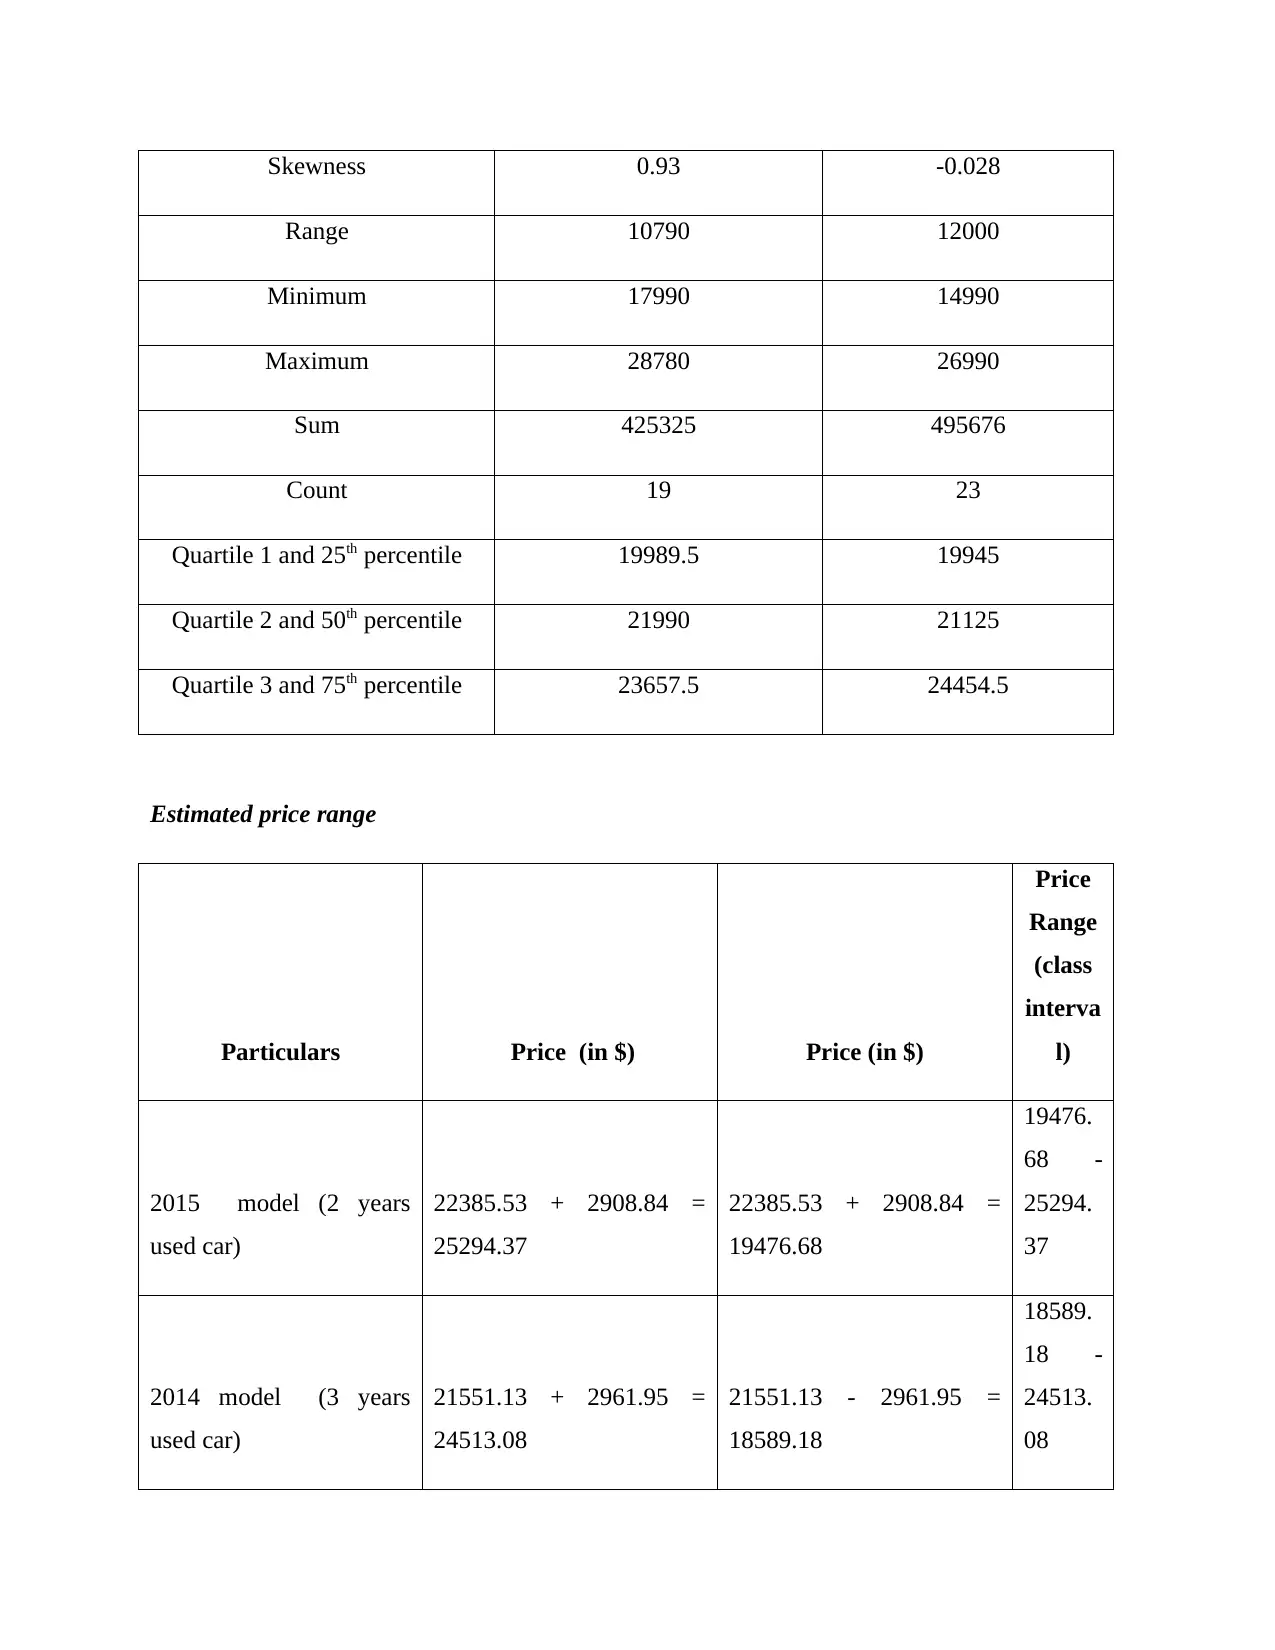
Skewness 0.93 -0.028
Range 10790 12000
Minimum 17990 14990
Maximum 28780 26990
Sum 425325 495676
Count 19 23
Quartile 1 and 25th percentile 19989.5 19945
Quartile 2 and 50th percentile 21990 21125
Quartile 3 and 75th percentile 23657.5 24454.5
Estimated price range
Particulars Price (in $) Price (in $)
Price
Range
(class
interva
l)
2015 model (2 years
used car)
22385.53 + 2908.84 =
25294.37
22385.53 + 2908.84 =
19476.68
19476.
68 -
25294.
37
2014 model (3 years
used car)
21551.13 + 2961.95 =
24513.08
21551.13 - 2961.95 =
18589.18
18589.
18 -
24513.
08

⊘ This is a preview!⊘
Do you want full access?
Subscribe today to unlock all pages.
Trusted by 1+ million students worldwide

QUESTION B
Paraphrase This Document
Need a fresh take? Get an instant paraphrase of this document with our AI Paraphraser
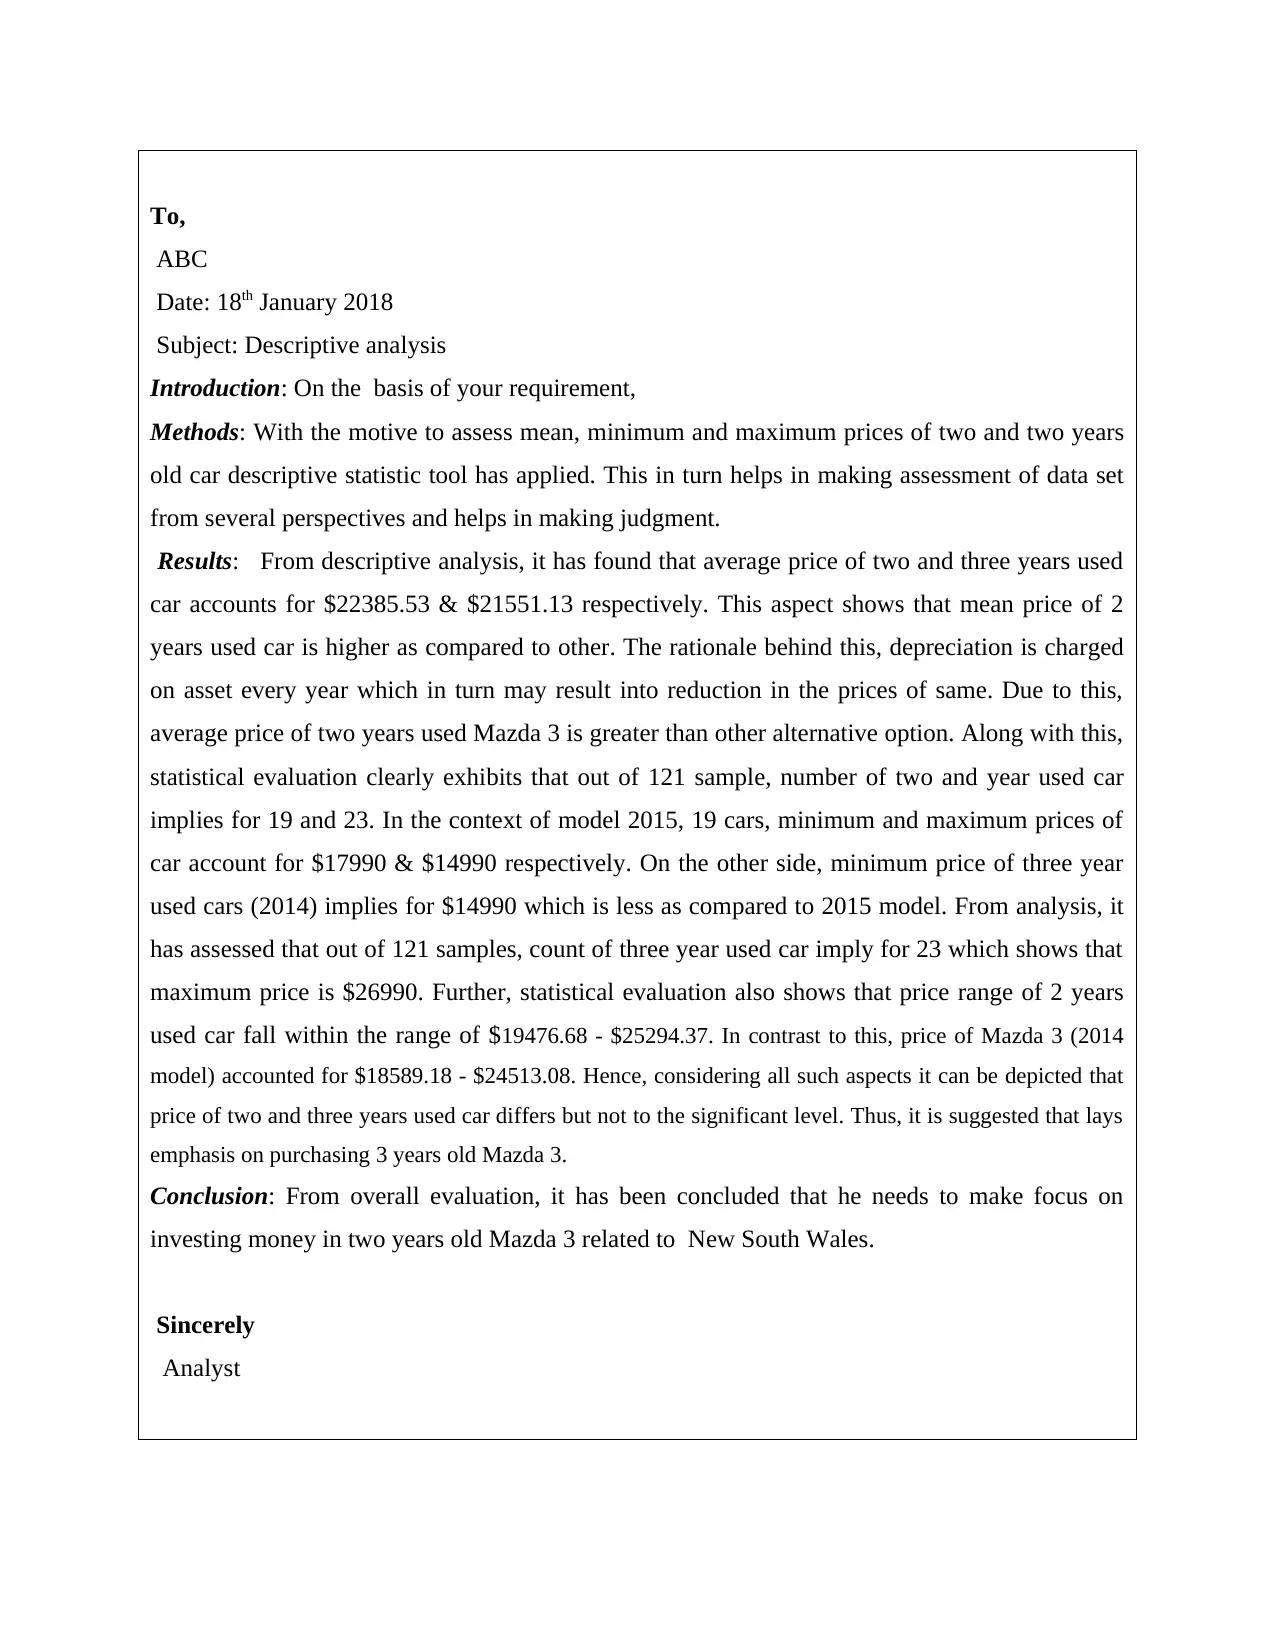
To,
ABC
Date: 18th January 2018
Subject: Descriptive analysis
Introduction: On the basis of your requirement,
Methods: With the motive to assess mean, minimum and maximum prices of two and two years
old car descriptive statistic tool has applied. This in turn helps in making assessment of data set
from several perspectives and helps in making judgment.
Results: From descriptive analysis, it has found that average price of two and three years used
car accounts for $22385.53 & $21551.13 respectively. This aspect shows that mean price of 2
years used car is higher as compared to other. The rationale behind this, depreciation is charged
on asset every year which in turn may result into reduction in the prices of same. Due to this,
average price of two years used Mazda 3 is greater than other alternative option. Along with this,
statistical evaluation clearly exhibits that out of 121 sample, number of two and year used car
implies for 19 and 23. In the context of model 2015, 19 cars, minimum and maximum prices of
car account for $17990 & $14990 respectively. On the other side, minimum price of three year
used cars (2014) implies for $14990 which is less as compared to 2015 model. From analysis, it
has assessed that out of 121 samples, count of three year used car imply for 23 which shows that
maximum price is $26990. Further, statistical evaluation also shows that price range of 2 years
used car fall within the range of $19476.68 - $25294.37. In contrast to this, price of Mazda 3 (2014
model) accounted for $18589.18 - $24513.08. Hence, considering all such aspects it can be depicted that
price of two and three years used car differs but not to the significant level. Thus, it is suggested that lays
emphasis on purchasing 3 years old Mazda 3.
Conclusion: From overall evaluation, it has been concluded that he needs to make focus on
investing money in two years old Mazda 3 related to New South Wales.
Sincerely
Analyst
PART B
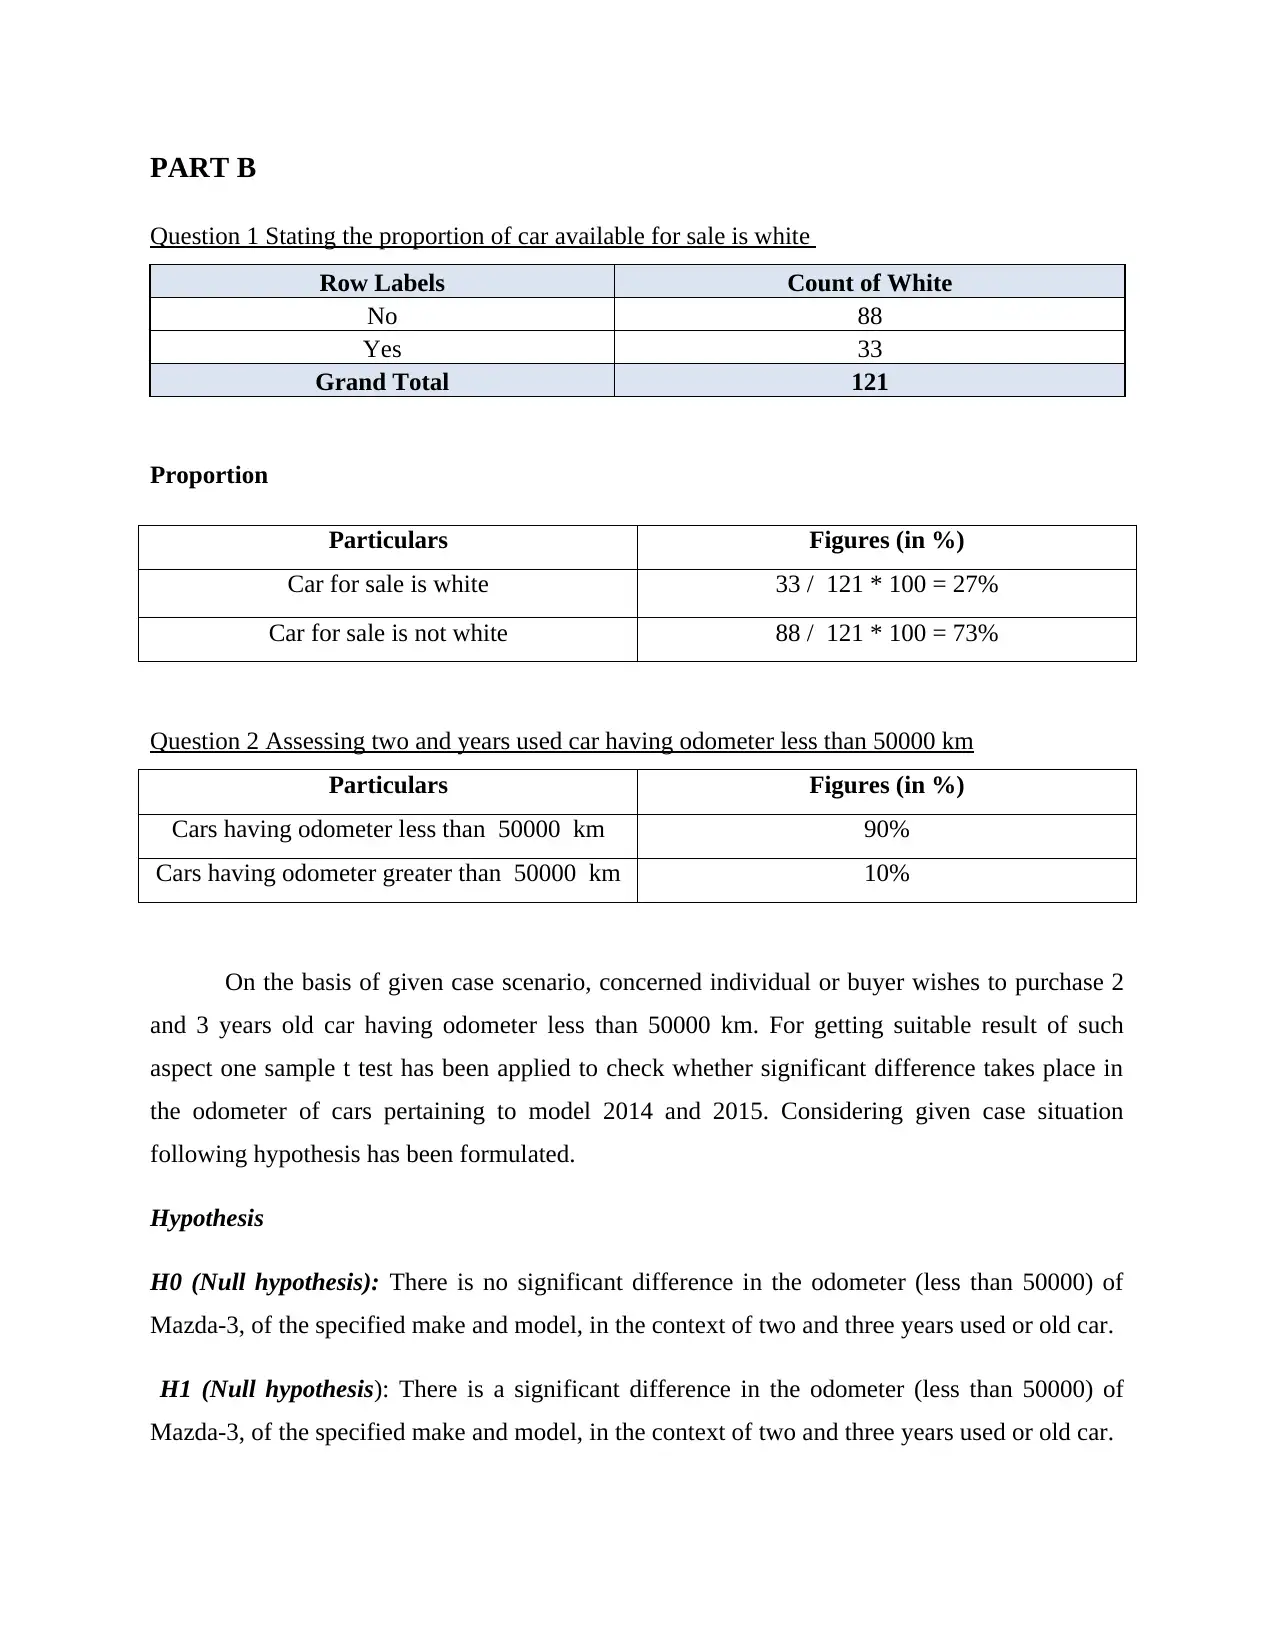
Question 1 Stating the proportion of car available for sale is white
Row Labels Count of White
No 88
Yes 33
Grand Total 121
Proportion
Particulars Figures (in %)
Car for sale is white 33 / 121 * 100 = 27%
Car for sale is not white 88 / 121 * 100 = 73%
Question 2 Assessing two and years used car having odometer less than 50000 km
Particulars Figures (in %)
Cars having odometer less than 50000 km 90%
Cars having odometer greater than 50000 km 10%
On the basis of given case scenario, concerned individual or buyer wishes to purchase 2
and 3 years old car having odometer less than 50000 km. For getting suitable result of such
aspect one sample t test has been applied to check whether significant difference takes place in
the odometer of cars pertaining to model 2014 and 2015. Considering given case situation
following hypothesis has been formulated.
Hypothesis
H0 (Null hypothesis): There is no significant difference in the odometer (less than 50000) of
Mazda-3, of the specified make and model, in the context of two and three years used or old car.
H1 (Null hypothesis): There is a significant difference in the odometer (less than 50000) of
Mazda-3, of the specified make and model, in the context of two and three years used or old car.
⊘ This is a preview!⊘
Do you want full access?
Subscribe today to unlock all pages.
Trusted by 1+ million students worldwide
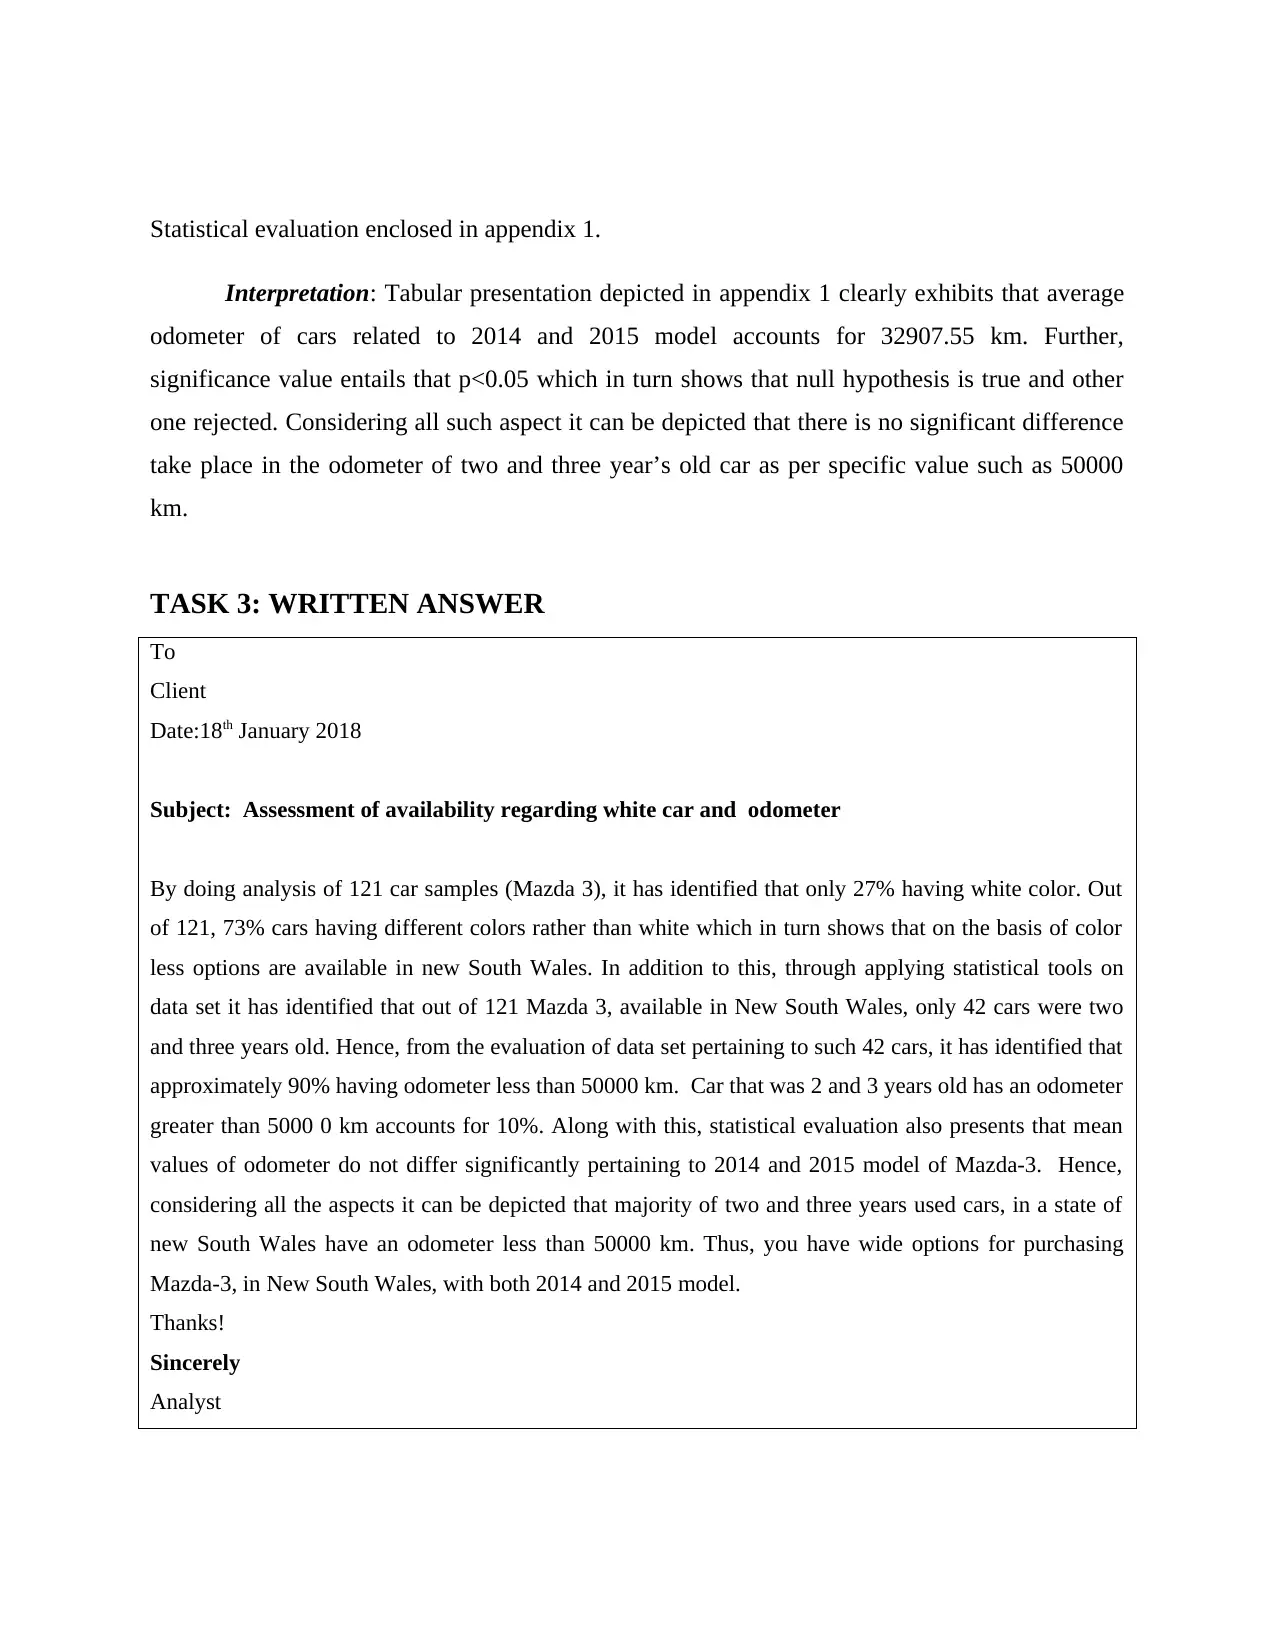
Statistical evaluation enclosed in appendix 1.
Interpretation: Tabular presentation depicted in appendix 1 clearly exhibits that average
odometer of cars related to 2014 and 2015 model accounts for 32907.55 km. Further,
significance value entails that p<0.05 which in turn shows that null hypothesis is true and other
one rejected. Considering all such aspect it can be depicted that there is no significant difference
take place in the odometer of two and three year’s old car as per specific value such as 50000
km.
TASK 3: WRITTEN ANSWER
To
Client
Date:18th January 2018
Subject: Assessment of availability regarding white car and odometer
By doing analysis of 121 car samples (Mazda 3), it has identified that only 27% having white color. Out
of 121, 73% cars having different colors rather than white which in turn shows that on the basis of color
less options are available in new South Wales. In addition to this, through applying statistical tools on
data set it has identified that out of 121 Mazda 3, available in New South Wales, only 42 cars were two
and three years old. Hence, from the evaluation of data set pertaining to such 42 cars, it has identified that
approximately 90% having odometer less than 50000 km. Car that was 2 and 3 years old has an odometer
greater than 5000 0 km accounts for 10%. Along with this, statistical evaluation also presents that mean
values of odometer do not differ significantly pertaining to 2014 and 2015 model of Mazda-3. Hence,
considering all the aspects it can be depicted that majority of two and three years used cars, in a state of
new South Wales have an odometer less than 50000 km. Thus, you have wide options for purchasing
Mazda-3, in New South Wales, with both 2014 and 2015 model.
Thanks!
Sincerely
Analyst
Paraphrase This Document
Need a fresh take? Get an instant paraphrase of this document with our AI Paraphraser
PART C
TASK 1
Question 1 Independent sample t test
Hypothesis
H0 (Null hypothesis): There is no significant difference in the mean price of cars for sale
privately and by a used car dealer
H1 (Null hypothesis): There is no significant difference in the mean price of cars for sale
privately and by a used car dealer
Calculation depicted in appendix 2.
Interpretation: Results of independent sample t test shows that average prices accounts
for $16048.53 when car is sold by dealer. On the other side, in the case of private seller mean
value implies for $16432.50 significantly. In addition to this, p>0.05 that entails that average
price level of cars significantly vary as per seller. Hence, from evaluation it can be stated that
null hypothesis is true.
Question 2 Presenting linear regression analysis related to age and price
H0 (Null hypothesis): There is no significant linear relationship between age and price of
Mazda-3.
H1 (Null hypothesis): There is a significant linear relationship between age and price of Mazda-
3.
Calculation depicted in appendix 3.
Interpretation: Model summary table, referring appendix 3, it can be mentioned that R
and R square accounts for .86 & .74 respectively. Level of R entails that both age and price
variable of car is highly correlated. Along with this, it has assessed from evaluation that
significance value is 0.00 that falls within standard limit such as 0.05. Hence, all the aspects or
outcome indicates that alternative hypothesis is true. On the basis of overall evaluation, it can be
presented that significant relationship exists between age and price of Mazda-3 in a state of New
South Wales.
Question 3 Presenting multiple regression analysis of variables like price, age, odometer and
transmission
H0 (Null hypothesis): There is no significant relationship of price pertaining to Mazda-3 with
age, odometer and transmission.
H1 (Null hypothesis): There is a significant linear relationship price pertaining to Mazda-3 with
age, odometer and transmission.
Calculation depicted in appendix 4.
Interpretation: Statistical evaluation of multiple regressions shows that price of Mazda-3
is highly and positively correlated with age, odometer and transmission. Results of evaluation
present that R accounts for .896 significantly. In addition to this, significance value in the case of
age and odometer implies for 0.00, whereas p in the context of transmission variable is .01.
Overall, p<0.05 which presents that alternative hypothesis has accepted. Hence, statistical
significant correlation takes place between price and age, odometer as well as transmission.
Further, graphical presentation of appendix 4 shows that all the values or results are in line with
scatter plot.
TASK 2
Presenting results of evaluation to the client via business letter
To
Client
Date:18th January 2018
Subject: Determining relationship of price with other variables
From assessment of data set, it is reported that you will find significant difference in the price if car will
be purchased through dealer. Moreover, dealers charge commission for the deal or services offered so it
so it is recognized as main cause due to which prices of car will be higher in such case over private
⊘ This is a preview!⊘
Do you want full access?
Subscribe today to unlock all pages.
Trusted by 1+ million students worldwide
1 out of 27
Related Documents


Your All-in-One AI-Powered Toolkit for Academic Success.
+13062052269
info@desklib.com
Available 24*7 on WhatsApp / Email
![[object Object]](/_next/static/media/star-bottom.7253800d.svg)
Unlock your academic potential
Copyright © 2020–2026 A2Z Services. All Rights Reserved. Developed and managed by ZUCOL.