Murano Restaurant: Data Analysis and Business Decision Making Report
VerifiedAdded on 2019/12/17
|19
|3851
|473
Report
AI Summary
This report provides a comprehensive analysis of Murano Restaurant's business decision-making process. It begins by outlining plans for collecting both primary and secondary data, including personal interviews, emails, observations, and simulations, along with a detailed survey methodology and questionnaire format. The report then delves into the statistical tools used for data analysis, such as mean, median, mode, measures of dispersion (standard deviation, variance, correlation coefficient, and range), and quartiles/percentiles, using revenue and profit data from the last ten years. Furthermore, it discusses conclusions drawn from graphs, trend lines, and the creation of a business presentation and report. Finally, the report explores the application of information tools for decision-making, including a business plan, Gantt chart, NPV, and IRR calculations, providing a well-rounded view of the data-driven decision-making process for the restaurant, including its potential for expansion.
Business Decision
Making
Making
Paraphrase This Document
Need a fresh take? Get an instant paraphrase of this document with our AI Paraphraser
TABLE OF CONTENTS
INTRODUCTION...........................................................................................................................3
TASK- 1...........................................................................................................................................3
1.1 Plan For the Collection Of Primary & Secondary Data.........................................................3
1.2 Survey Methodology..............................................................................................................4
1.3 Questionnaire Format For Murano........................................................................................5
2.1 Information Used in Decision Making..................................................................................7
2.2 Mean, Median & Mode .........................................................................................................8
2.3 Measures Of Dispersion ........................................................................................................8
2.4 Quartiles & Percentiles..........................................................................................................9
TASK-2..........................................................................................................................................10
3.1 Conclusions Based on Graphs.............................................................................................10
3.2 Trend Lines..........................................................................................................................13
3.3 Business Presentation .........................................................................................................13
3.4 Business Report...................................................................................................................13
TASK-3..........................................................................................................................................14
4.1 Information Tools For Decision-Making.............................................................................14
4.2 Business Plan and Gantt Chart.............................................................................................14
4.3 NPV & IRR .........................................................................................................................16
CONCLUSION..............................................................................................................................16
REFERENCES..............................................................................................................................18
2
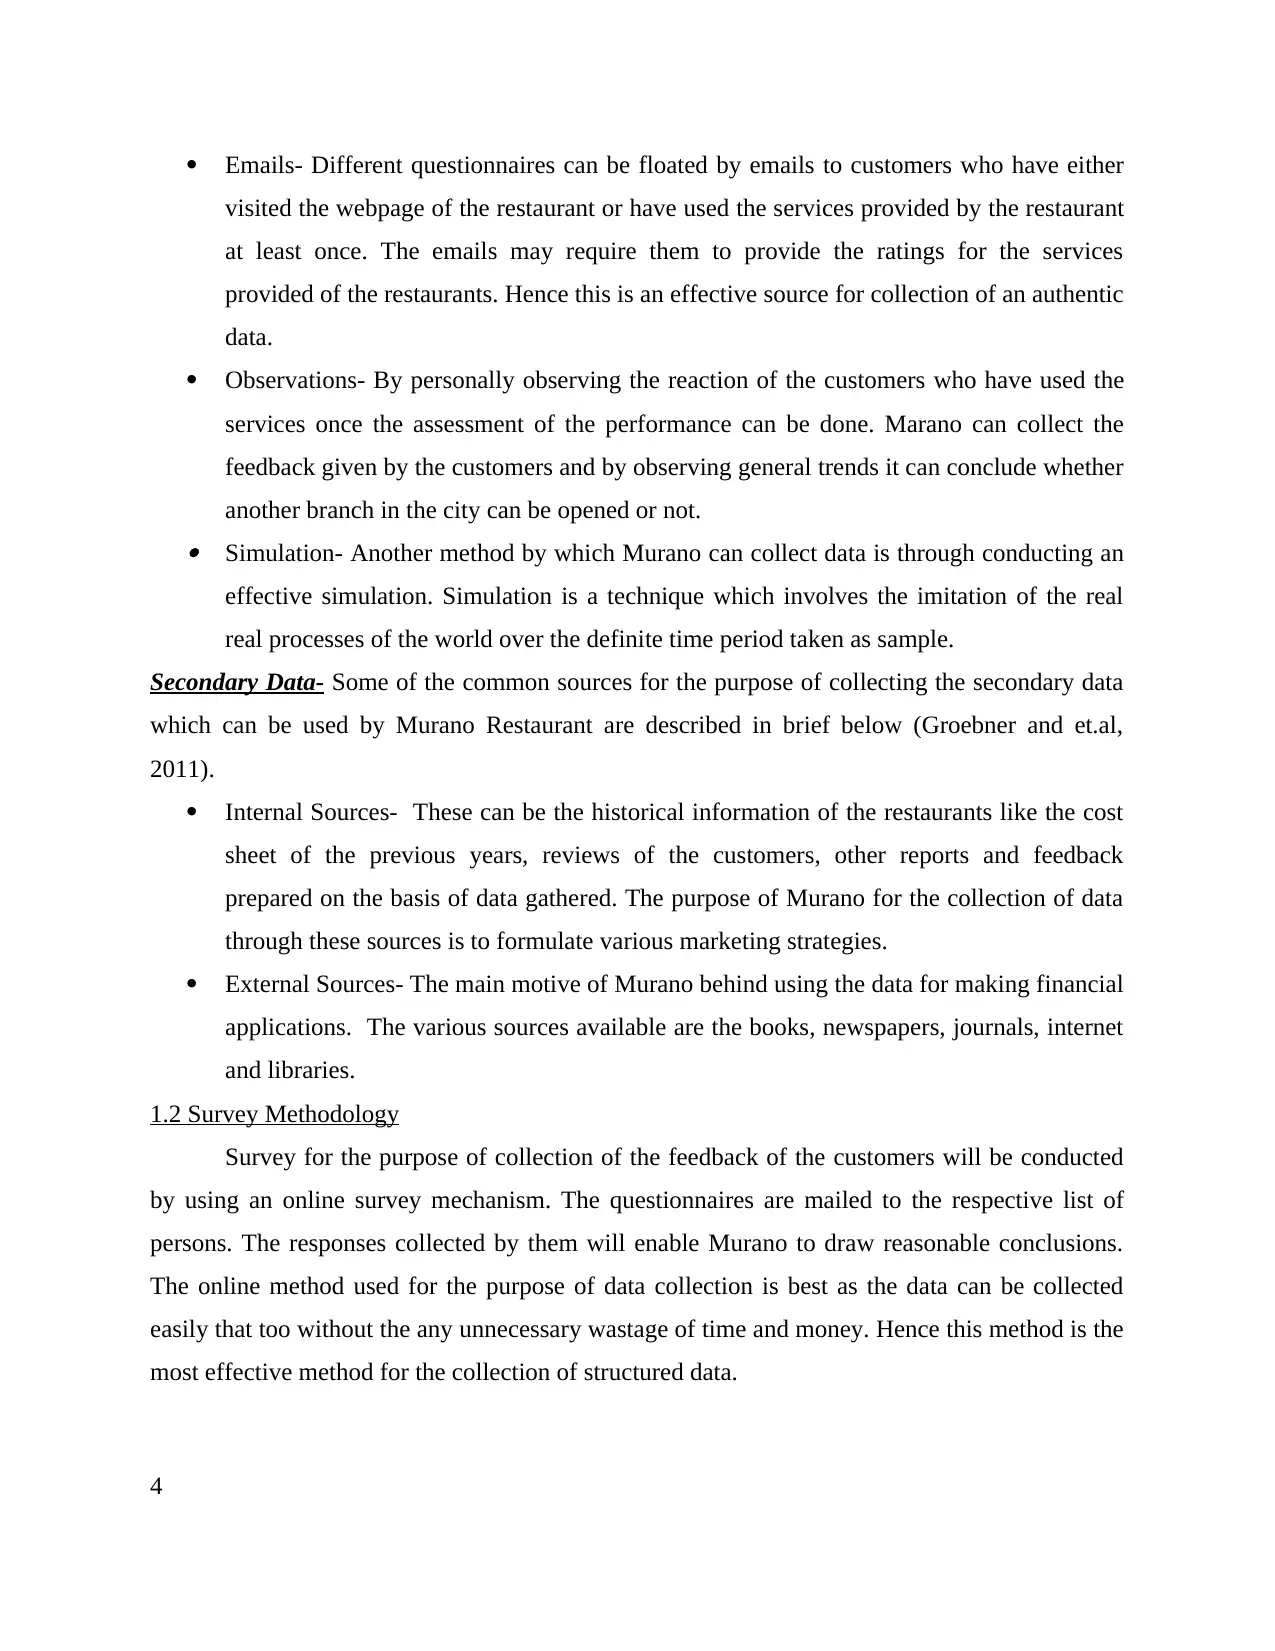
INTRODUCTION
Decision making is an integral part of every successful business enterprise in the present
scenario. Rational and sound decision making on the basis of statistical data is the primary
function of the management executives in any organization. Decision making processes are the
indispensable and continuous component for managing any company and its business activities.
The present report will provide a a detailed description of the various statistical tools that can be
used for the purpose of efficient and effective decision making (Groebner and et.al, 2011). The
study will also help in analyzing the various data collected from the external and internal
environment and hence enable the organization to take decisions on a reasonable basis. For the
purpose of carrying out this assessment Murano restaurant is selected. It is the food chain
restaurant which operating in London and is presently considering for opening a second branch.
TASK- 1
1.1 Plan For the Collection Of Primary & Secondary Data
For the purpose of carrying out data interpretation and take effective decisions on that
basis the activity of data collection plays a vital role. Data is the primary input for any kind of
decision making exercise. There are two broad classification of methods by which a business can
be collected. They are primary and secondary sources of data collection. The first hand evidence
left behind by the observers or the participants at a particular time is called primary data. That
means this data is directly collected from the participants or people for the purpose of decision-
making. On the contrary the secondary sources of data is collected and interpreted by someone
else and used for the purpose of making decisions (Groebner and et.al, 2011). Secondary Sources
discuss, describe, comment upon, analyze and comment upon the data collected from primary
sources. Below is a brief description of the various sources by which data can be collected
through primary and secondary sources.
Primary data- The following are some of the sources from which Murano can collect the data
which can be used for an effective decision making.
Personal Interviews- Interviews of the people residing nearby can be taken. The
observation are to be recorded that can be interpreted later on. The opinions of the people
can be used in making the necessary changes (Hwang and Yoon, 2012).
3
⊘ This is a preview!⊘
Do you want full access?
Subscribe today to unlock all pages.
Trusted by 1+ million students worldwide
Emails- Different questionnaires can be floated by emails to customers who have either
visited the webpage of the restaurant or have used the services provided by the restaurant
at least once. The emails may require them to provide the ratings for the services
provided of the restaurants. Hence this is an effective source for collection of an authentic
data.
Observations- By personally observing the reaction of the customers who have used the
services once the assessment of the performance can be done. Marano can collect the
feedback given by the customers and by observing general trends it can conclude whether
another branch in the city can be opened or not. Simulation- Another method by which Murano can collect data is through conducting an
effective simulation. Simulation is a technique which involves the imitation of the real
real processes of the world over the definite time period taken as sample.
Secondary Data- Some of the common sources for the purpose of collecting the secondary data
which can be used by Murano Restaurant are described in brief below (Groebner and et.al,
2011).
Internal Sources- These can be the historical information of the restaurants like the cost
sheet of the previous years, reviews of the customers, other reports and feedback
prepared on the basis of data gathered. The purpose of Murano for the collection of data
through these sources is to formulate various marketing strategies.
External Sources- The main motive of Murano behind using the data for making financial
applications. The various sources available are the books, newspapers, journals, internet
and libraries.
1.2 Survey Methodology
Survey for the purpose of collection of the feedback of the customers will be conducted
by using an online survey mechanism. The questionnaires are mailed to the respective list of
persons. The responses collected by them will enable Murano to draw reasonable conclusions.
The online method used for the purpose of data collection is best as the data can be collected
easily that too without the any unnecessary wastage of time and money. Hence this method is the
most effective method for the collection of structured data.
4
Paraphrase This Document
Need a fresh take? Get an instant paraphrase of this document with our AI Paraphraser
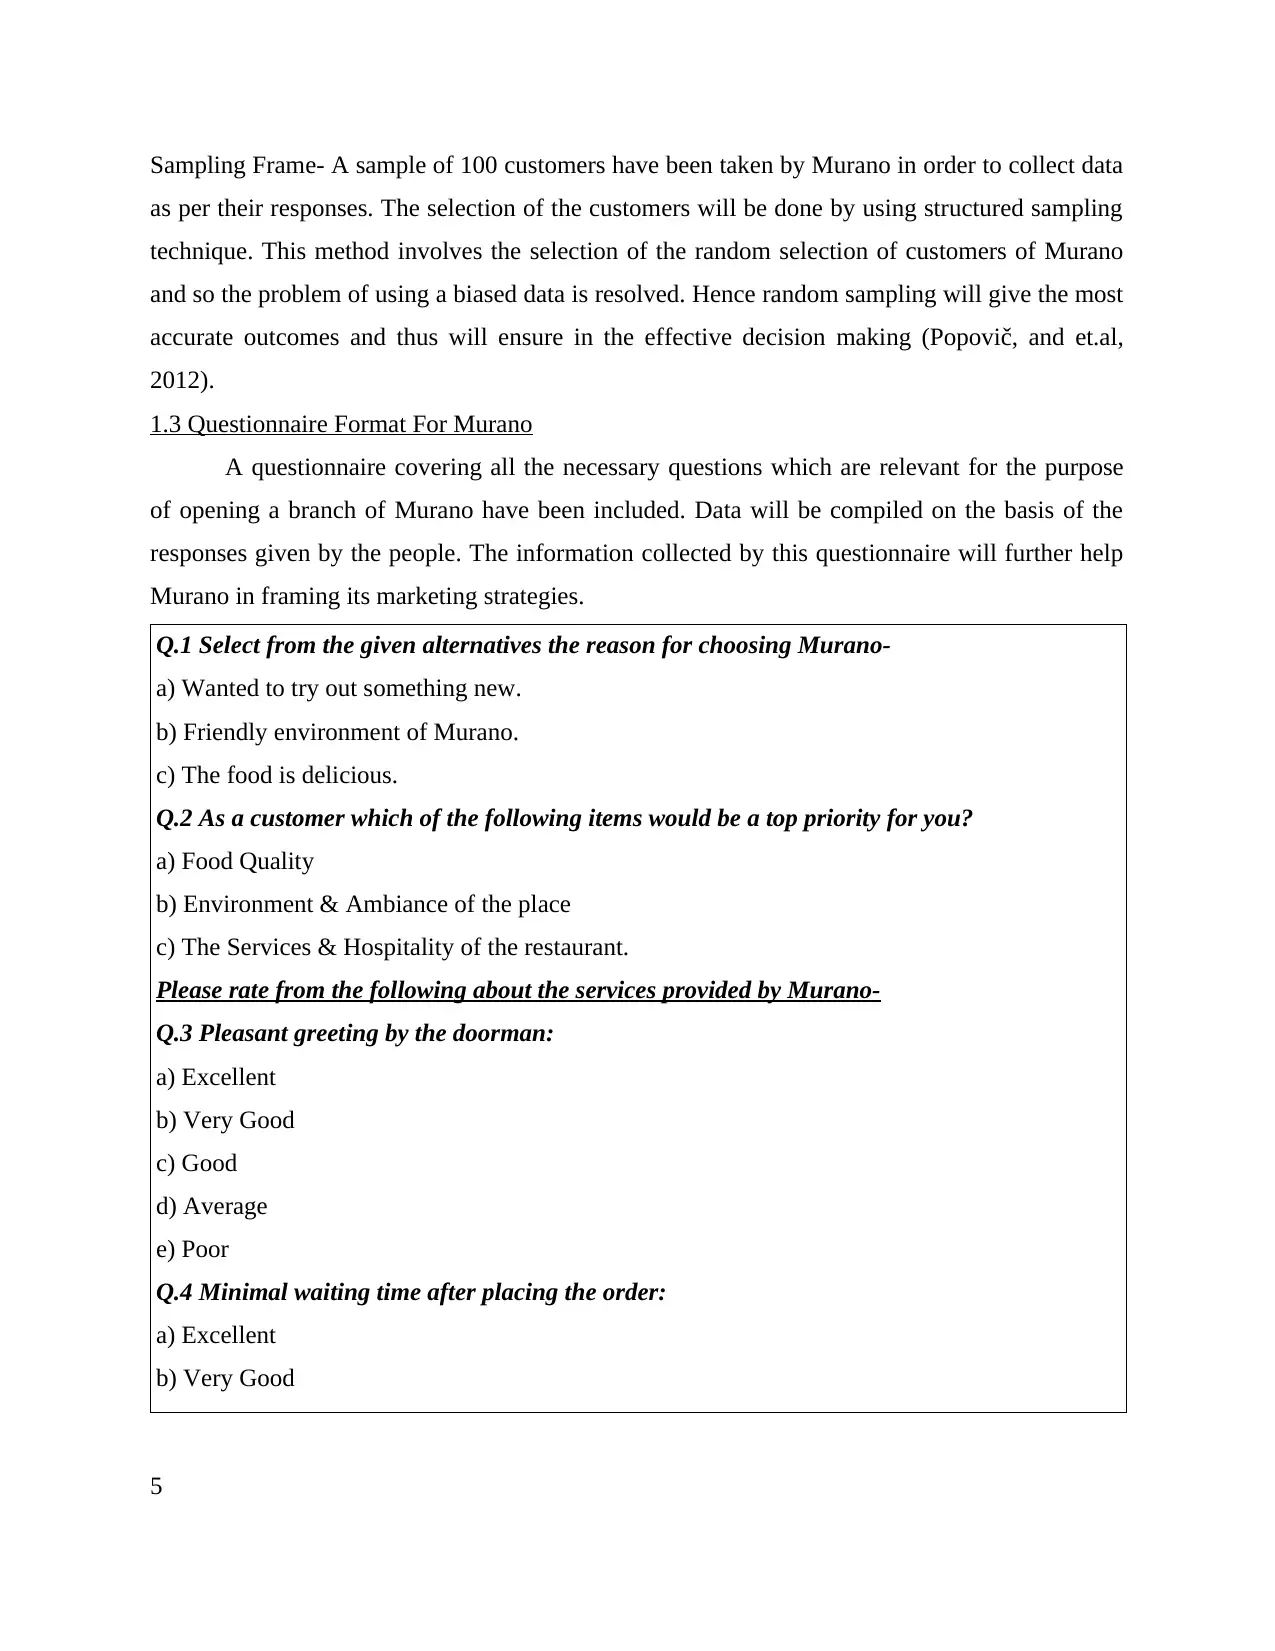
Sampling Frame- A sample of 100 customers have been taken by Murano in order to collect data
as per their responses. The selection of the customers will be done by using structured sampling
technique. This method involves the selection of the random selection of customers of Murano
and so the problem of using a biased data is resolved. Hence random sampling will give the most
accurate outcomes and thus will ensure in the effective decision making (Popovič, and et.al,
2012).
1.3 Questionnaire Format For Murano
A questionnaire covering all the necessary questions which are relevant for the purpose
of opening a branch of Murano have been included. Data will be compiled on the basis of the
responses given by the people. The information collected by this questionnaire will further help
Murano in framing its marketing strategies.
Q.1 Select from the given alternatives the reason for choosing Murano-
a) Wanted to try out something new.
b) Friendly environment of Murano.
c) The food is delicious.
Q.2 As a customer which of the following items would be a top priority for you?
a) Food Quality
b) Environment & Ambiance of the place
c) The Services & Hospitality of the restaurant.
Please rate from the following about the services provided by Murano-
Q.3 Pleasant greeting by the doorman:
a) Excellent
b) Very Good
c) Good
d) Average
e) Poor
Q.4 Minimal waiting time after placing the order:
a) Excellent
b) Very Good
5
c) Good
d) Average
e) Poor
Q.5 Courtesy displayed by the staff at the front desk:
a) Excellent
b) Very good
c) Good
d) Average
e) Poor
Q.6 Orderly Reservations made by the restaurant as soon as I arrive:
a) Excellent
b) Very Good
c) Good
d) Average
e) Poor
Q.7 Promptness of Services Provided:
a) Excellent
b) Very Good
c) Good
d) Average
e) Poor
Q.8 Quality & taste of food served:
a) Excellent
b) Very Good
c) Good
d) Average
e) Poor
Q.9 Environment of Murano:
6
d) Average
e) Poor
Q.5 Courtesy displayed by the staff at the front desk:
a) Excellent
b) Very good
c) Good
d) Average
e) Poor
Q.6 Orderly Reservations made by the restaurant as soon as I arrive:
a) Excellent
b) Very Good
c) Good
d) Average
e) Poor
Q.7 Promptness of Services Provided:
a) Excellent
b) Very Good
c) Good
d) Average
e) Poor
Q.8 Quality & taste of food served:
a) Excellent
b) Very Good
c) Good
d) Average
e) Poor
Q.9 Environment of Murano:
6
⊘ This is a preview!⊘
Do you want full access?
Subscribe today to unlock all pages.
Trusted by 1+ million students worldwide
a) Excellent
b) Very Good
c) Good
d) Average
e) Poor
Q.11 The level of hygiene maintained :
a) Excellent
b) Very Good
c) Good
d) Average
e) Poor
Q.10 General level of Satisfaction Derived from the Restaurant & its Services:
a) Excellent
b) Very Good
c) Good
d) Average
e) Poor
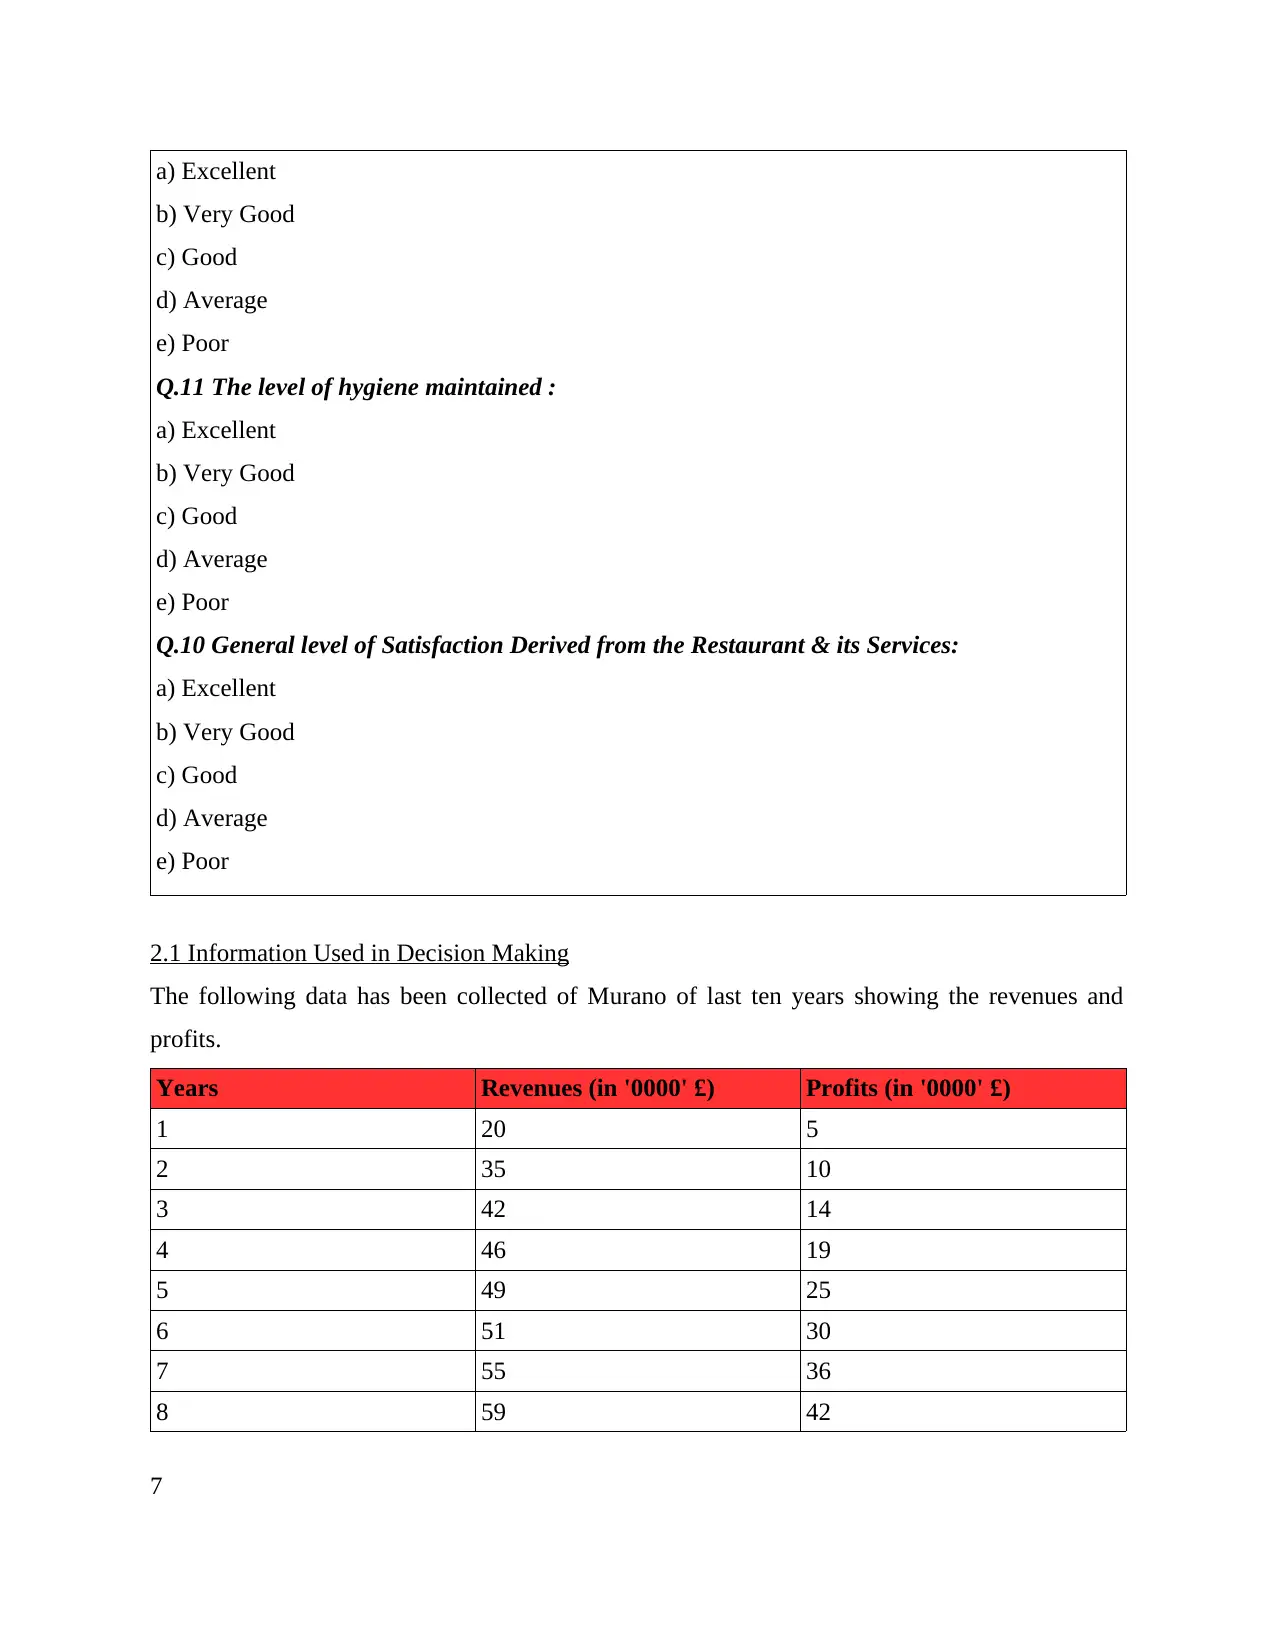
2.1 Information Used in Decision Making
The following data has been collected of Murano of last ten years showing the revenues and
profits.
Years Revenues (in '0000' £) Profits (in '0000' £)
1 20 5
2 35 10
3 42 14
4 46 19
5 49 25
6 51 30
7 55 36
8 59 42
7
b) Very Good
c) Good
d) Average
e) Poor
Q.11 The level of hygiene maintained :
a) Excellent
b) Very Good
c) Good
d) Average
e) Poor
Q.10 General level of Satisfaction Derived from the Restaurant & its Services:
a) Excellent
b) Very Good
c) Good
d) Average
e) Poor
2.1 Information Used in Decision Making
The following data has been collected of Murano of last ten years showing the revenues and
profits.
Years Revenues (in '0000' £) Profits (in '0000' £)
1 20 5
2 35 10
3 42 14
4 46 19
5 49 25
6 51 30
7 55 36
8 59 42
7
Paraphrase This Document
Need a fresh take? Get an instant paraphrase of this document with our AI Paraphraser
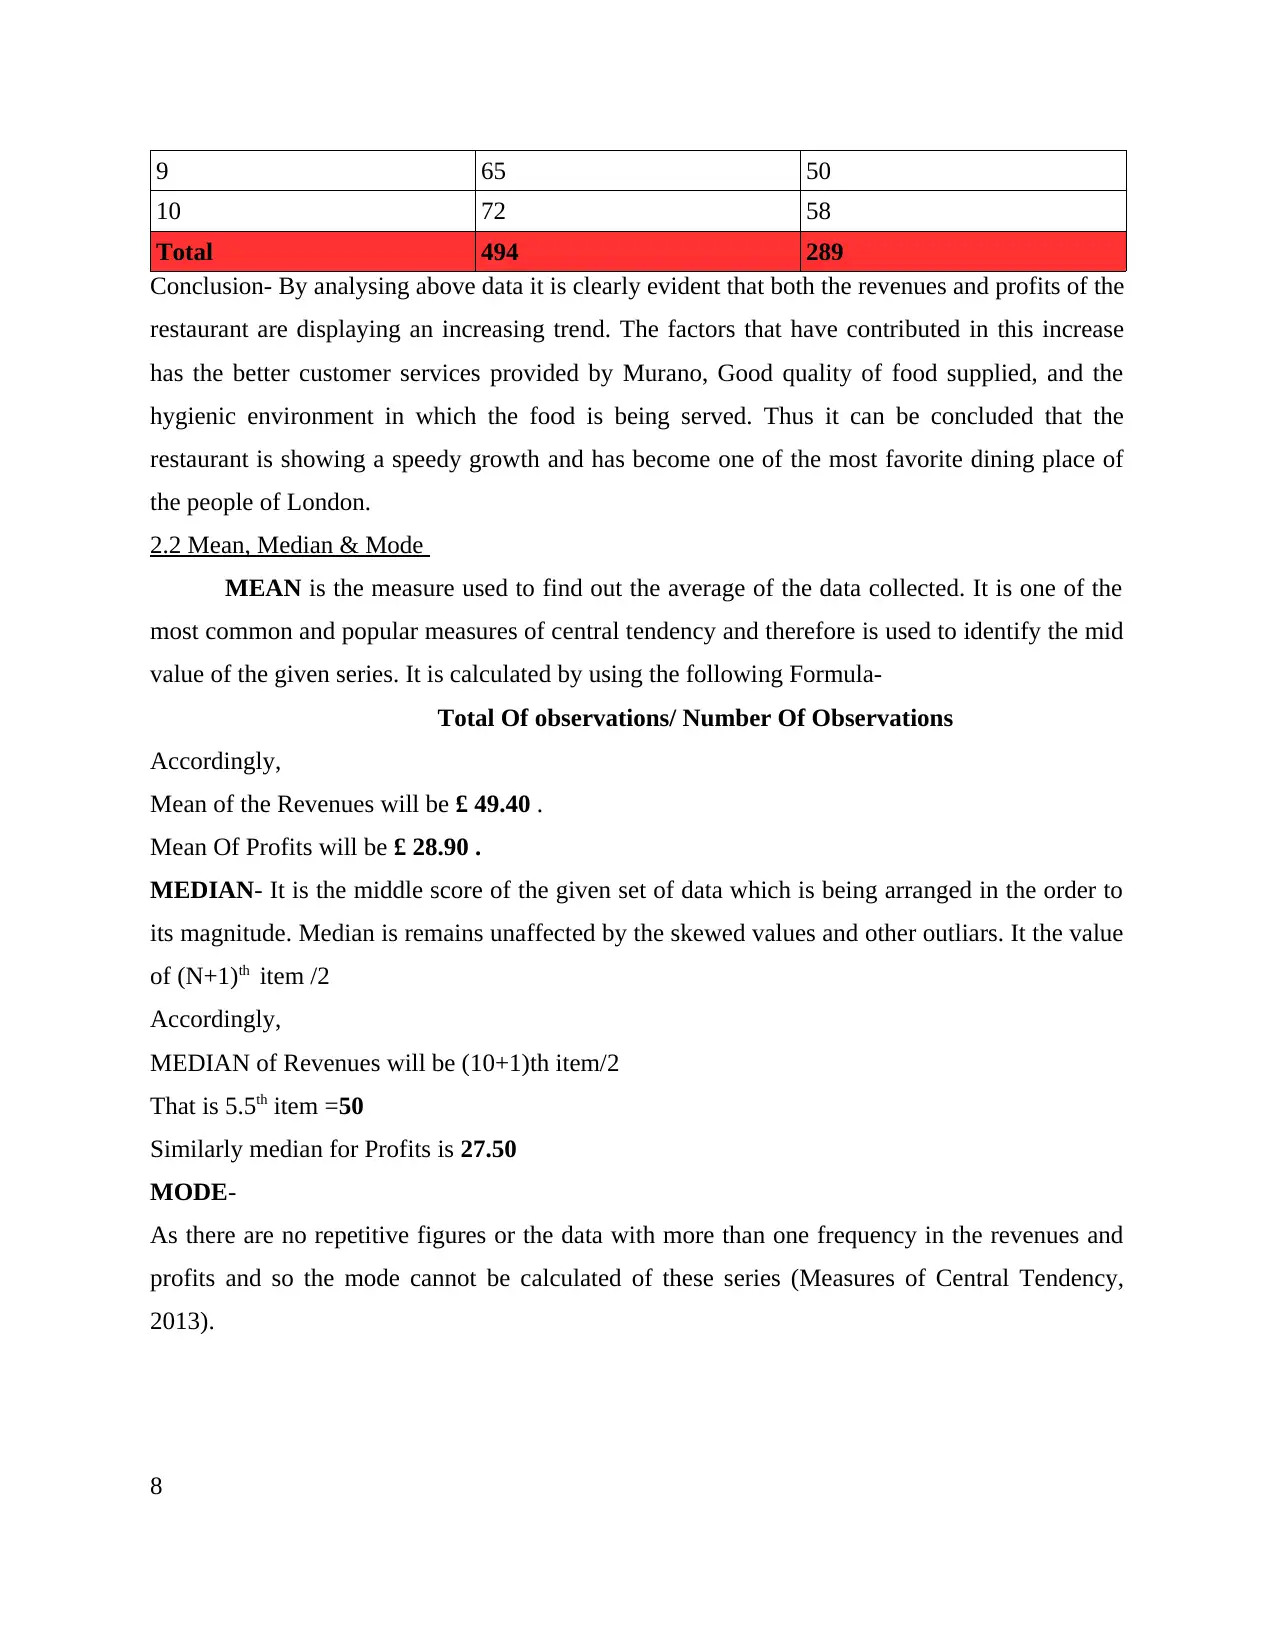
9 65 50
10 72 58
Total 494 289
Conclusion- By analysing above data it is clearly evident that both the revenues and profits of the
restaurant are displaying an increasing trend. The factors that have contributed in this increase
has the better customer services provided by Murano, Good quality of food supplied, and the
hygienic environment in which the food is being served. Thus it can be concluded that the
restaurant is showing a speedy growth and has become one of the most favorite dining place of
the people of London.
2.2 Mean, Median & Mode
MEAN is the measure used to find out the average of the data collected. It is one of the
most common and popular measures of central tendency and therefore is used to identify the mid
value of the given series. It is calculated by using the following Formula-
Total Of observations/ Number Of Observations
Accordingly,
Mean of the Revenues will be £ 49.40 .
Mean Of Profits will be £ 28.90 .
MEDIAN- It is the middle score of the given set of data which is being arranged in the order to
its magnitude. Median is remains unaffected by the skewed values and other outliars. It the value
of (N+1)th item /2
Accordingly,
MEDIAN of Revenues will be (10+1)th item/2
That is 5.5th item =50
Similarly median for Profits is 27.50
MODE-
As there are no repetitive figures or the data with more than one frequency in the revenues and
profits and so the mode cannot be calculated of these series (Measures of Central Tendency,
2013).
8
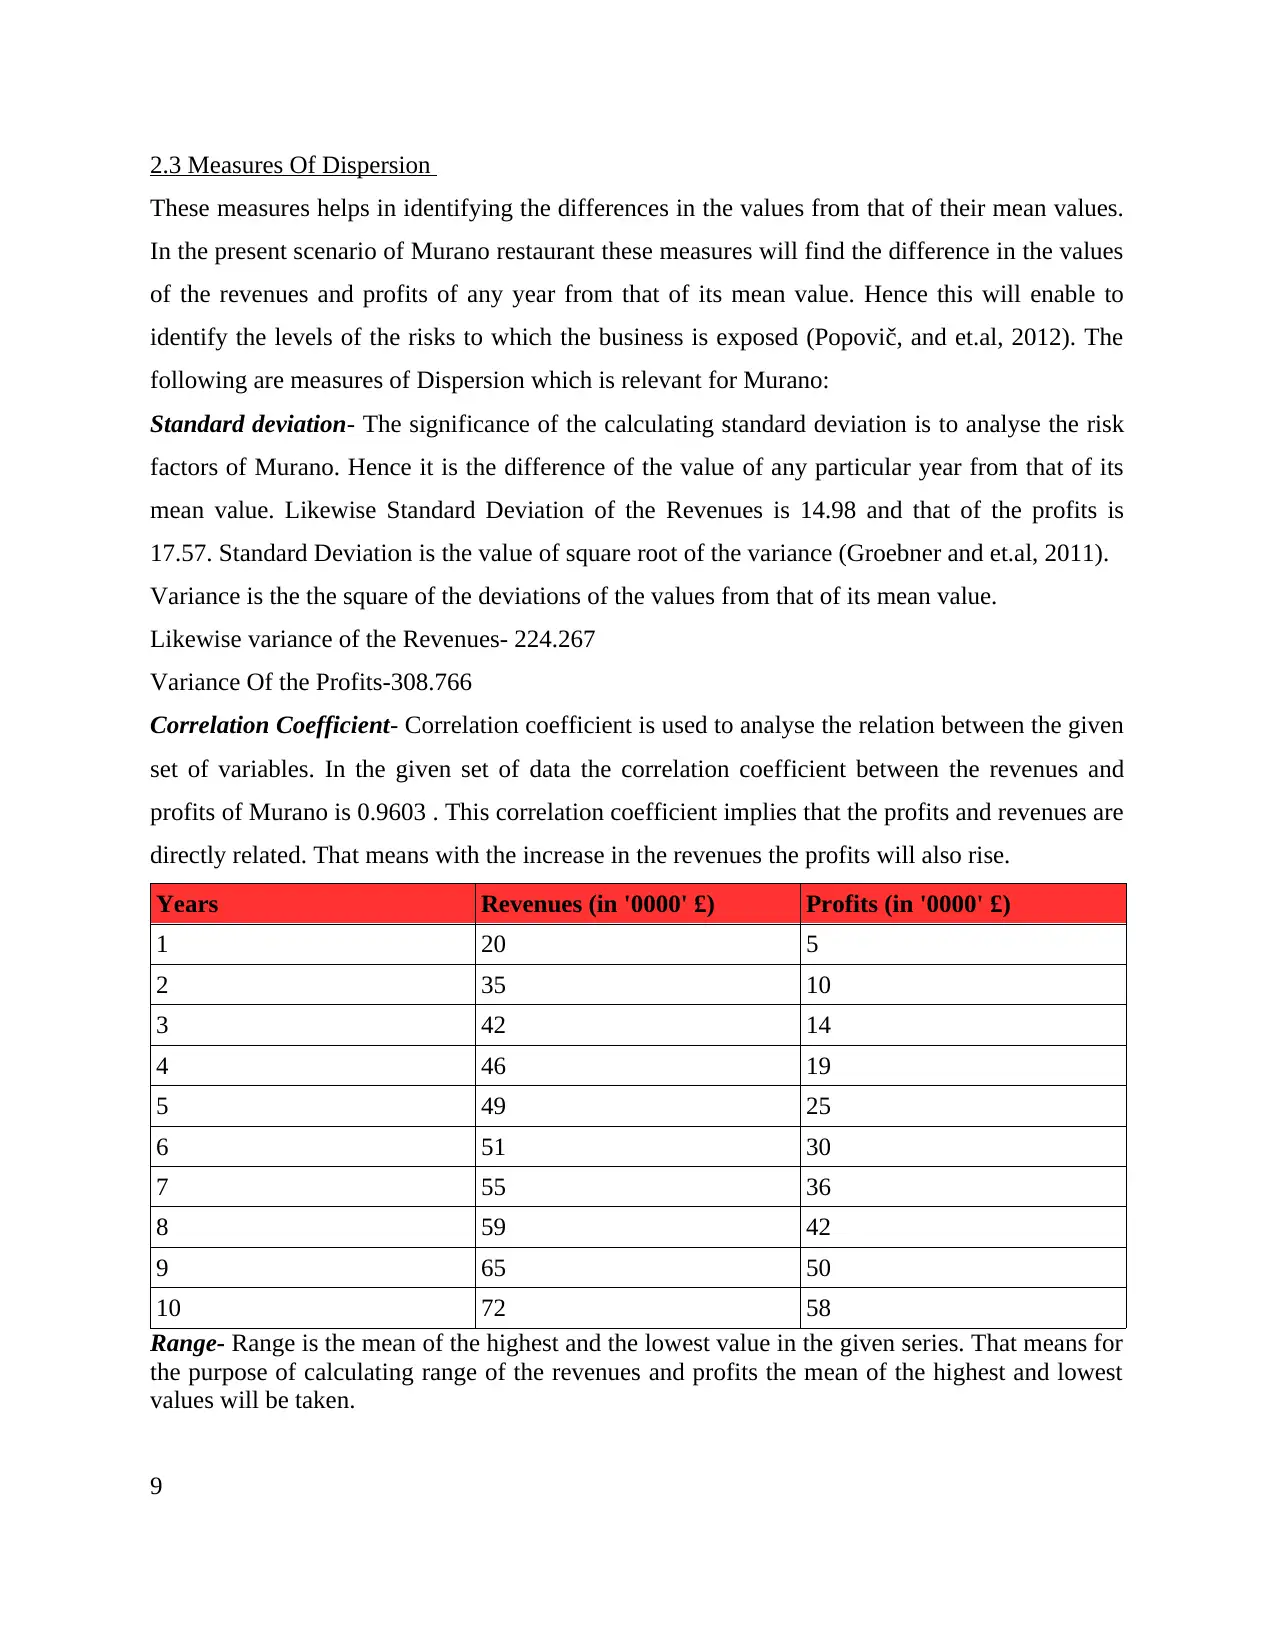
2.3 Measures Of Dispersion
These measures helps in identifying the differences in the values from that of their mean values.
In the present scenario of Murano restaurant these measures will find the difference in the values
of the revenues and profits of any year from that of its mean value. Hence this will enable to
identify the levels of the risks to which the business is exposed (Popovič, and et.al, 2012). The
following are measures of Dispersion which is relevant for Murano:
Standard deviation- The significance of the calculating standard deviation is to analyse the risk
factors of Murano. Hence it is the difference of the value of any particular year from that of its
mean value. Likewise Standard Deviation of the Revenues is 14.98 and that of the profits is
17.57. Standard Deviation is the value of square root of the variance (Groebner and et.al, 2011).
Variance is the the square of the deviations of the values from that of its mean value.
Likewise variance of the Revenues- 224.267
Variance Of the Profits-308.766
Correlation Coefficient- Correlation coefficient is used to analyse the relation between the given
set of variables. In the given set of data the correlation coefficient between the revenues and
profits of Murano is 0.9603 . This correlation coefficient implies that the profits and revenues are
directly related. That means with the increase in the revenues the profits will also rise.
Years Revenues (in '0000' £) Profits (in '0000' £)
1 20 5
2 35 10
3 42 14
4 46 19
5 49 25
6 51 30
7 55 36
8 59 42
9 65 50
10 72 58
Range- Range is the mean of the highest and the lowest value in the given series. That means for
the purpose of calculating range of the revenues and profits the mean of the highest and lowest
values will be taken.
9
⊘ This is a preview!⊘
Do you want full access?
Subscribe today to unlock all pages.
Trusted by 1+ million students worldwide
Accordingly, range of the revenues is 52 while that of profits is 53.
2.4 Quartiles & Percentiles
Quartile/ Percentiles Revenues Profits
1st Quartile / 25th Percentile 43 15.25
2nd Quartile / 50th Percentile 50 27.5
3rd Quartile / 75th Percentile 58 40.5
Quartiles represents the 25 % , 50% and 75 % of the quarterly values of revenues and profits
earned by Murano restaurant. Hence calculation of the the quartiles for the year has been
represented in the tabular format.
TASK-2
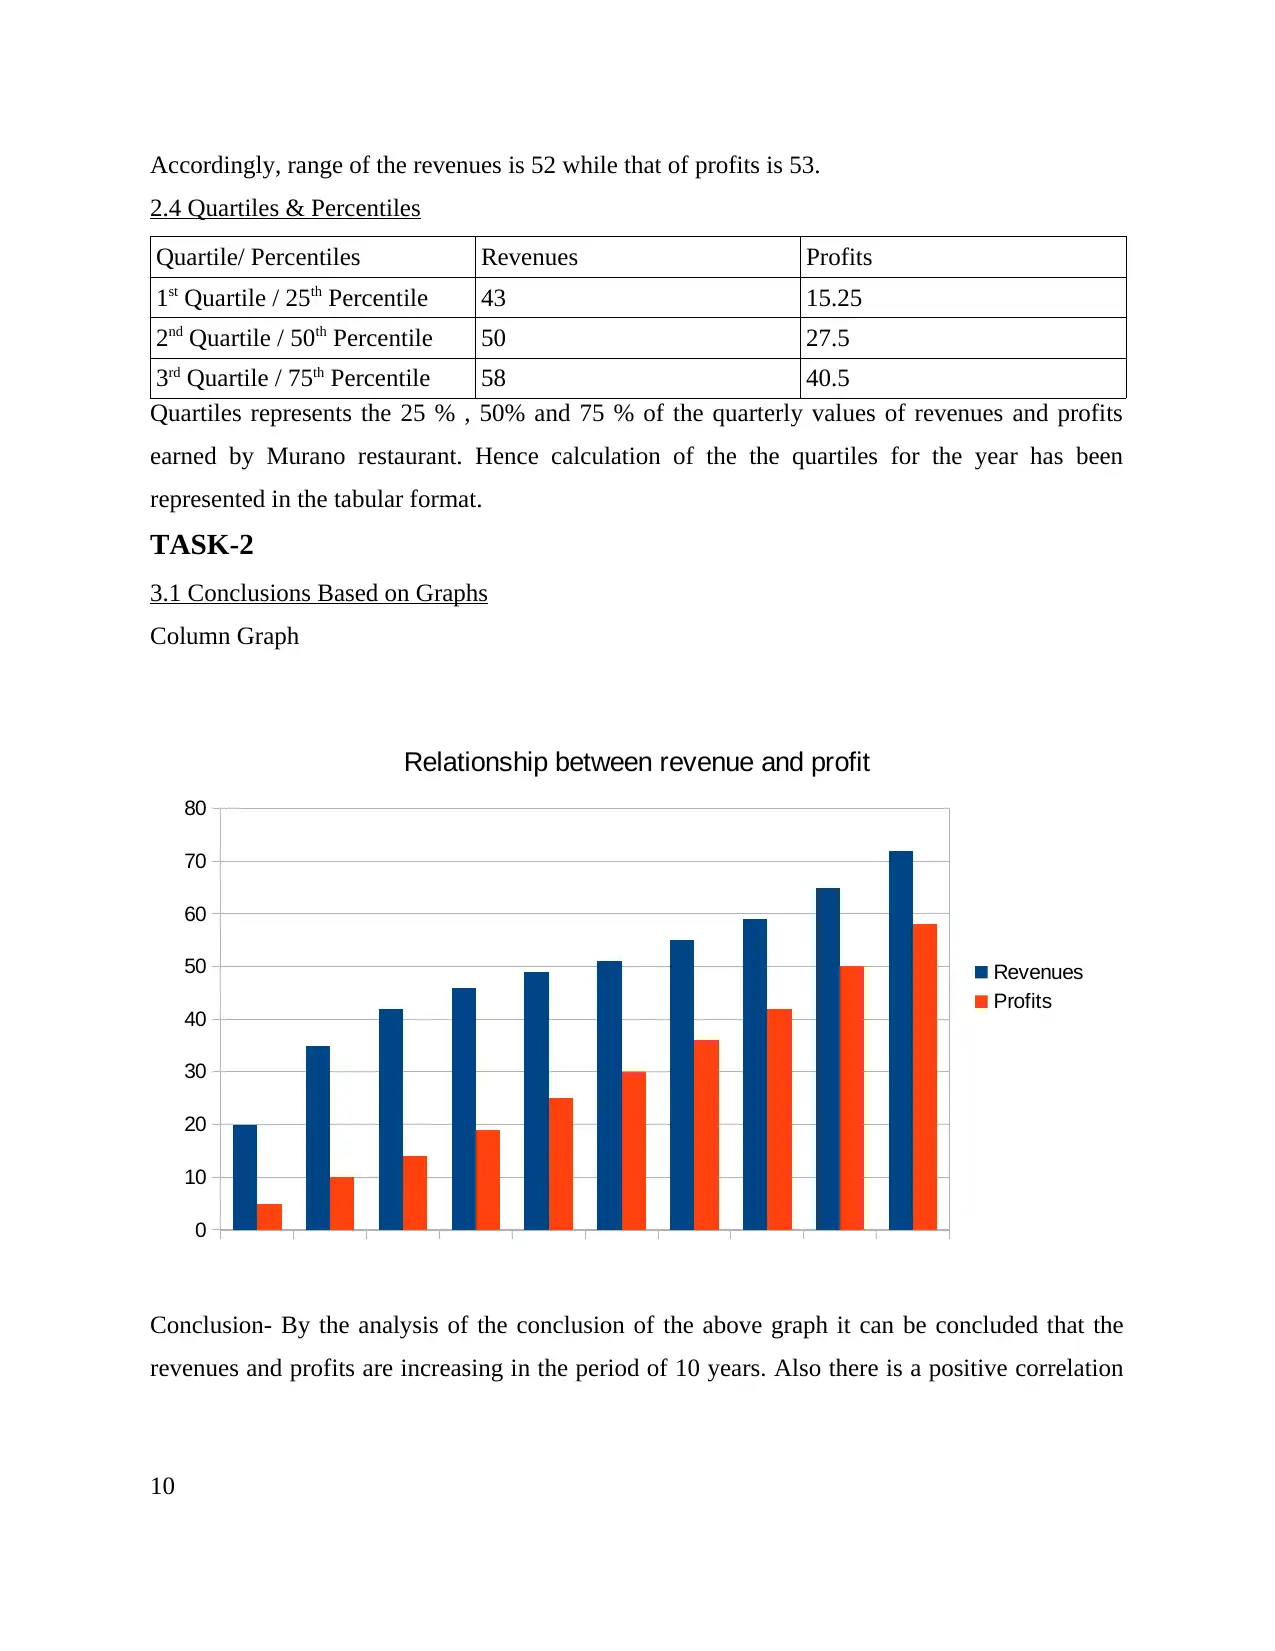
3.1 Conclusions Based on Graphs
Column Graph
Conclusion- By the analysis of the conclusion of the above graph it can be concluded that the
revenues and profits are increasing in the period of 10 years. Also there is a positive correlation
10
0
10
20
30
40
50
60
70
80
Relationship between revenue and profit
Revenues
Profits
2.4 Quartiles & Percentiles
Quartile/ Percentiles Revenues Profits
1st Quartile / 25th Percentile 43 15.25
2nd Quartile / 50th Percentile 50 27.5
3rd Quartile / 75th Percentile 58 40.5
Quartiles represents the 25 % , 50% and 75 % of the quarterly values of revenues and profits
earned by Murano restaurant. Hence calculation of the the quartiles for the year has been
represented in the tabular format.
TASK-2
3.1 Conclusions Based on Graphs
Column Graph
Conclusion- By the analysis of the conclusion of the above graph it can be concluded that the
revenues and profits are increasing in the period of 10 years. Also there is a positive correlation
10
0
10
20
30
40
50
60
70
80
Relationship between revenue and profit
Revenues
Profits
Paraphrase This Document
Need a fresh take? Get an instant paraphrase of this document with our AI Paraphraser
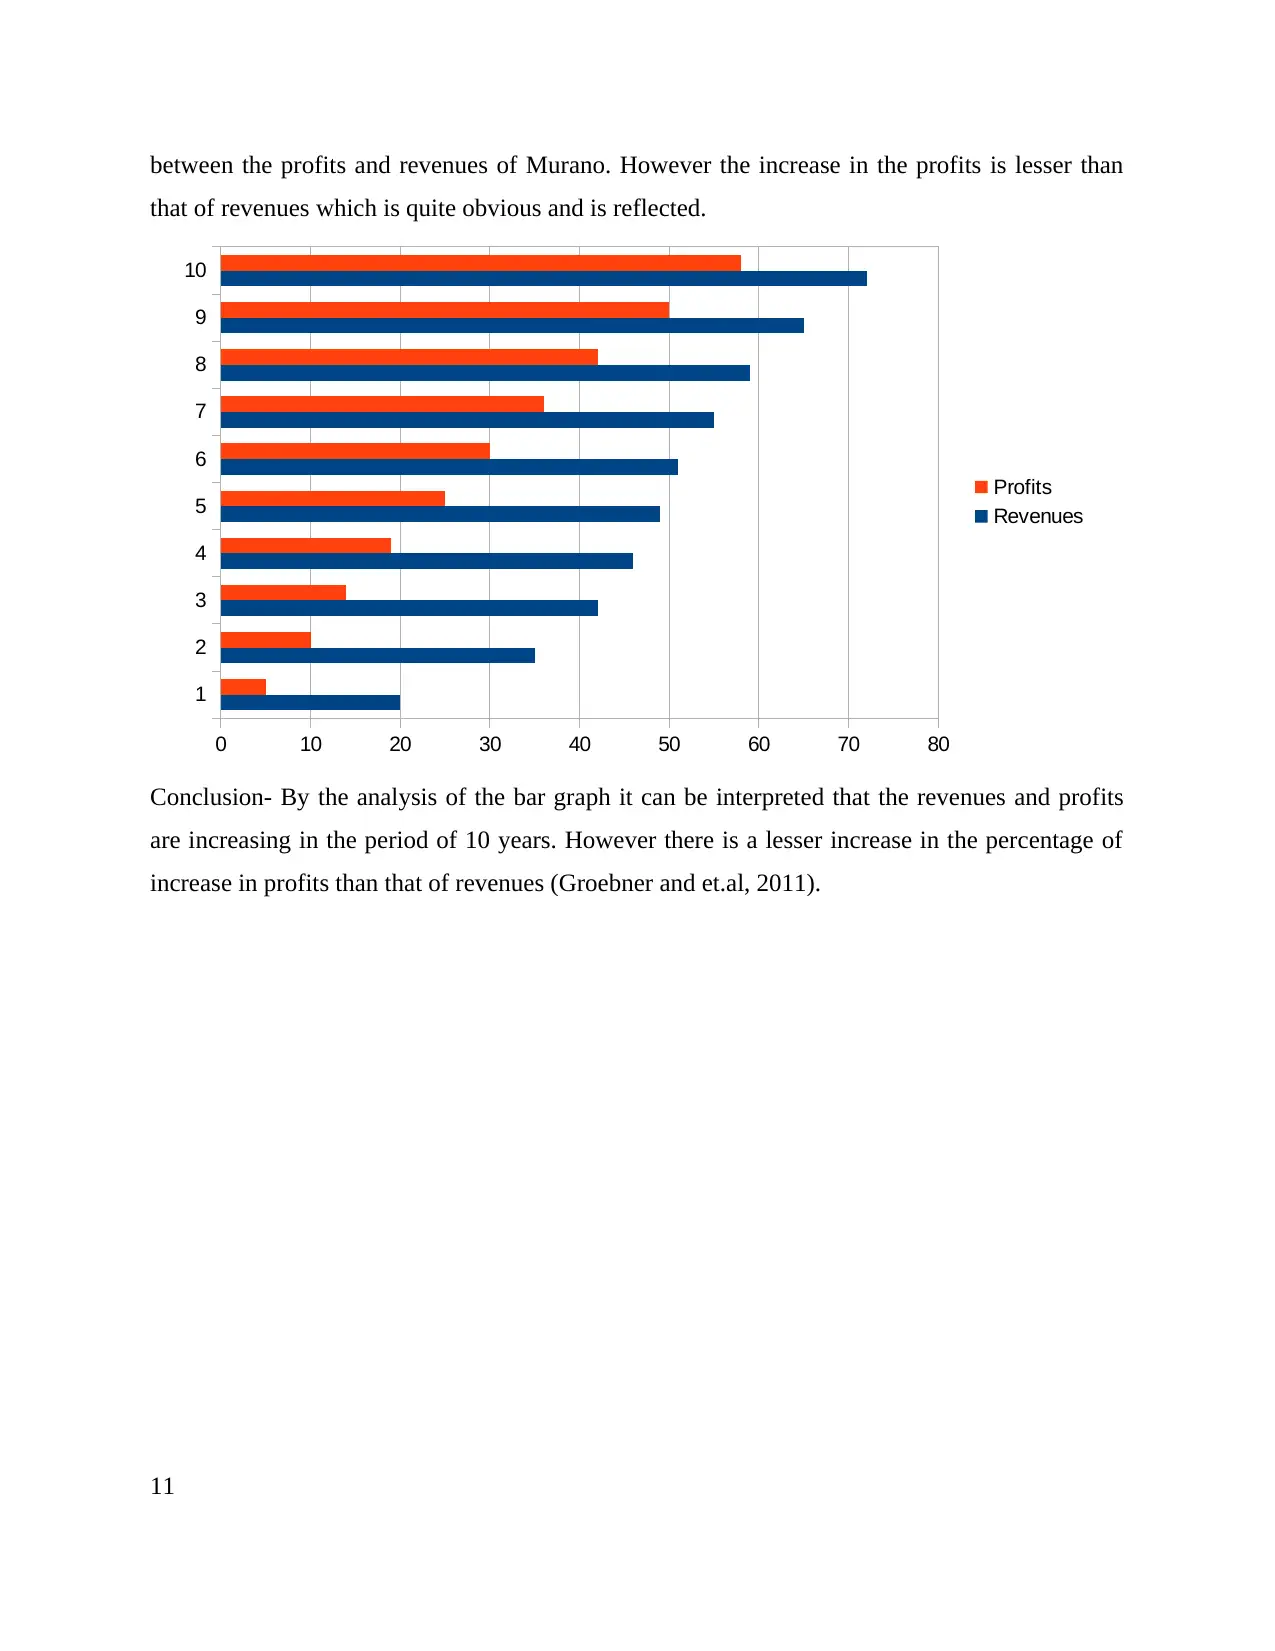
between the profits and revenues of Murano. However the increase in the profits is lesser than
that of revenues which is quite obvious and is reflected.
Conclusion- By the analysis of the bar graph it can be interpreted that the revenues and profits
are increasing in the period of 10 years. However there is a lesser increase in the percentage of
increase in profits than that of revenues (Groebner and et.al, 2011).
11
1
2
3
4
5
6
7
8
9
10
0 10 20 30 40 50 60 70 80
Profits
Revenues
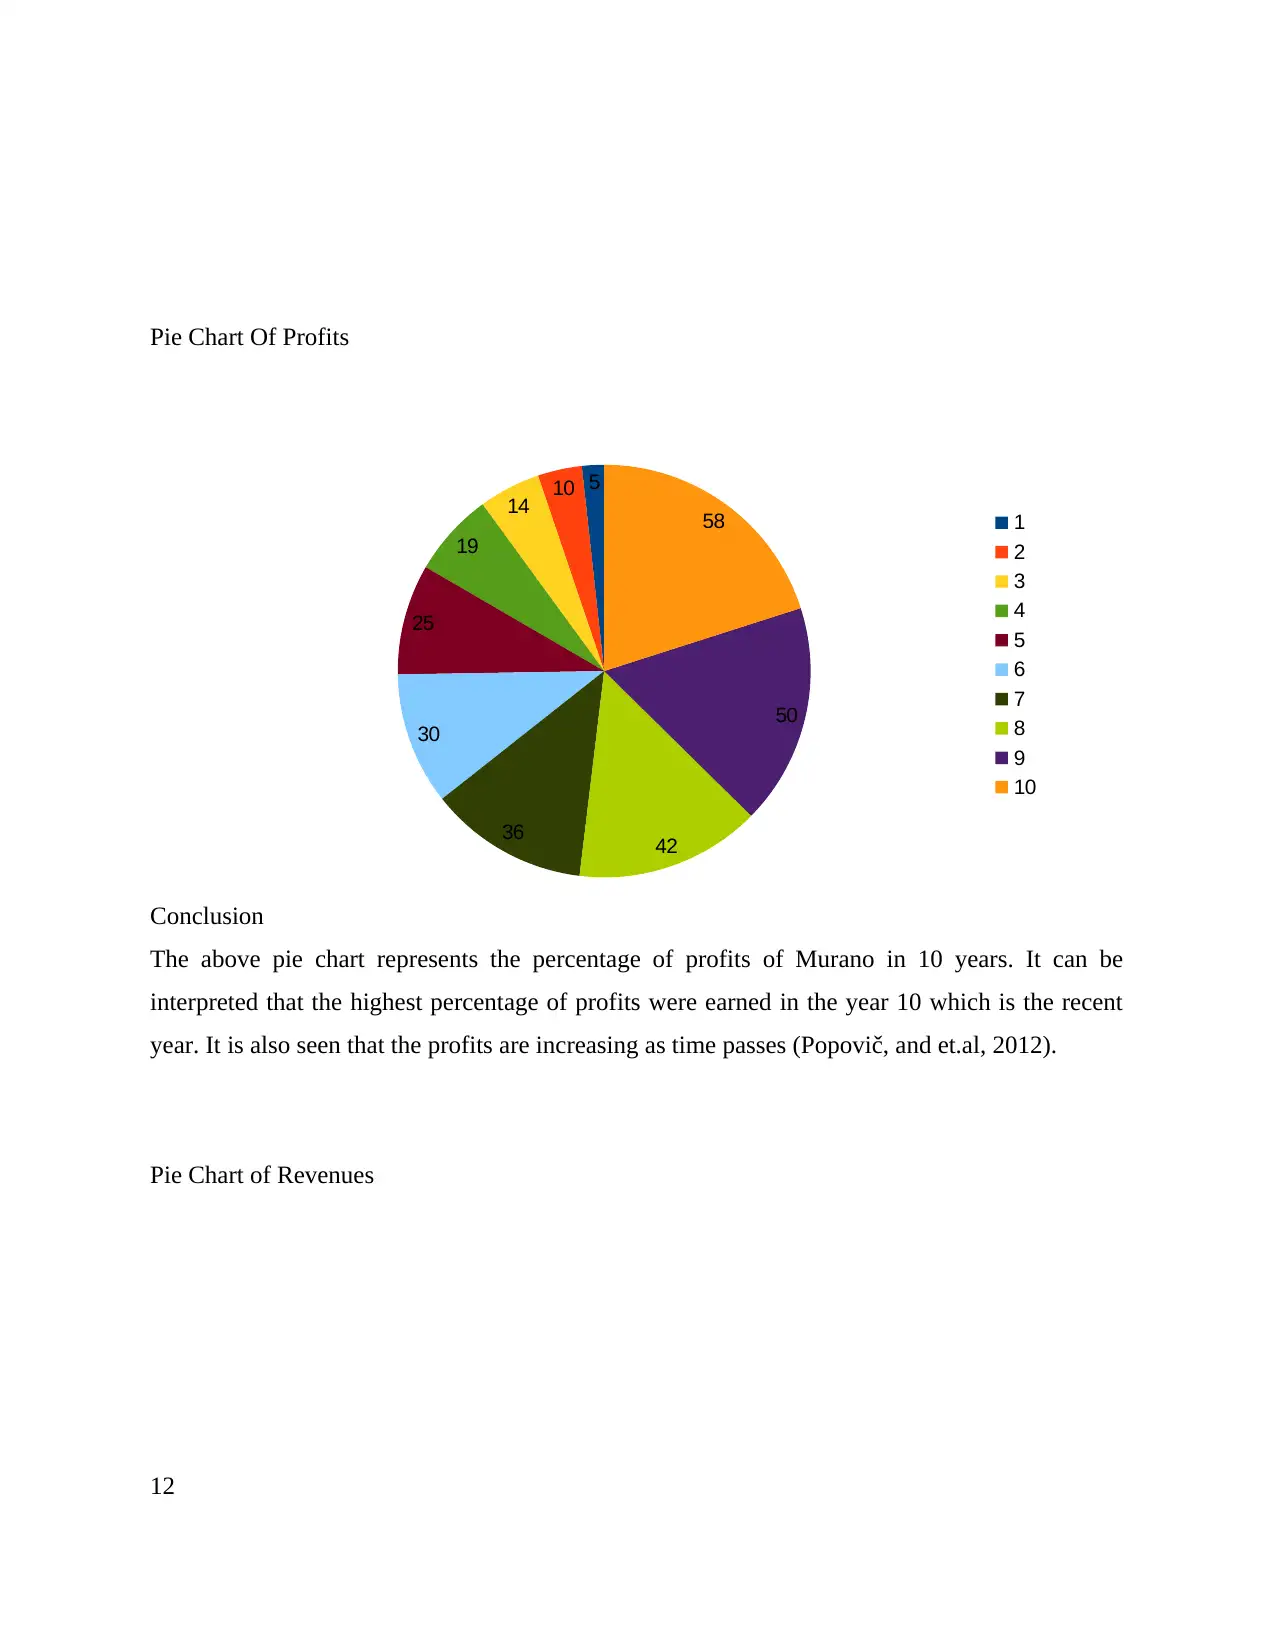
Pie Chart Of Profits
Conclusion
The above pie chart represents the percentage of profits of Murano in 10 years. It can be
interpreted that the highest percentage of profits were earned in the year 10 which is the recent
year. It is also seen that the profits are increasing as time passes (Popovič, and et.al, 2012).
Pie Chart of Revenues
12
510
14
19
25
30
36 42
50
58 1
2
3
4
5
6
7
8
9
10
⊘ This is a preview!⊘
Do you want full access?
Subscribe today to unlock all pages.
Trusted by 1+ million students worldwide
1 out of 19
Related Documents


Your All-in-One AI-Powered Toolkit for Academic Success.
+13062052269
info@desklib.com
Available 24*7 on WhatsApp / Email
![[object Object]](/_next/static/media/star-bottom.7253800d.svg)
Unlock your academic potential
Copyright © 2020–2026 A2Z Services. All Rights Reserved. Developed and managed by ZUCOL.