Statistical Analysis and Portfolio Questions for AM0S05

Verified

Added on  2022/08/24

|9
|703
|16
Homework Assignment
AI Summary
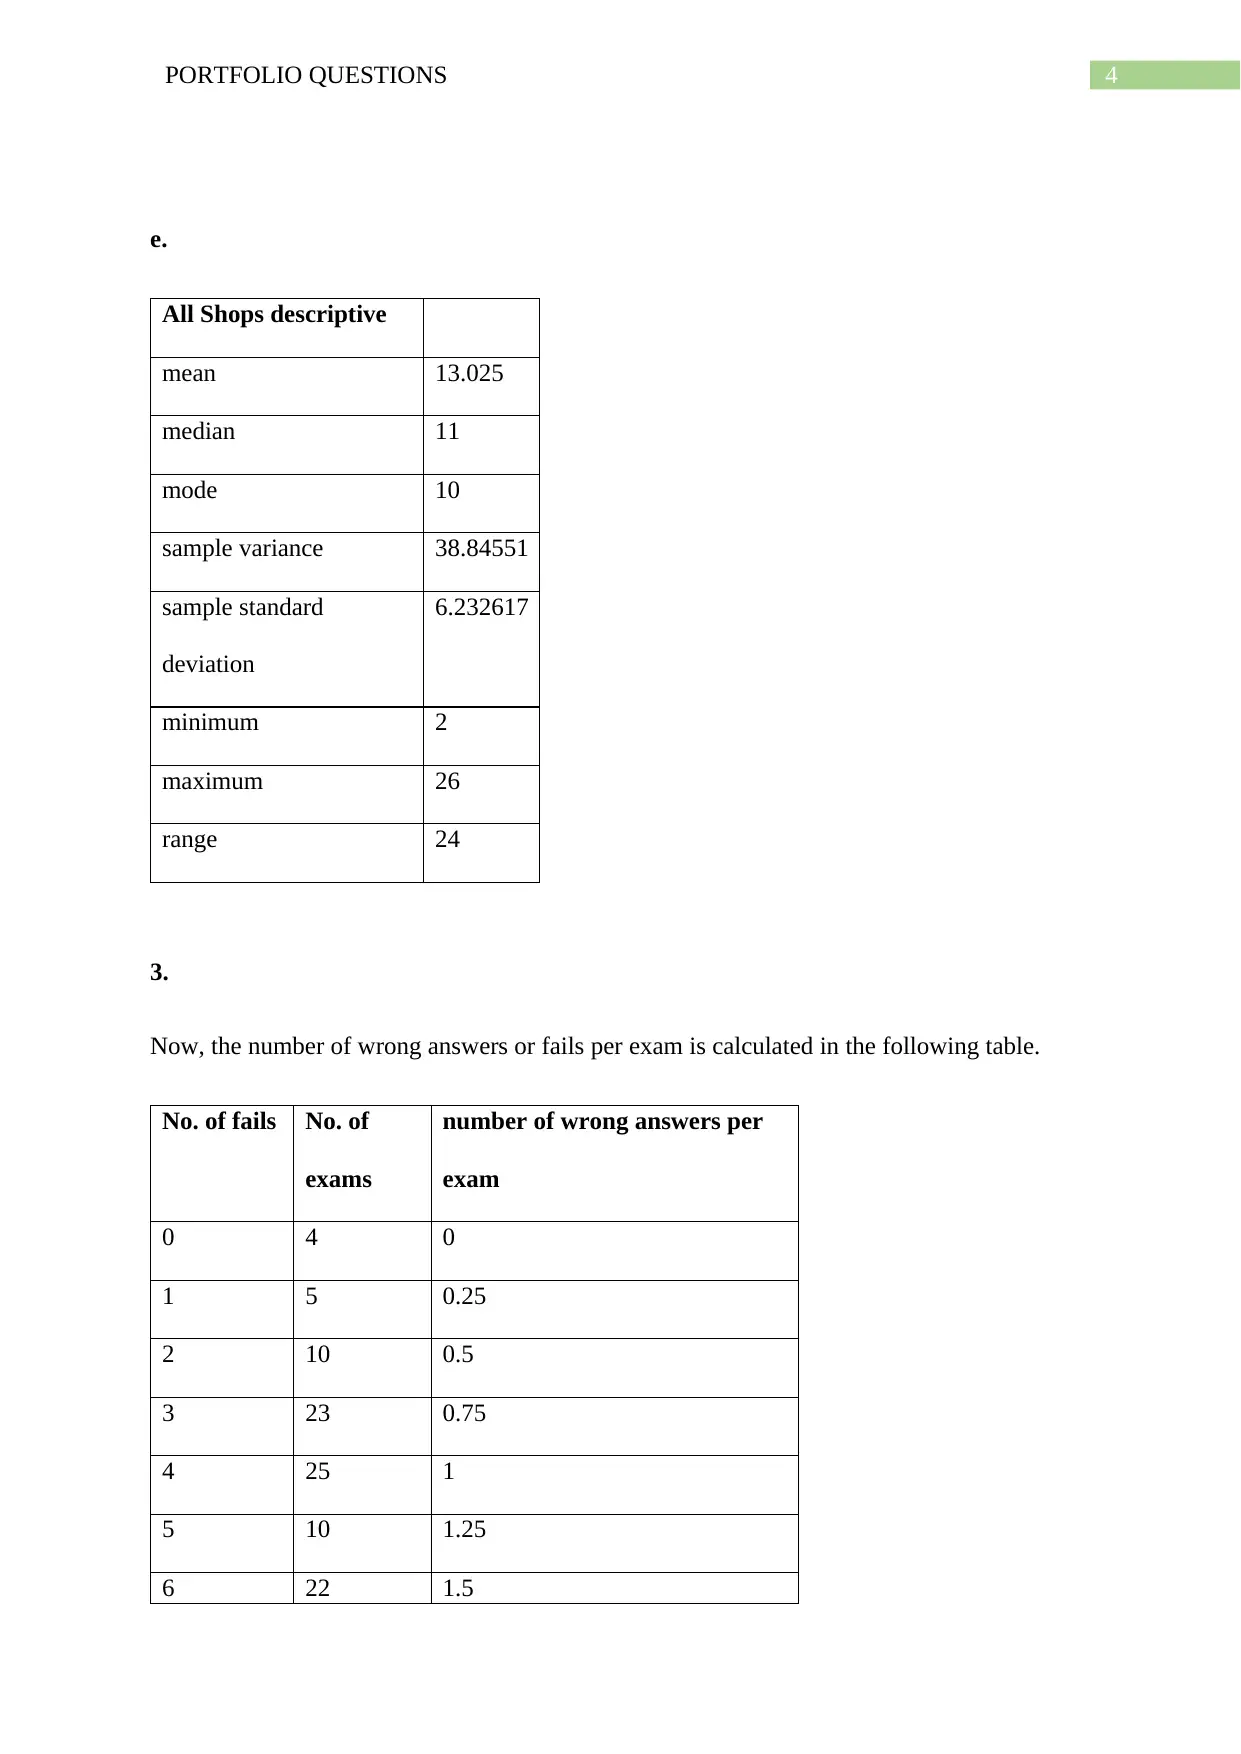
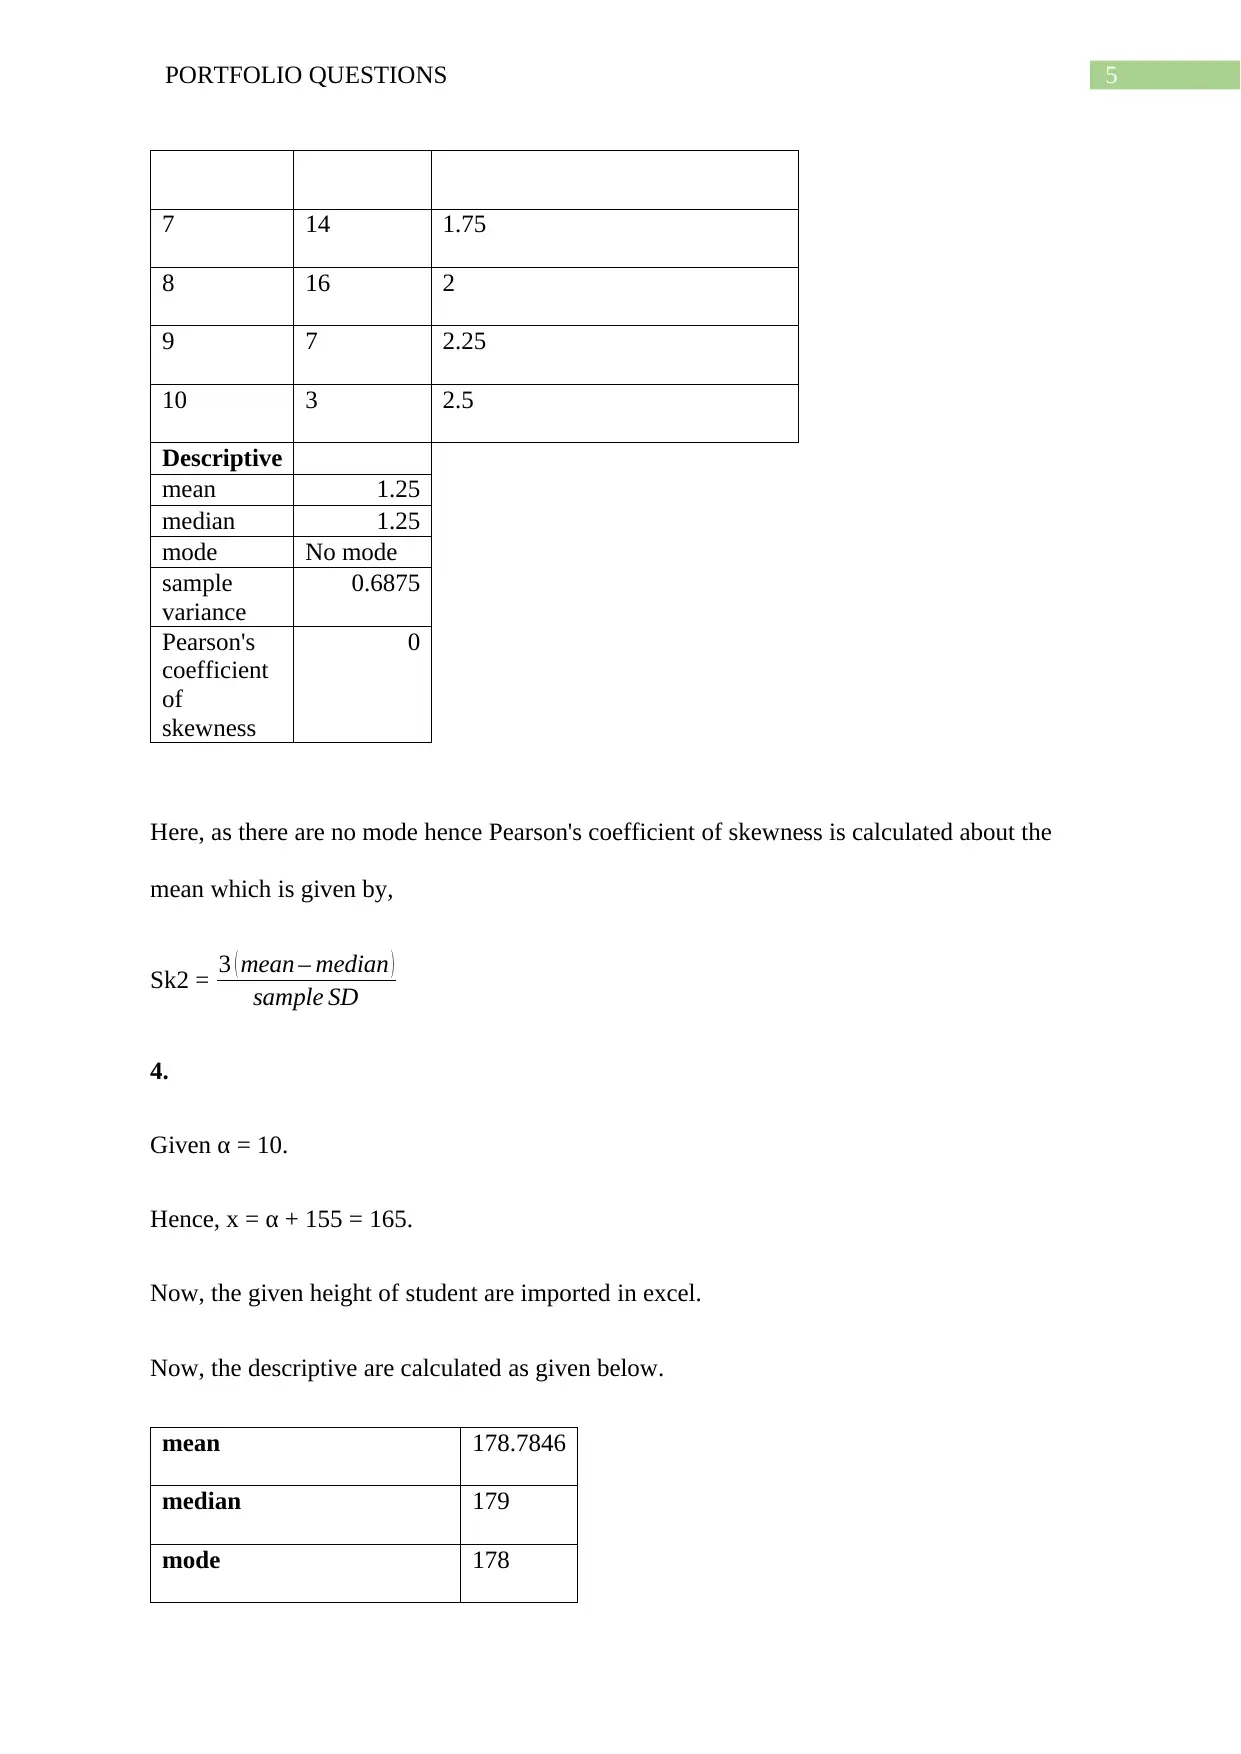
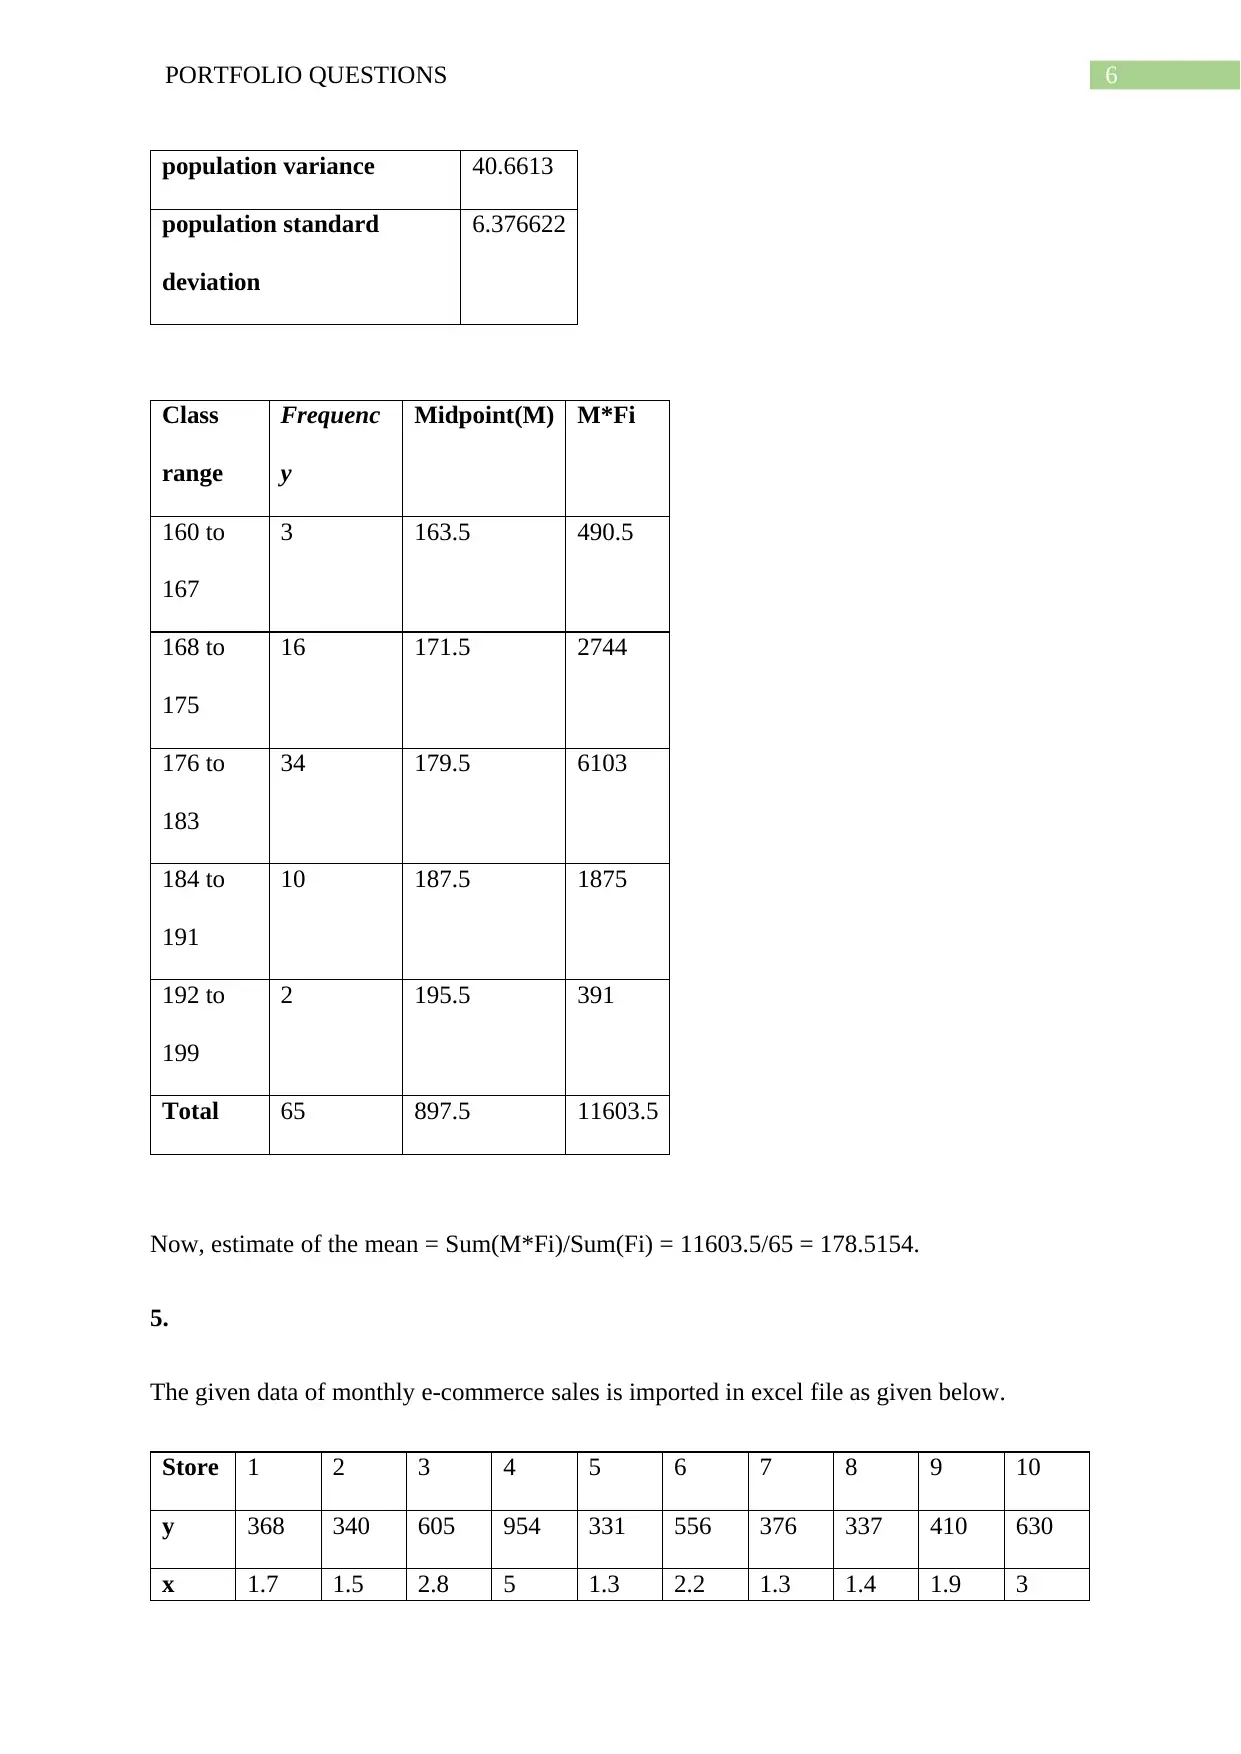
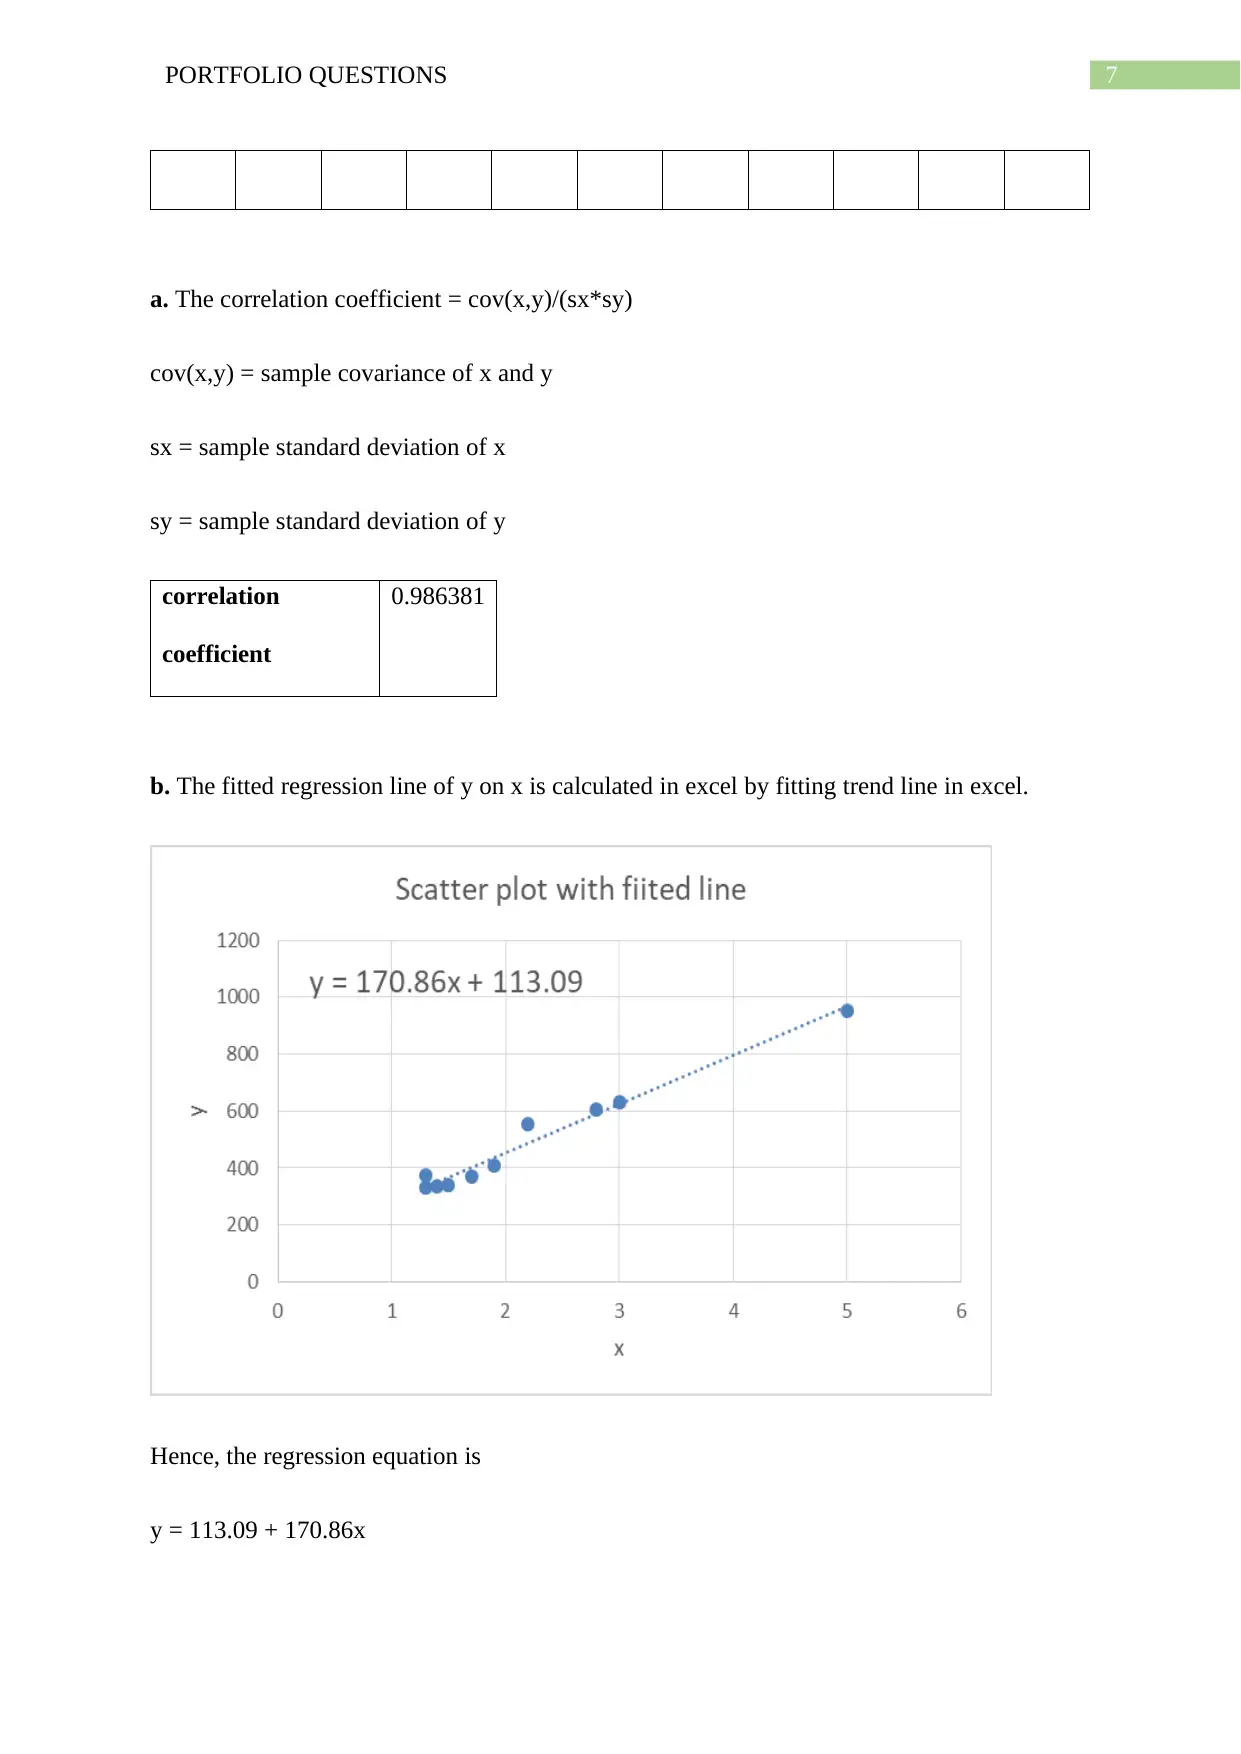
This document presents solutions to a statistics portfolio assignment, covering a range of statistical concepts. The assignment includes calculations for mean, median, and range using a given alpha value. It also involves analyzing sample data from multiple shops to determine measures of central tendency and dispersion. Further, the assignment addresses calculating the number of wrong answers on exams, including descriptive statistics and Pearson's coefficient of skewness. Another section focuses on calculating the mean from grouped data and determining the correlation coefficient and regression equation for e-commerce sales based on online advertising costs, and also predicting sales based on the regression equation. All calculations are performed using Excel, providing detailed steps and results. This assignment is a comprehensive analysis of statistical methods and their practical applications.
Document Page
Running head: PORTFOLIO QUESTIONS
PORTFOLIO QUESTIONS
Name of the Student
Name of the University
Author Note
tabler-icon-diamond-filled.svg

Secure Best Marks with AI Grader

Need help grading? Try our AI Grader for instant feedback on your assignments.
Document Page
1PORTFOLIO QUESTIONS
Exercises:
1.
Given, α = 10 for the assignment.
The three integers are a, b and c, where, a < b < c
Median is the middle most value in order and given median = 10.
Hence, b = 10.
Now, mean = α – 2 = (a + b + c)/3 = 10-2 = 8.
Range = c – a = 2*10 = 20 => c = 20+ a
Hence, (a + 10 + c)/3 = 8 => a+c+10 = 24
a+c = 14
a + 20 + a = 14
2a = -6
a = -3
Hence, c = 20 -3 = 17.
Thus the numbers are a = -3, b = 10 and c = 17.
2.
The sample data of four shops are imported to excel with α = 10.
Then the measures of central tendency and dispersion are calculated as given below.
Document Page
2PORTFOLIO QUESTIONS
a.
Shop 1 descriptive
mean 10.5
median 10.5
mode 10
sample variance 4.722222
sample standard deviation 2.173067
minimum 7
maximum 14
range 7
b.
Shop 2 descriptive
mean 11.1
median 10.5
mode 10
sample variance 42.32222
sample standard
deviation
6.505553
minimum 2
maximum 19
range 17
c.
Document Page
3PORTFOLIO QUESTIONS
Shop 3 descriptive
mean 19.2
median 21
mode 25
sample variance 53.06667
sample standard
deviation
7.284687
minimum 3
maximum 26
range 23
d.
Shop 4 descriptive
mean 11.3
median 10
mode 10
sample variance 11.34444
sample standard
deviation
3.368151
minimum 8
maximum 20
range 12
tabler-icon-diamond-filled.svg

Secure Best Marks with AI Grader

Need help grading? Try our AI Grader for instant feedback on your assignments.
Document Page
4PORTFOLIO QUESTIONS
e.
All Shops descriptive
mean 13.025
median 11
mode 10
sample variance 38.84551
sample standard
deviation
6.232617
minimum 2
maximum 26
range 24
3.
Now, the number of wrong answers or fails per exam is calculated in the following table.
No. of fails No. of
exams
number of wrong answers per
exam
0 4 0
1 5 0.25
2 10 0.5
3 23 0.75
4 25 1
5 10 1.25
6 22 1.5
Document Page
5PORTFOLIO QUESTIONS
7 14 1.75
8 16 2
9 7 2.25
10 3 2.5
Descriptive
mean 1.25
median 1.25
mode No mode
sample
variance
0.6875
Pearson's
coefficient
of
skewness
0
Here, as there are no mode hence Pearson's coefficient of skewness is calculated about the
mean which is given by,
Sk2 = 3 ( mean median )
sample SD
4.
Given α = 10.
Hence, x = α + 155 = 165.
Now, the given height of student are imported in excel.
Now, the descriptive are calculated as given below.
mean 178.7846
median 179
mode 178
Document Page
6PORTFOLIO QUESTIONS
population variance 40.6613
population standard
deviation
6.376622
Class
range
Frequenc
y
Midpoint(M) M*Fi
160 to
167
3 163.5 490.5
168 to
175
16 171.5 2744
176 to
183
34 179.5 6103
184 to
191
10 187.5 1875
192 to
199
2 195.5 391
Total 65 897.5 11603.5
Now, estimate of the mean = Sum(M*Fi)/Sum(Fi) = 11603.5/65 = 178.5154.
5.
The given data of monthly e-commerce sales is imported in excel file as given below.
Store 1 2 3 4 5 6 7 8 9 10
y 368 340 605 954 331 556 376 337 410 630
x 1.7 1.5 2.8 5 1.3 2.2 1.3 1.4 1.9 3
tabler-icon-diamond-filled.svg

Paraphrase This Document

Need a fresh take? Get an instant paraphrase of this document with our AI Paraphraser
Document Page
7PORTFOLIO QUESTIONS
a. The correlation coefficient = cov(x,y)/(sx*sy)
cov(x,y) = sample covariance of x and y
sx = sample standard deviation of x
sy = sample standard deviation of y
correlation
coefficient
0.986381
b. The fitted regression line of y on x is calculated in excel by fitting trend line in excel.
Hence, the regression equation is
y = 113.09 + 170.86x
Document Page
8PORTFOLIO QUESTIONS
c. Now, by using this equation the predicted e-commerce sale of a store with 3.7 online
advertising cost is
y¿x=3.7 ¿ = 113.09 + 170.86*3.7 = 745.272
chevron_up_icon
1 out of 9
circle_padding
hide_on_mobile
zoom_out_icon
logo.png

Your All-in-One AI-Powered Toolkit for Academic Success.

Available 24*7 on WhatsApp / Email

[object Object]