Statistical Analysis Homework: Problem Set #1 - University Name

Verified

Added on  2022/08/09

|9
|1385
|180
Homework Assignment
AI Summary
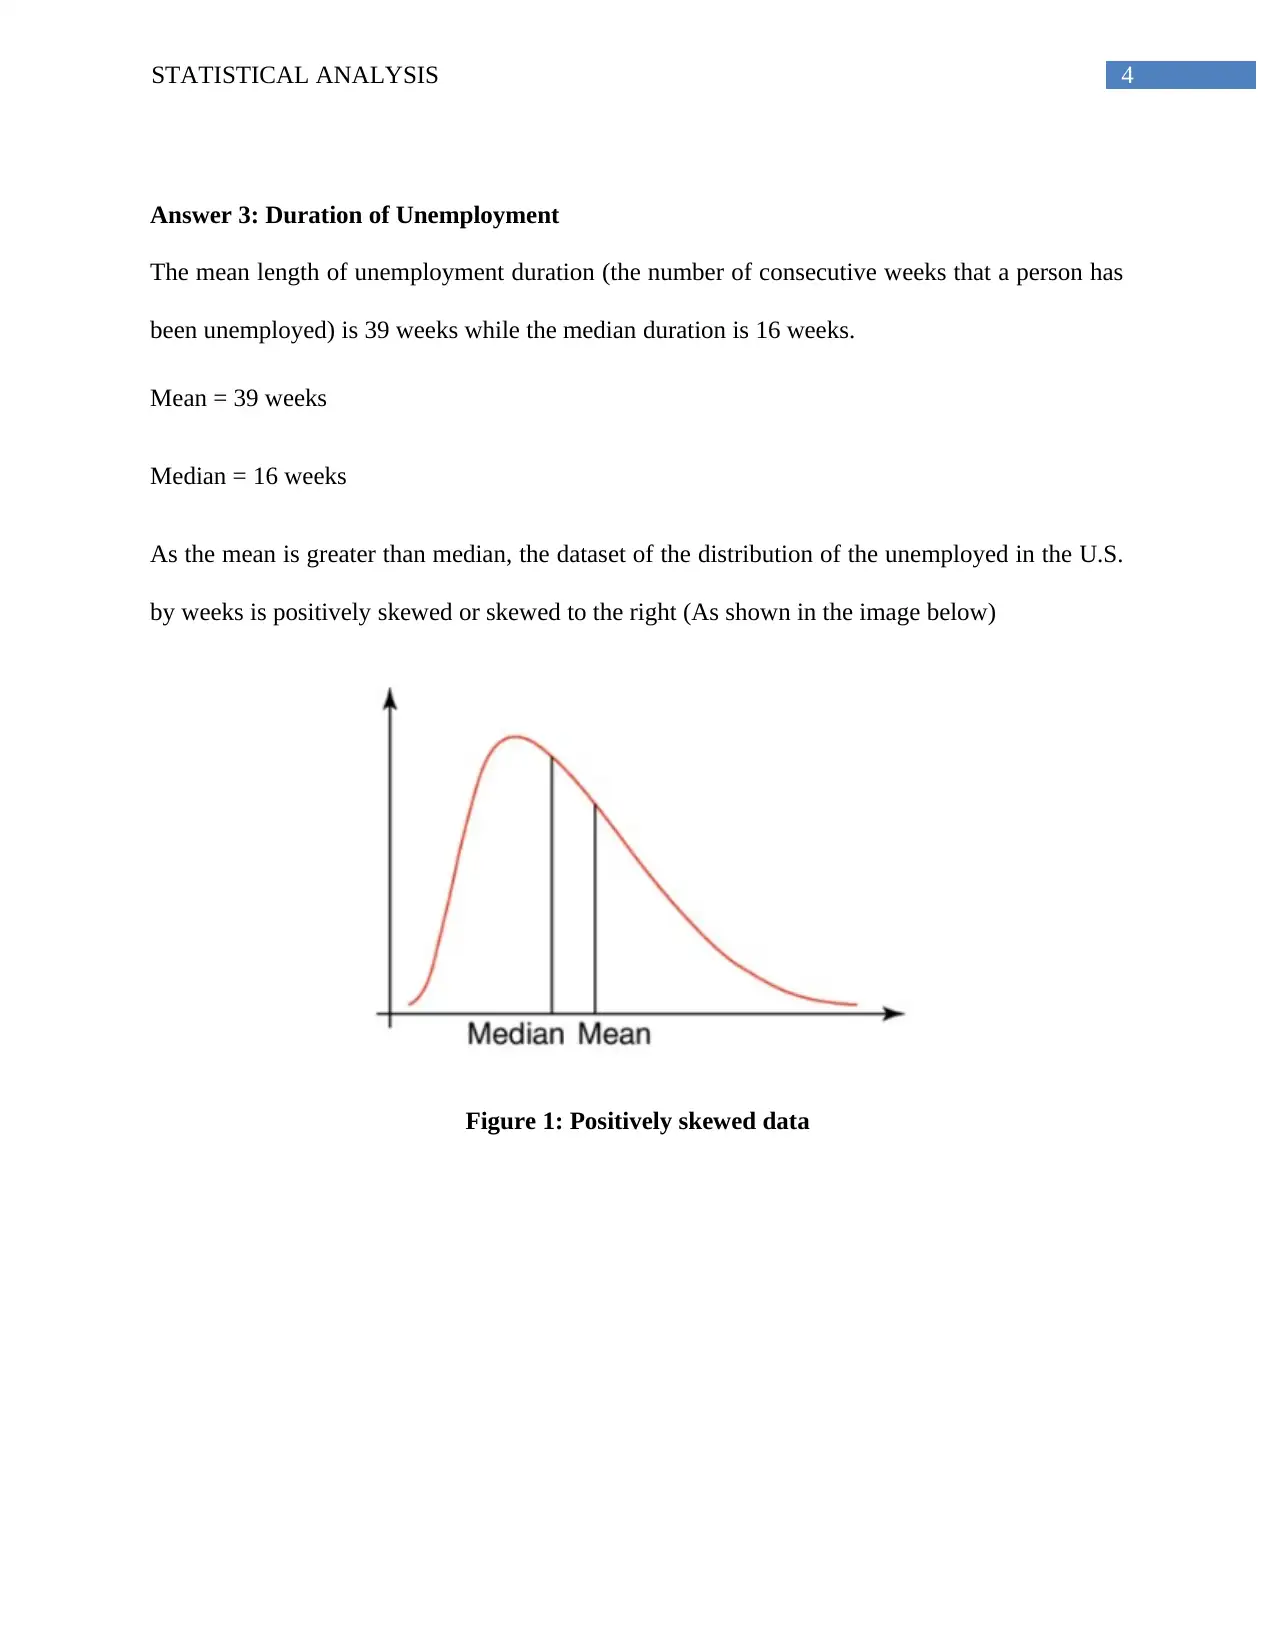
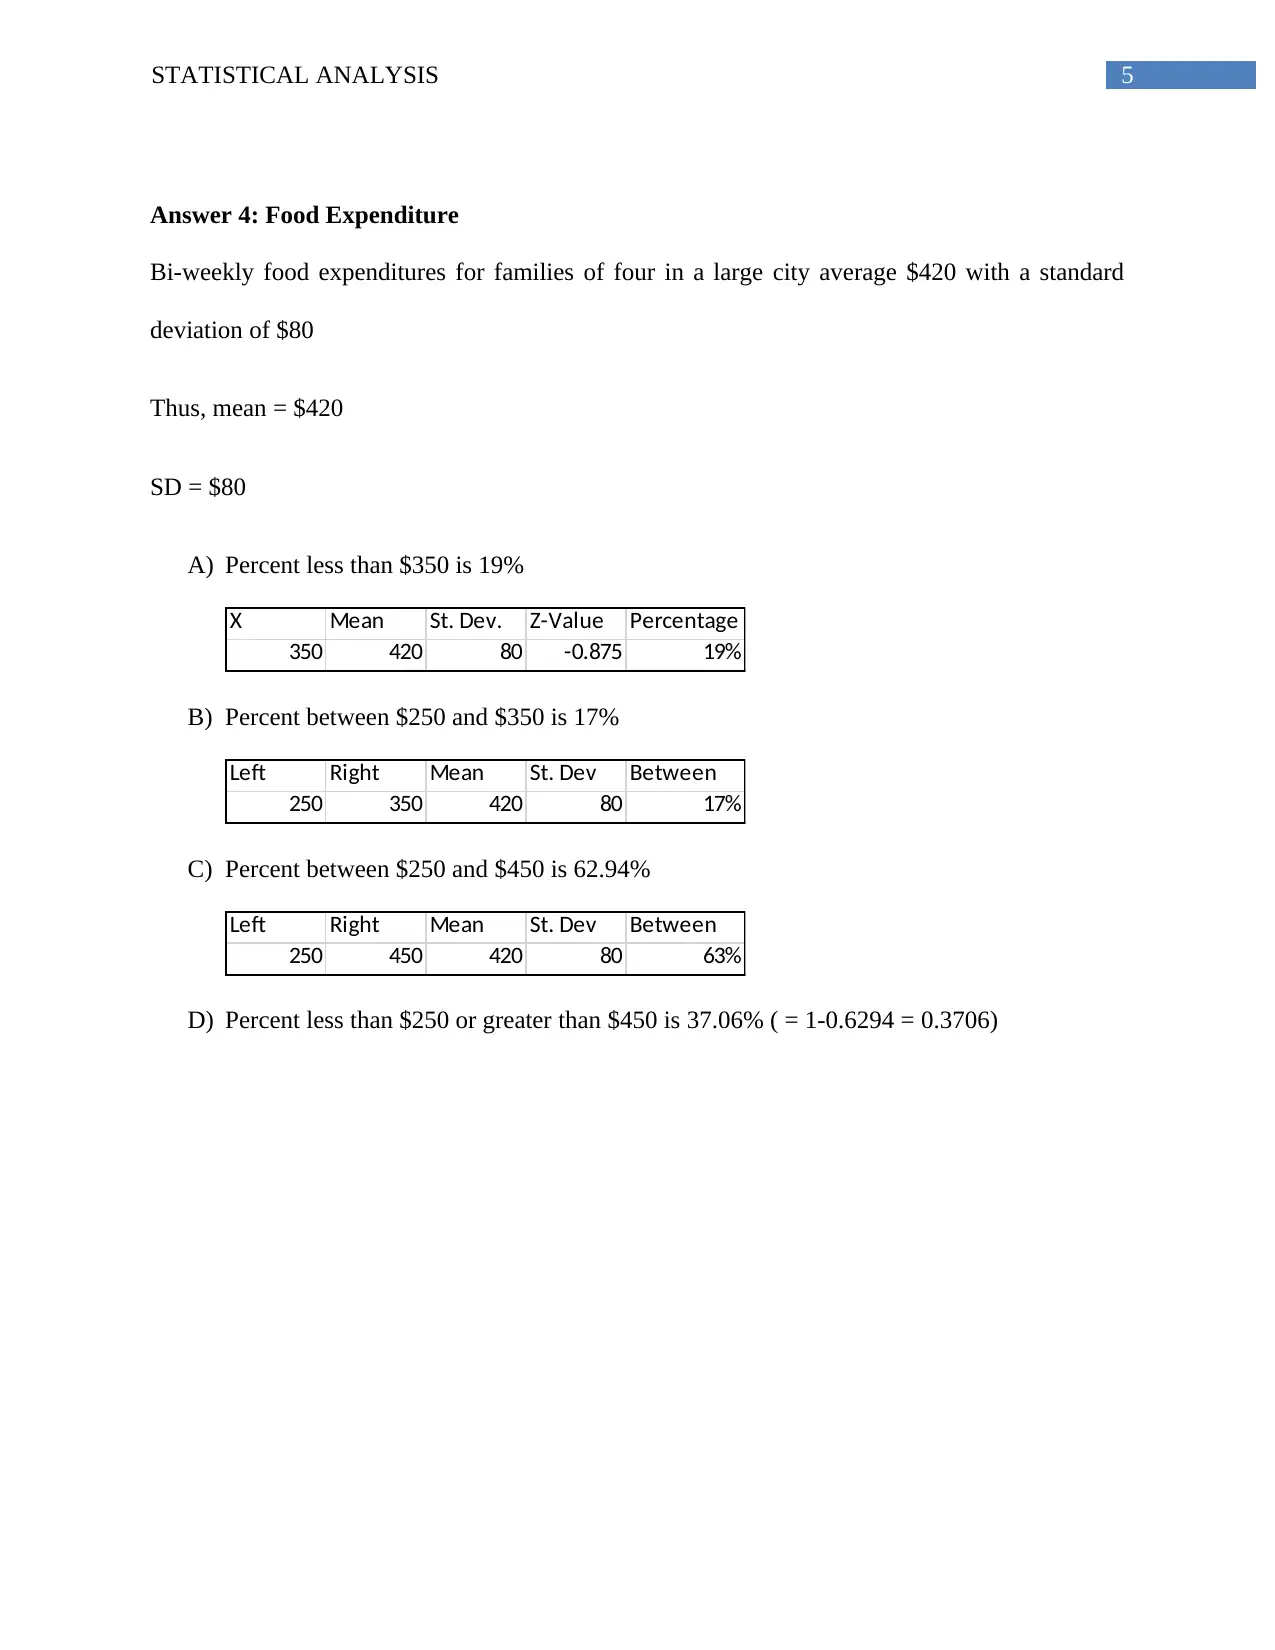
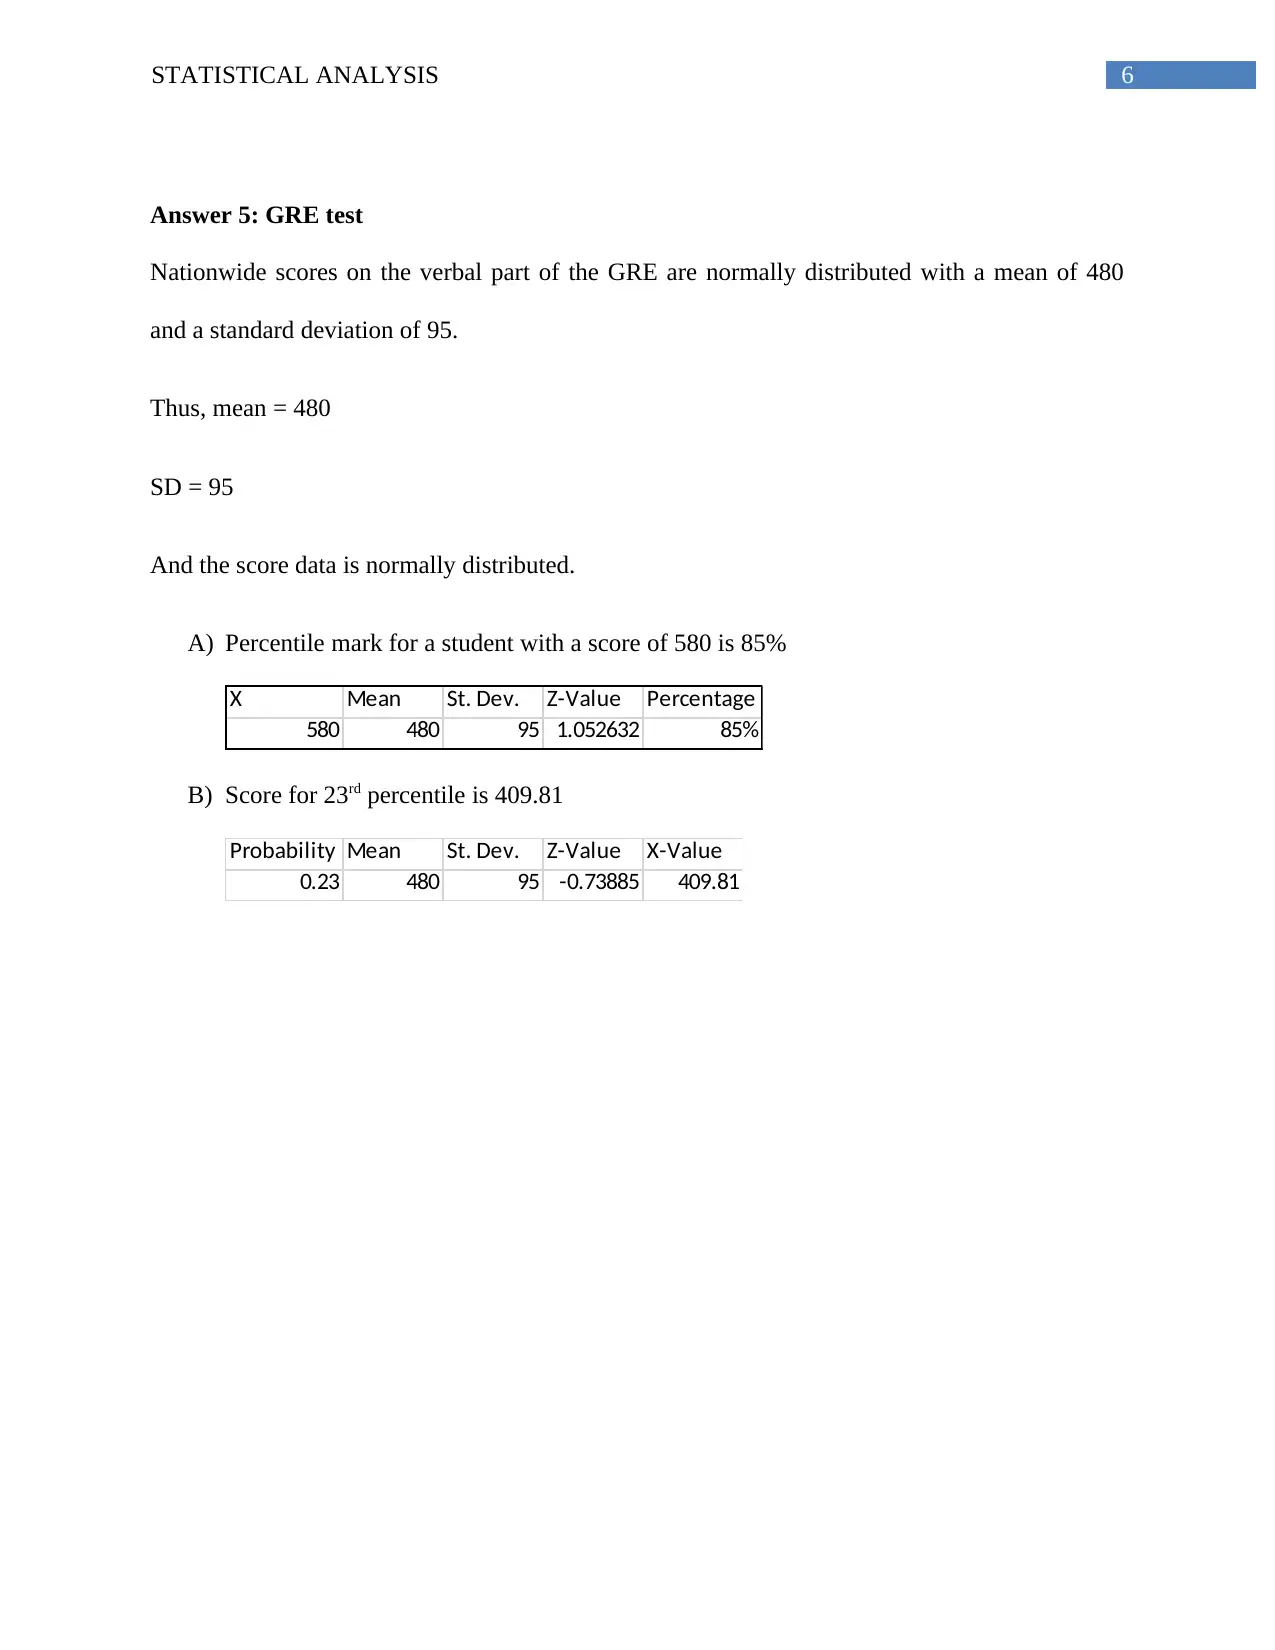
This document presents a comprehensive solution to a statistical analysis homework assignment. The assignment covers various statistical concepts, including hypothesis testing for the impact of red wine on heart disease, analysis of poll data on Brexit, interpretation of unemployment duration statistics (mean and median), calculations involving food expenditure, GRE score analysis, and probability calculations related to weather forecasting. The solution provides detailed explanations, calculations, and interpretations for each problem, demonstrating a strong understanding of statistical principles and their application to real-world scenarios. The document effectively addresses sampling errors, confounding variables, and external validity, providing a well-rounded analysis of the statistical concepts presented in the assignment. The solution also includes examples of positively skewed data and normal distribution.
tabler-icon-diamond-filled.svg

Contribute Materials

Your contribution can guide someone’s learning journey. Share your documents today.
Document Page
Running head: STATISTICAL ANALYSIS
Statistical Analysis
Name of the Student:
Name of the University:
Author note:
tabler-icon-diamond-filled.svg

Secure Best Marks with AI Grader

Need help grading? Try our AI Grader for instant feedback on your assignments.
Document Page
1STATISTICAL ANALYSIS
Answer 1: Will Red Wine Make the Difference?
Answer a)
It has been observed from studies originating in France around 15 years back that moderate red
wine drinking (1-2 glasses per day) lowered rates of heart disease.
The most appropriate method of testing this theory would be hypothesis testing through
experimental research design. In this method, the impact of moderate red wine drinking on heart
disease rates can be examined through experimental and quantitative study. Two groups of
sample will be chosen, and only one group will consume 2 glasses of red wine each day for the
study period. Pre and post examination, data will be collected and tested to see the impact of red
wine consumption on the heart disease.
Primary data would be collected on gender, age, average red wine consumption per day,
presence of heart diseases, and perception regarding the condition of the heart disease pre and
post examination. 100 people will be chosen for the primary data collection and they will be
divided into two equal groups of 50 people. The sample is collected from the database of cardiac
patients from a hospital.
Answer b)
In case of observational data collected from big datasets, the dependent variable (Y)
would be rate of heart disease among the patients, and independent variable (X) would be
average consumption of red wine per day.
Answer c)
Sampling error can occur in this case as the population size is too large compared to
sample size and types of heart disease are different with varying characteristics. In other words,
Document Page
2STATISTICAL ANALYSIS
there might be difference between sample and population parameter values, resulting in sampling
error (Chalmer 2020). Not all cardiac issues can be lessened by consuming red wine and the
level of complication is also a factor that could influence the impact of red wine. Hence, the
accuracy of the outcome can be hampered as the sample might include the above mentioned
cases also.
Answer d)
Confounding variable is one having an impact on the dependent variable apart from the
independent variable(s) (Satten, Kong and Datta 2018). Here, per day average consumption of
red wine is the independent variable, and hence, red wine is not a confounding variable.
However, age and gender would be confounding variables in this case as level of heart disease
and red wine consumption vary by age and gender.
Answer e)
External validity refers to the consistency of the data in outside contexts, gathered to
address the research issue. In other words, external validity can be defined as the ability of the
data to produce consistent generalized outcome in different situations and for different samples
(Bertanha and Imbens 2019). Extrapolation refers to the speculation or estimation of an event on
the basis of the facts and observations (Barberis et al. 2018). In case of different sample groups
in the USA, the concepts of external validity and extrapolation are concerns as different samples
in different regions would have different characteristics and different types of heart disease
which might not be affected by red wine consumption.
Document Page
3STATISTICAL ANALYSIS
Answer 2: Poll Question That Interests You
Answer a)
An online poll was conducted on ‘In hindsight, do you think Britain was right or wrong
to vote to leave the European Union?’ from 1 August 2016 - 2 August 2016, with the sample size
of 1722 and the respondents are all 18 years and above (whatukthinks.org 2016). As it was an
online survey, open to all, hence, it is assumed that simple random sampling technique was used
for sampling.
Answer b)
46% said Right, 42% said Wrong and 12% said Don’t know.
Answer c)
The survey was an online poll where random sampling was used. Measurement error or
sampling issues can occur as the sample size is quite large and bias as well as variance can arise
in the outcome. Firstly, the respondents can interpret the questions differently and their responses
might not match the expectation. Secondly, there can be missing data if the respondents do not
answer all the questions. Thirdly, the selection of population might not be correct which would
also lead to flawed outcome (Milla 2017).
tabler-icon-diamond-filled.svg

Secure Best Marks with AI Grader

Need help grading? Try our AI Grader for instant feedback on your assignments.
Document Page
4STATISTICAL ANALYSIS
Answer 3: Duration of Unemployment
The mean length of unemployment duration (the number of consecutive weeks that a person has
been unemployed) is 39 weeks while the median duration is 16 weeks.
Mean = 39 weeks
Median = 16 weeks
As the mean is greater than median, the dataset of the distribution of the unemployed in the U.S.
by weeks is positively skewed or skewed to the right (As shown in the image below)
Figure 1: Positively skewed data
Document Page
5STATISTICAL ANALYSIS
Answer 4: Food Expenditure
Bi-weekly food expenditures for families of four in a large city average $420 with a standard
deviation of $80
Thus, mean = $420
SD = $80
A) Percent less than $350 is 19%
X Mean St. Dev. Z-Value Percentage
350 420 80 -0.875 19%
B) Percent between $250 and $350 is 17%
Left Right Mean St. Dev Between
250 350 420 80 17%
C) Percent between $250 and $450 is 62.94%
Left Right Mean St. Dev Between
250 450 420 80 63%
D) Percent less than $250 or greater than $450 is 37.06% ( = 1-0.6294 = 0.3706)
Document Page
6STATISTICAL ANALYSIS
Answer 5: GRE test
Nationwide scores on the verbal part of the GRE are normally distributed with a mean of 480
and a standard deviation of 95.
Thus, mean = 480
SD = 95
And the score data is normally distributed.
A) Percentile mark for a student with a score of 580 is 85%
X Mean St. Dev. Z-Value Percentage
580 480 95 1.052632 85%
B) Score for 23rd percentile is 409.81
Probability Mean St. Dev. Z-Value X-Value
0.23 480 95 -0.73885 409.81
tabler-icon-diamond-filled.svg

Paraphrase This Document

Need a fresh take? Get an instant paraphrase of this document with our AI Paraphraser
Document Page
7STATISTICAL ANALYSIS
Answer 6: Probability and Conditional Probabilities
Weather forecasting is an everyday phenomenon which is based on probability. People
check on weather forecast before planning any event like picnic or sports activities. During the
monsoon, there is prediction of precipitation and this probability is calculated on the basis of
historical weather data. Based on various conditions, like, temperature, air pressure, humidity,
wind direction etc., the meteorologists determine the precipitation forecast. However, the
prediction is sometimes deceptive as weather condition changes quite frequently and that not
necessarily will match the previous years’ weather conditions. For example, due to global
warming, there is climate change and there is change in weather pattern, seasons as well as
precipitation level and seasons. Hence, often the monsoon prediction does not match or the
season gets delayed in the recent years.
Document Page
8STATISTICAL ANALYSIS
References
Barberis, N., Greenwood, R., Jin, L. and Shleifer, A., 2018. Extrapolation and bubbles. Journal
of Financial Economics, 129(2), pp.203-227.
Bertanha, M. and Imbens, G.W., 2019. External validity in fuzzy regression discontinuity
designs. Journal of Business & Economic Statistics, pp.1-39.
Chalmer, B.J., 2020. Understanding statistics. CRC Press.
Milla, N., 2017. Small area estimation of poverty incidence with sampling error variances
through generalized variance function. American Journal of Theoretical and Applied
Statistics, 6(2), pp.72-78.
Satten, G.A., Kong, M. and Datta, S., 2018. Multisample adjusted Ustatistics that account for
confounding covariates. Statistics in medicine, 37(23), pp.3357-3372.
whatukthinks.org, 2016. Full question: In hindsight, do you think Britain was right or wrong to
vote to leave the European Union?. [online] whatukthinks.org. Available at:
https://whatukthinks.org/eu/questions/in-highsight-do-you-think-britain-was-right-or-wrong-to-
vote-to-leave-the-eu/?notes [Accessed 4 Mar. 2020].
chevron_up_icon
1 out of 9
circle_padding
hide_on_mobile
zoom_out_icon
logo.png

Your All-in-One AI-Powered Toolkit for Academic Success.

Available 24*7 on WhatsApp / Email

[object Object]