BABS Foundation: Data Analysis and Forecasting Project Assignment
VerifiedAdded on 2022/12/27
|11
|1387
|69
Project
AI Summary
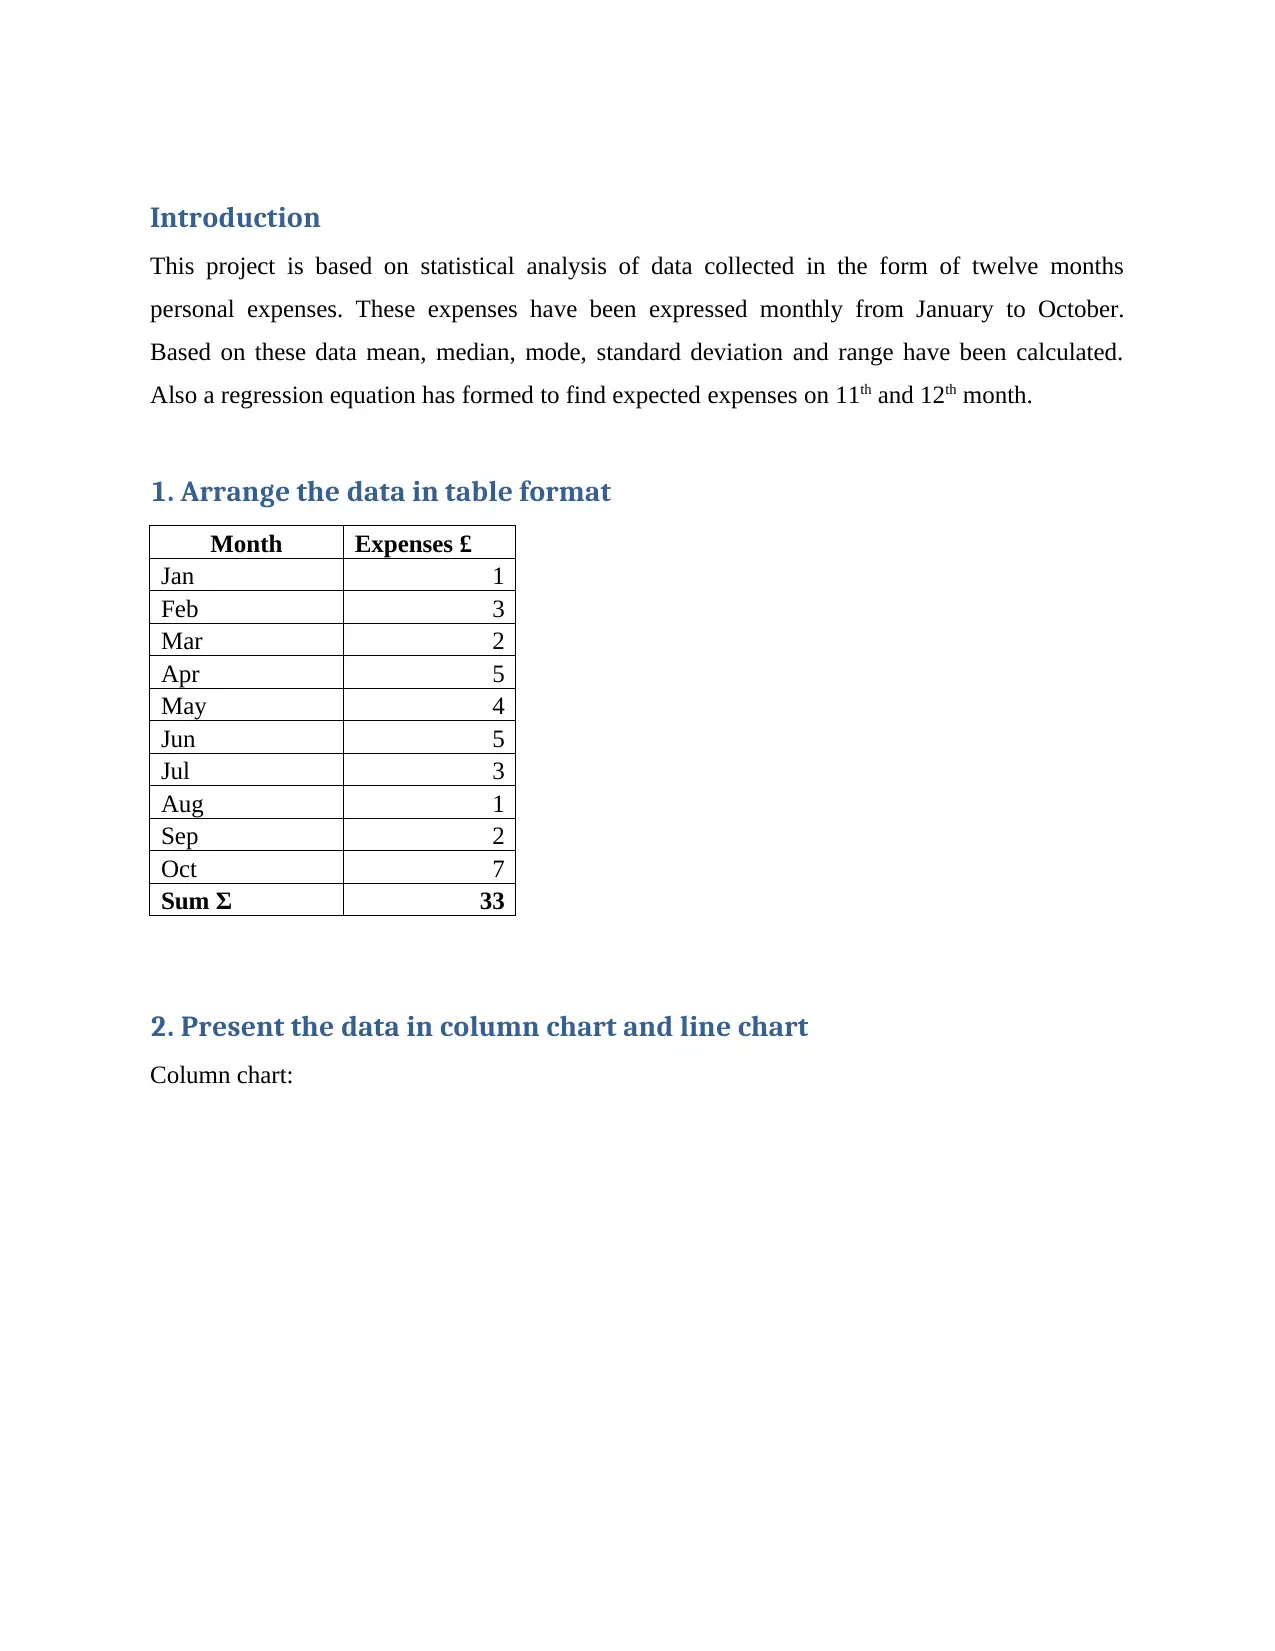
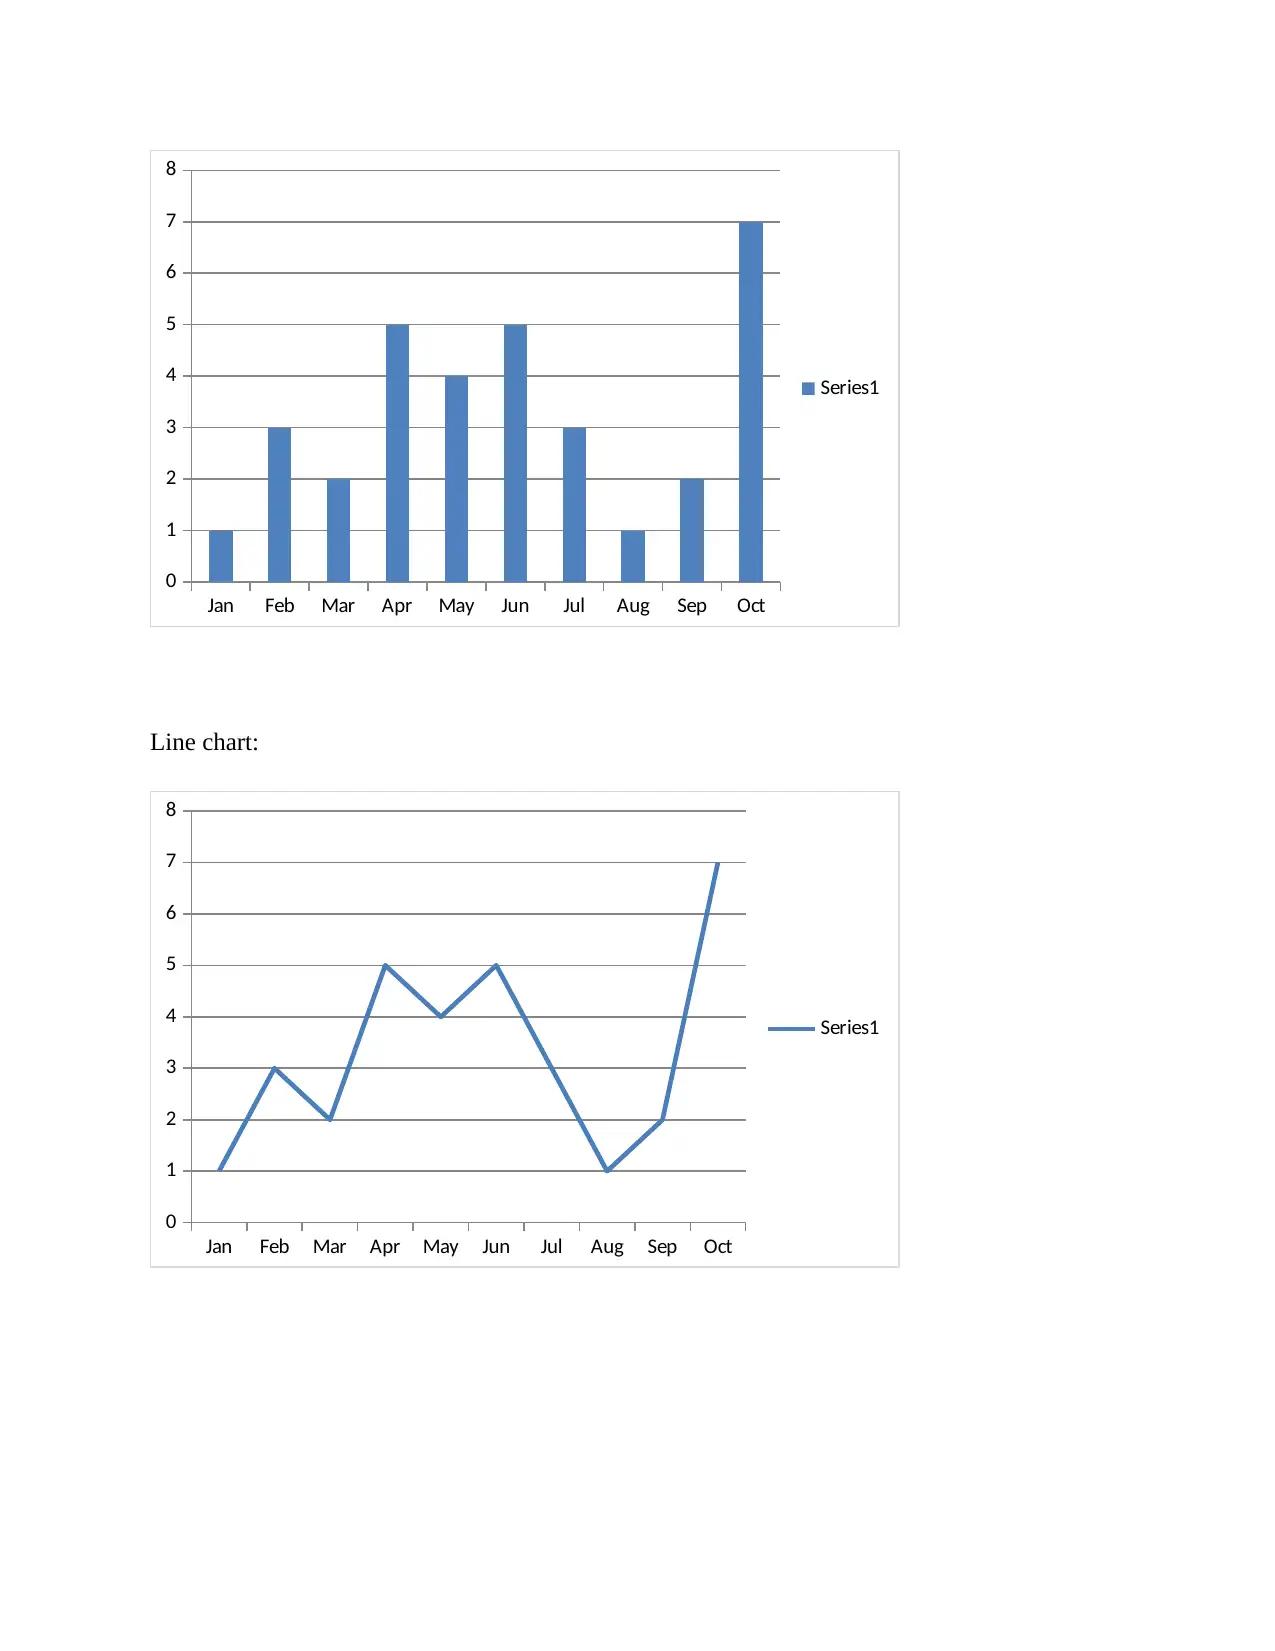
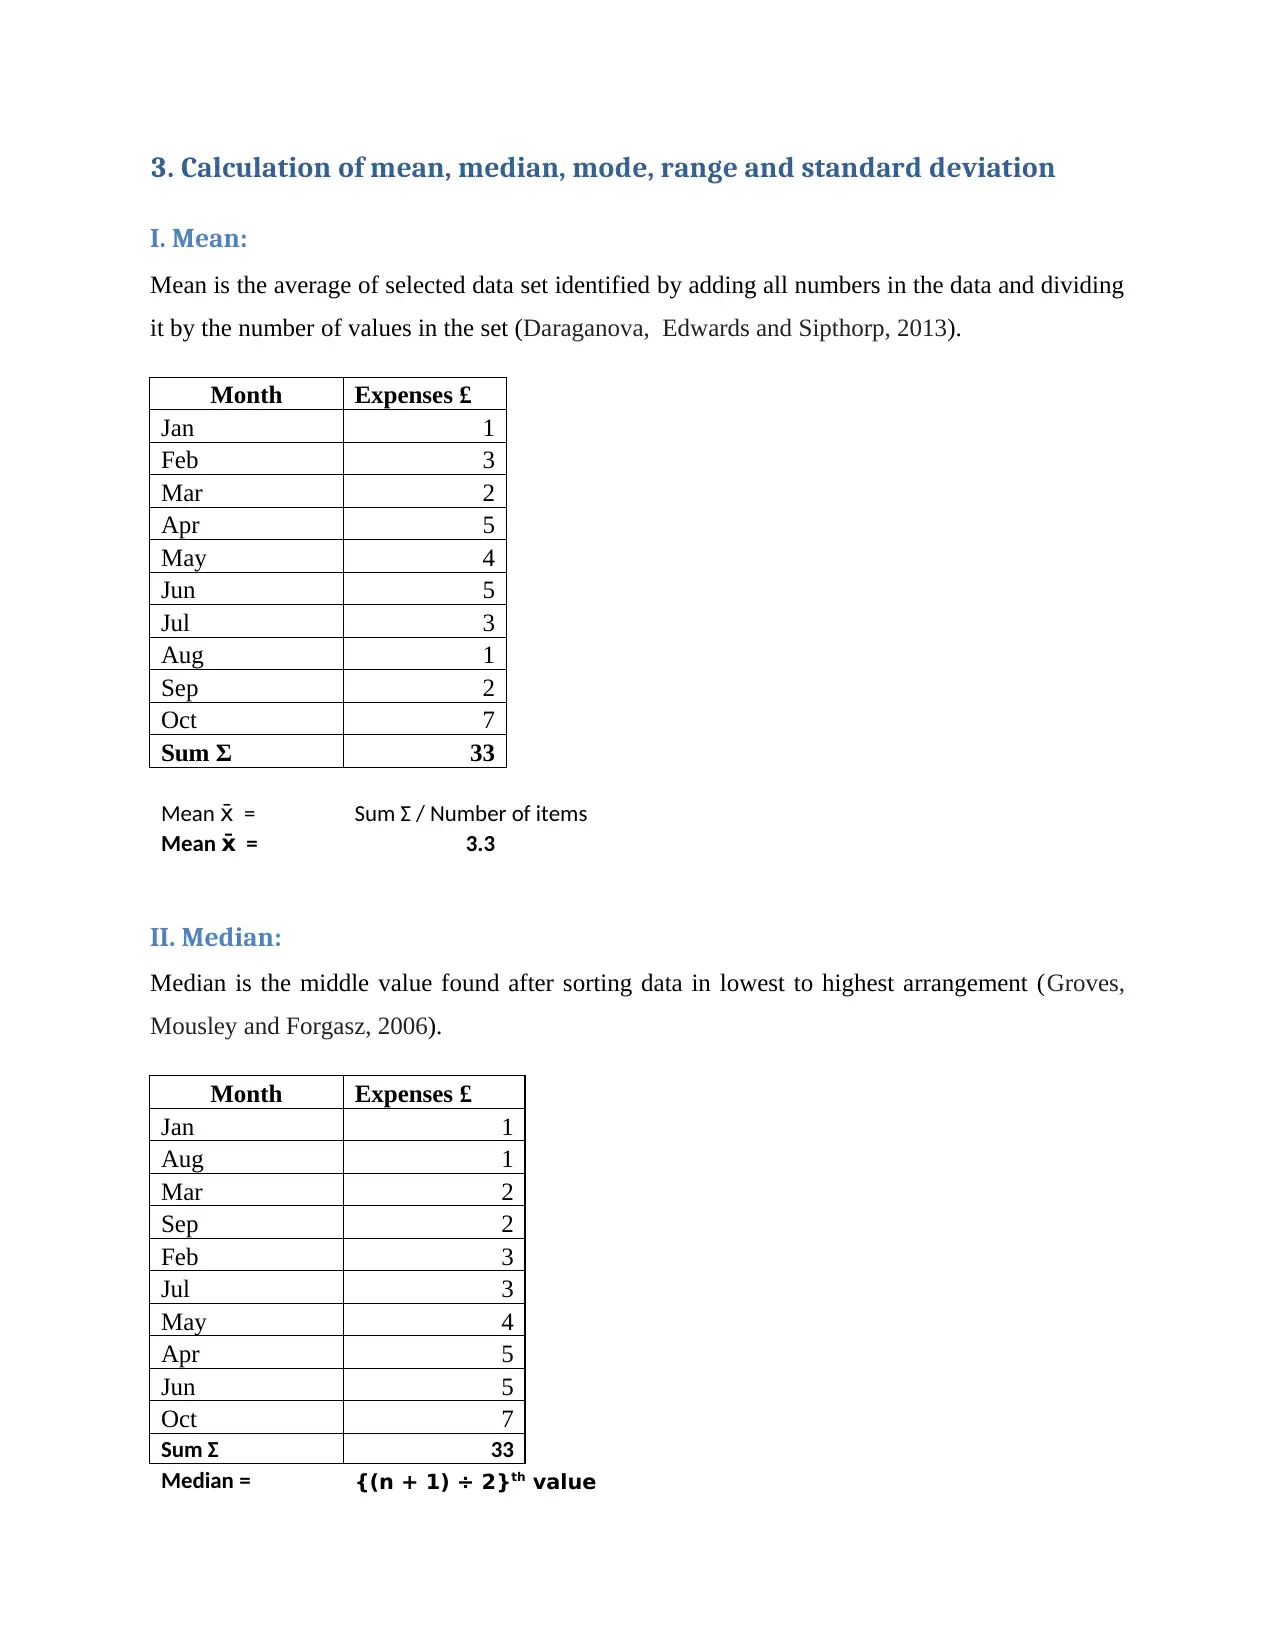
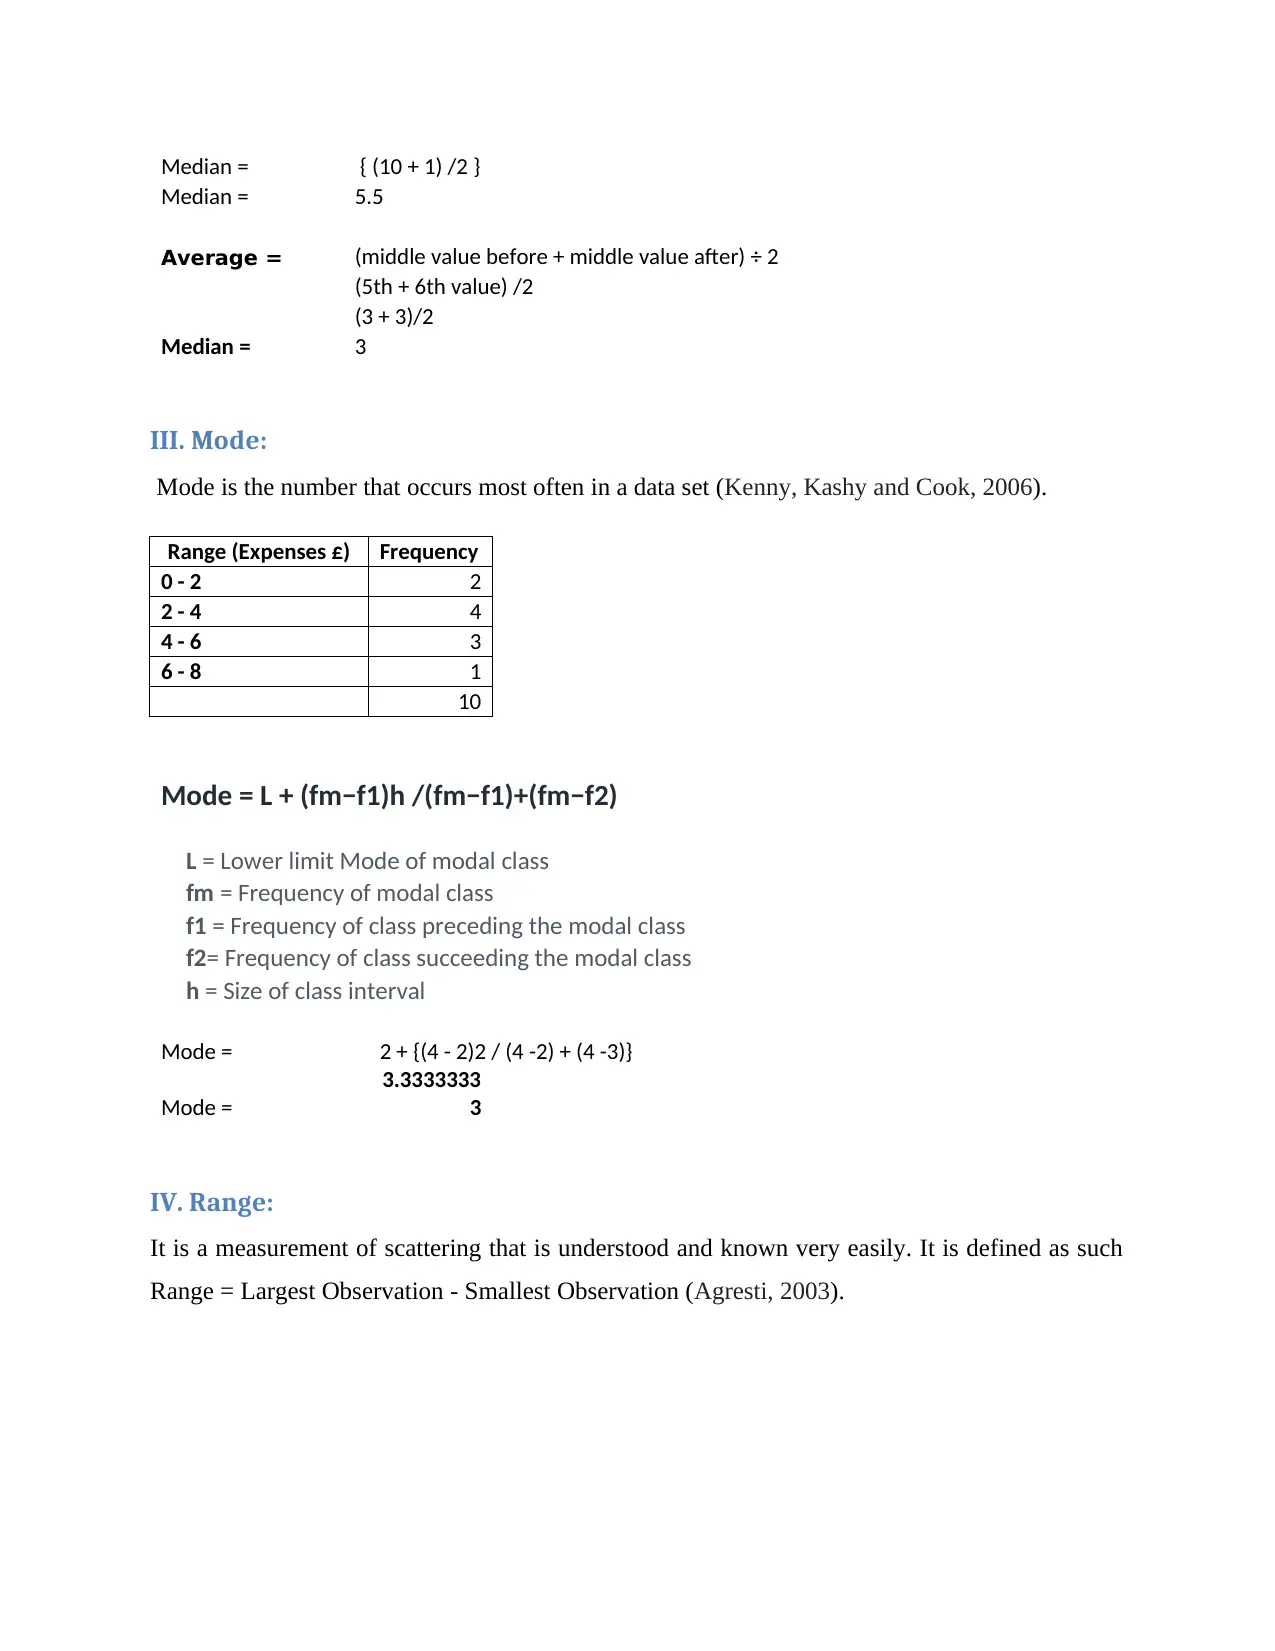
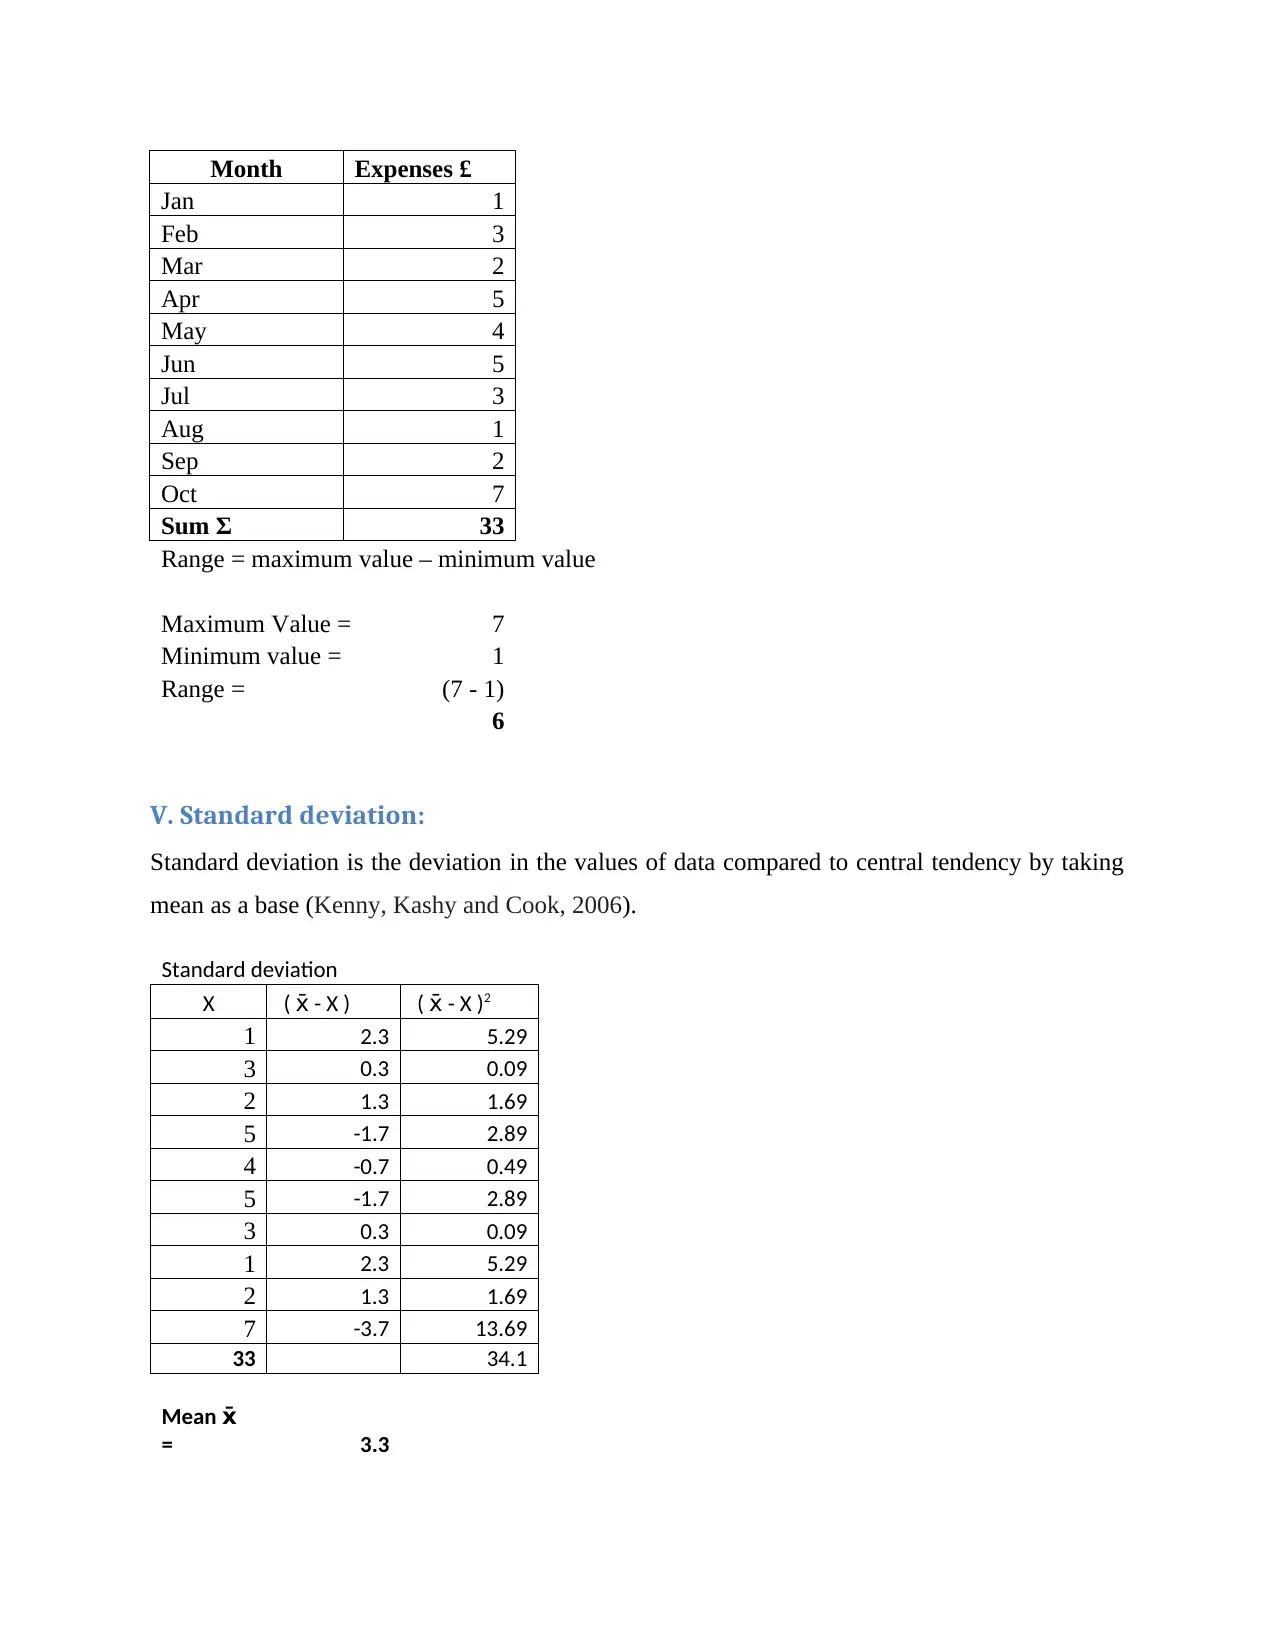
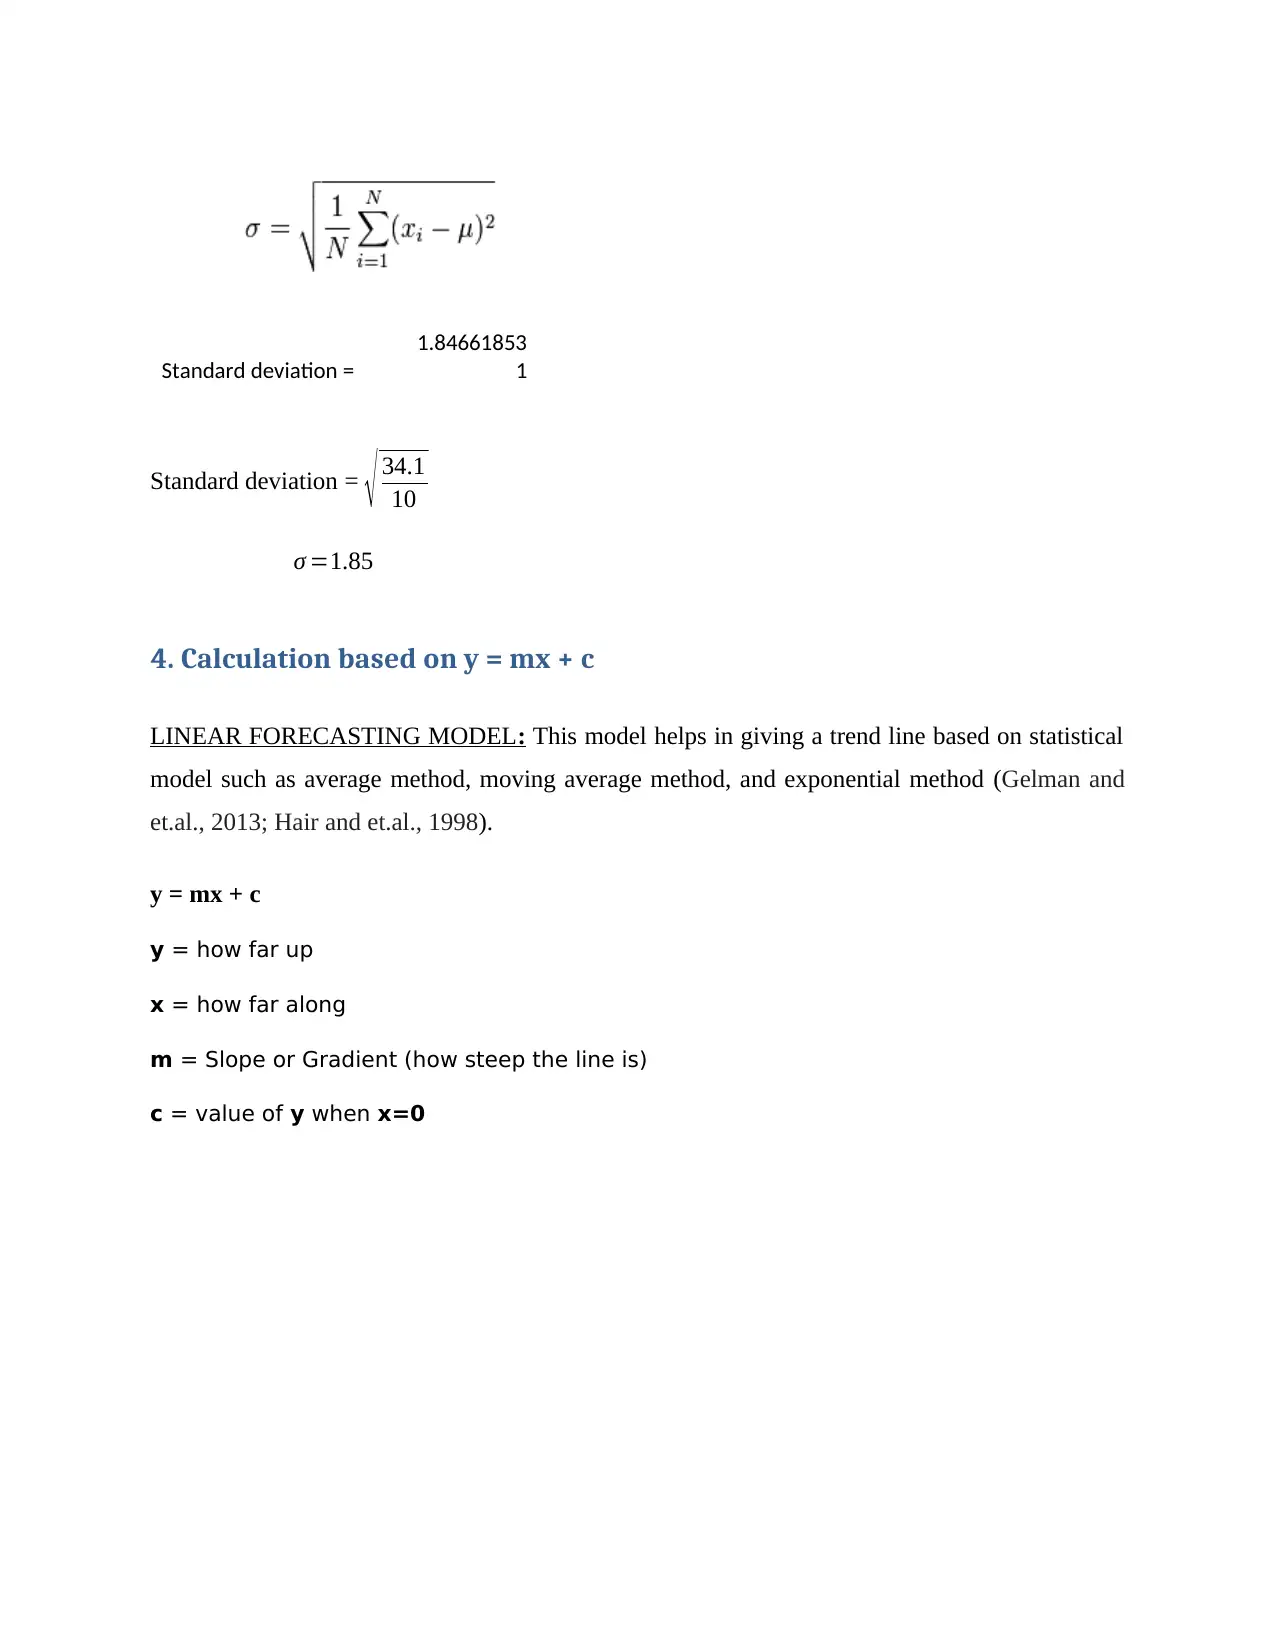
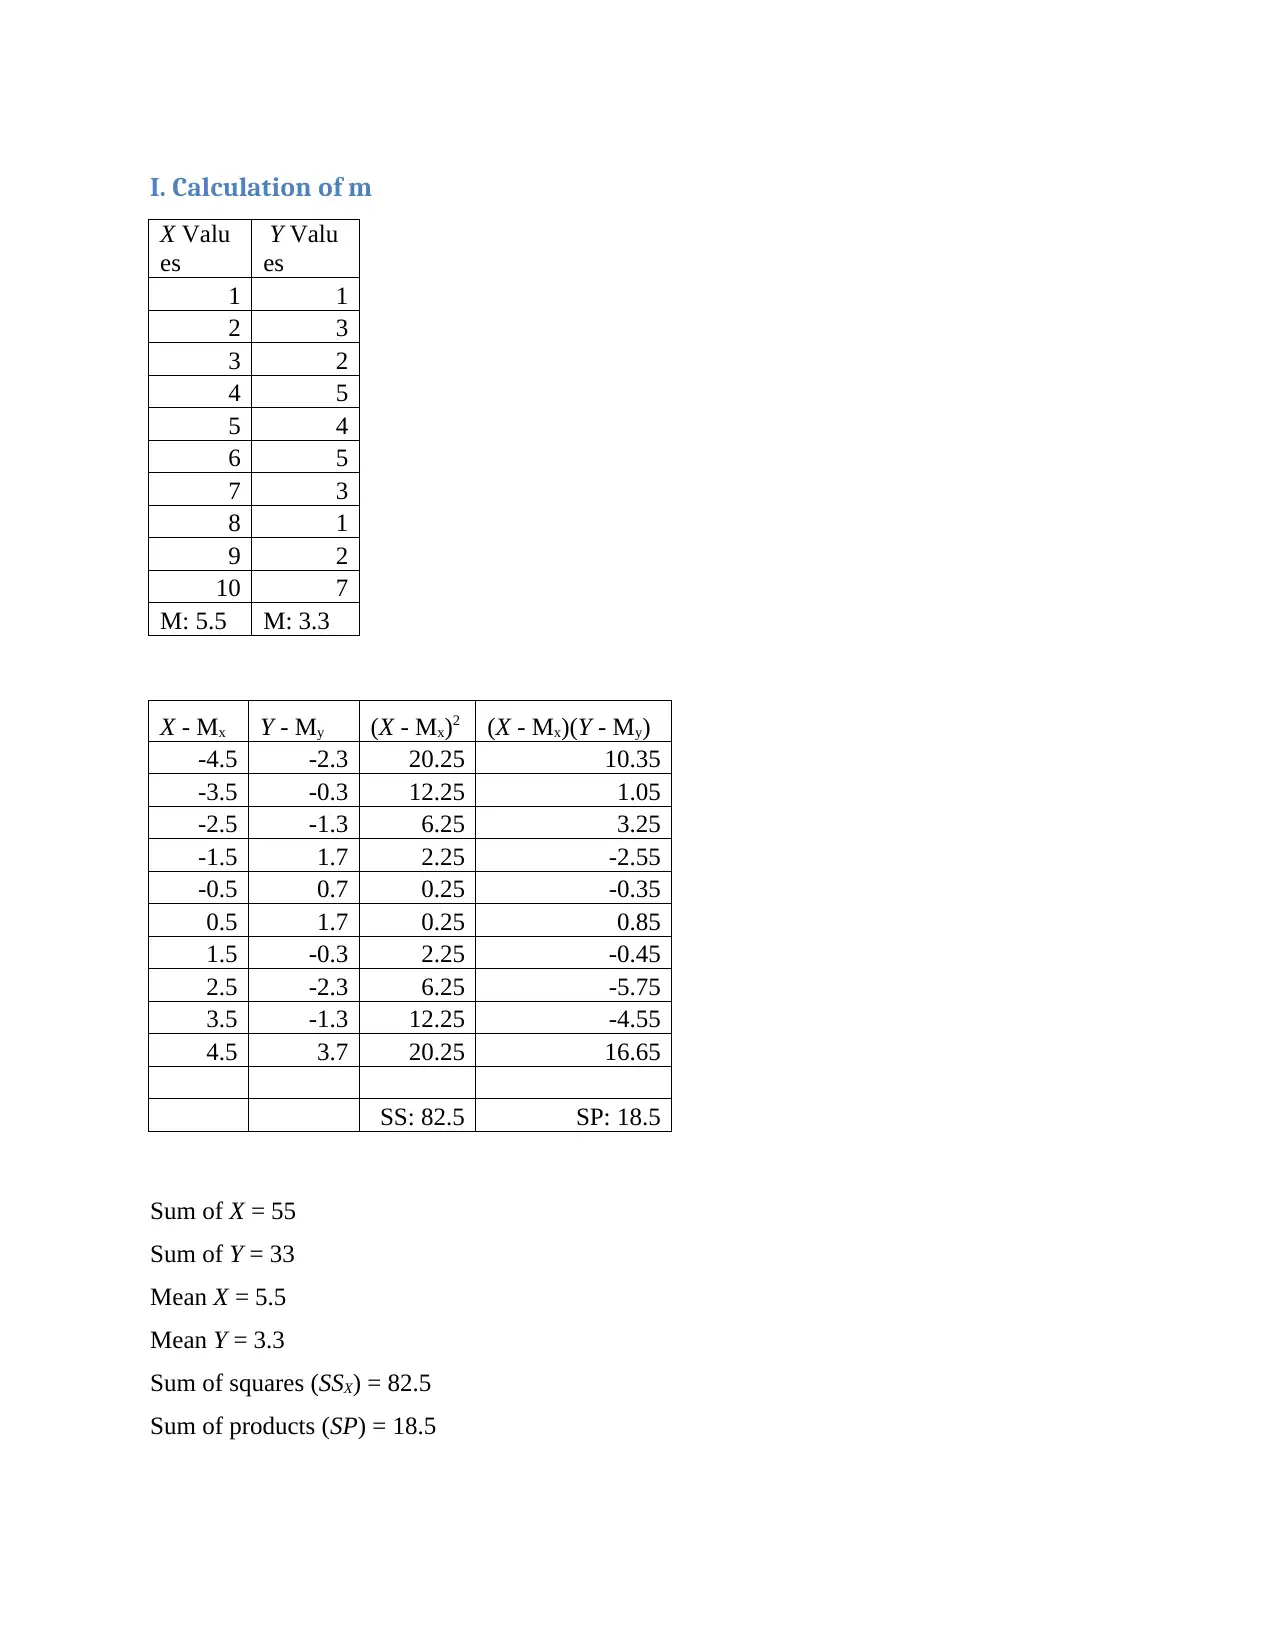
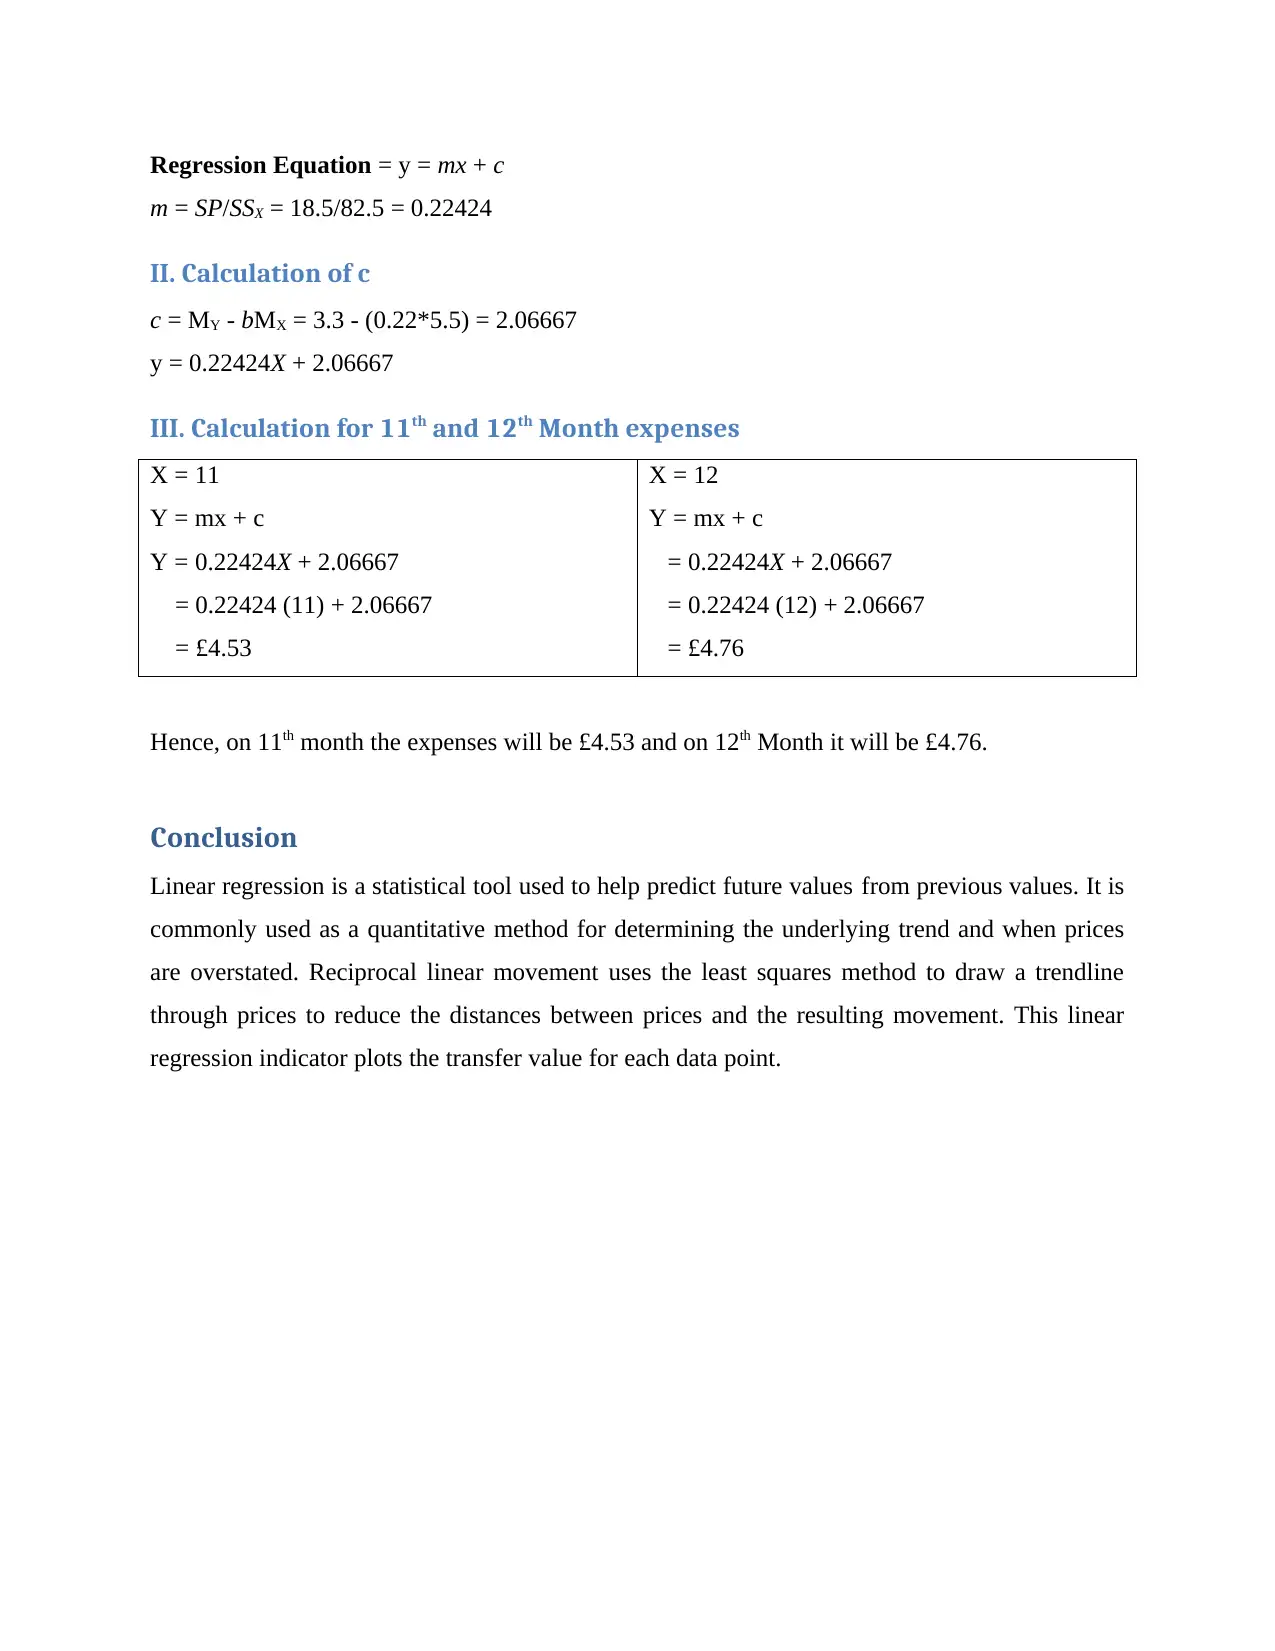
This project presents a statistical analysis of personal expenses collected over twelve months. The analysis includes arranging the data in a table format and visualizing it through column and line charts. Key statistical measures such as mean, median, mode, range, and standard deviation are calculated to understand the central tendencies and variability of the data. Furthermore, a linear regression model (y = mx + c) is developed to forecast expenses for the eleventh and twelfth months. The project concludes with a discussion on the application of linear regression as a forecasting tool, emphasizing its use in predicting future values based on historical data and highlighting its importance in identifying underlying trends. References are included to support the methodology and findings, offering a comprehensive approach to data analysis and forecasting.

Numeracy
and
Data Analysis
and
Data Analysis
Paraphrase This Document
Need a fresh take? Get an instant paraphrase of this document with our AI Paraphraser

Table of Contents
Introduction......................................................................................................................................3
1. Arrange the data in table format..................................................................................................3
2. Present the data in column chart and line chart...........................................................................3
3. Calculation of mean, median, mode, range and standard deviation............................................4
I. Mean:........................................................................................................................................4
II. Median:...................................................................................................................................5
III. Mode:.....................................................................................................................................6
IV. Range:....................................................................................................................................6
V. Standard deviation:.................................................................................................................7
4. Calculation based on y = mx + c.................................................................................................8
I. Calculation of m.......................................................................................................................8
II. Calculation of c.....................................................................................................................10
III. Calculation for 11th and 12th Month expenses......................................................................10
Conclusion.....................................................................................................................................10
REFERENCES..............................................................................................................................11

Introduction
This project is based on statistical analysis of data collected in the form of twelve months
personal expenses. These expenses have been expressed monthly from January to October.
Based on these data mean, median, mode, standard deviation and range have been calculated.
Also a regression equation has formed to find expected expenses on 11th and 12th month.
1. Arrange the data in table format
Month Expenses £
Jan 1
Feb 3
Mar 2
Apr 5
May 4
Jun 5
Jul 3
Aug 1
Sep 2
Oct 7
Sum Ʃ 33
2. Present the data in column chart and line chart
Column chart:
⊘ This is a preview!⊘
Do you want full access?
Subscribe today to unlock all pages.

Trusted by 1+ million students worldwide

Jan Feb Mar Apr May Jun Jul Aug Sep Oct
0
1
2
3
4
5
6
7
8
Series1
Line chart:
Jan Feb Mar Apr May Jun Jul Aug Sep Oct
0
1
2
3
4
5
6
7
8
Series1
0
1
2
3
4
5
6
7
8
Series1
Line chart:
Jan Feb Mar Apr May Jun Jul Aug Sep Oct
0
1
2
3
4
5
6
7
8
Series1
Paraphrase This Document
Need a fresh take? Get an instant paraphrase of this document with our AI Paraphraser

3. Calculation of mean, median, mode, range and standard deviation
I. Mean:
Mean is the average of selected data set identified by adding all numbers in the data and dividing
it by the number of values in the set (Daraganova, Edwards and Sipthorp, 2013).
Month Expenses £
Jan 1
Feb 3
Mar 2
Apr 5
May 4
Jun 5
Jul 3
Aug 1
Sep 2
Oct 7
Sum Ʃ 33
Mean =x̄ Sum Ʃ / Number of items
Mean =x̄ 3.3
II. Median:
Median is the middle value found after sorting data in lowest to highest arrangement (Groves,
Mousley and Forgasz, 2006).
Month Expenses £
Jan 1
Aug 1
Mar 2
Sep 2
Feb 3
Jul 3
May 4
Apr 5
Jun 5
Oct 7
Sum Ʃ 33
Median = {(n + 1) ÷ 2}th value

Median = { (10 + 1) /2 }
Median = 5.5
Average = (middle value before + middle value after) ÷ 2
(5th + 6th value) /2
(3 + 3)/2
Median = 3
III. Mode:
Mode is the number that occurs most often in a data set (Kenny, Kashy and Cook, 2006).
Range (Expenses £) Frequency
0 - 2 2
2 - 4 4
4 - 6 3
6 - 8 1
10
Mode = L + (fm−f1)h /(fm−f1)+(fm−f2)
L = Lower limit Mode of modal class
fm = Frequency of modal class
f1 = Frequency of class preceding the modal class
f2= Frequency of class succeeding the modal class
h = Size of class interval
Mode = 2 + {(4 - 2)2 / (4 -2) + (4 -3)}
Mode =
3.3333333
3
IV. Range:
It is a measurement of scattering that is understood and known very easily. It is defined as such
Range = Largest Observation - Smallest Observation (Agresti, 2003).
⊘ This is a preview!⊘
Do you want full access?
Subscribe today to unlock all pages.

Trusted by 1+ million students worldwide

Month Expenses £
Jan 1
Feb 3
Mar 2
Apr 5
May 4
Jun 5
Jul 3
Aug 1
Sep 2
Oct 7
Sum Ʃ 33
Range = maximum value – minimum value
Maximum Value = 7
Minimum value = 1
Range = (7 - 1)
6
V. Standard deviation:
Standard deviation is the deviation in the values of data compared to central tendency by taking
mean as a base (Kenny, Kashy and Cook, 2006).
Standard deviation
X ( - X )x̄ ( - X )x̄ 2
1 2.3 5.29
3 0.3 0.09
2 1.3 1.69
5 -1.7 2.89
4 -0.7 0.49
5 -1.7 2.89
3 0.3 0.09
1 2.3 5.29
2 1.3 1.69
7 -3.7 13.69
33 34.1
Mean x̄
= 3.3
Paraphrase This Document
Need a fresh take? Get an instant paraphrase of this document with our AI Paraphraser

Standard deviation =
1.84661853
1
Standard deviation = √ 34.1
10
σ =1.85
4. Calculation based on y = mx + c
LINEAR FORECASTING MODEL: This model helps in giving a trend line based on statistical
model such as average method, moving average method, and exponential method (Gelman and
et.al., 2013; Hair and et.al., 1998).
y = mx + c
y = how far up
x = how far along
m = Slope or Gradient (how steep the line is)
c = value of y when x=0

I. Calculation of m
X Valu
es
Y Valu
es
1 1
2 3
3 2
4 5
5 4
6 5
7 3
8 1
9 2
10 7
M: 5.5 M: 3.3
X - Mx Y - My (X - Mx)2 (X - Mx)(Y - My)
-4.5 -2.3 20.25 10.35
-3.5 -0.3 12.25 1.05
-2.5 -1.3 6.25 3.25
-1.5 1.7 2.25 -2.55
-0.5 0.7 0.25 -0.35
0.5 1.7 0.25 0.85
1.5 -0.3 2.25 -0.45
2.5 -2.3 6.25 -5.75
3.5 -1.3 12.25 -4.55
4.5 3.7 20.25 16.65
SS: 82.5 SP: 18.5
Sum of X = 55
Sum of Y = 33
Mean X = 5.5
Mean Y = 3.3
Sum of squares (SSX) = 82.5
Sum of products (SP) = 18.5
⊘ This is a preview!⊘
Do you want full access?
Subscribe today to unlock all pages.

Trusted by 1+ million students worldwide

Regression Equation = y = mx + c
m = SP/SSX = 18.5/82.5 = 0.22424
II. Calculation of c
c = MY - bMX = 3.3 - (0.22*5.5) = 2.06667
y = 0.22424X + 2.06667
III. Calculation for 11th and 12th Month expenses
X = 11
Y = mx + c
Y = 0.22424X + 2.06667
= 0.22424 (11) + 2.06667
= £4.53
X = 12
Y = mx + c
= 0.22424X + 2.06667
= 0.22424 (12) + 2.06667
= £4.76
Hence, on 11th month the expenses will be £4.53 and on 12th Month it will be £4.76.
Conclusion
Linear regression is a statistical tool used to help predict future values from previous values. It is
commonly used as a quantitative method for determining the underlying trend and when prices
are overstated. Reciprocal linear movement uses the least squares method to draw a trendline
through prices to reduce the distances between prices and the resulting movement. This linear
regression indicator plots the transfer value for each data point.
Paraphrase This Document
Need a fresh take? Get an instant paraphrase of this document with our AI Paraphraser

REFERENCES
Books
Agresti, A., 2003. Categorical data analysis (Vol. 482). John Wiley & Sons.
Daraganova, G., Edwards, B. and Sipthorp, M., 2013. Using National Assessment Program
Literacy and Numeracy (NAPLAN) Data in the Longitudinal Study of Australian Children
(LSAC). Department of Families, Housing, Community Services and Indigenous Affairs.
Gelman, A., and et.al., 2013. Bayesian data analysis. CRC press.
Groves, S., Mousley, J. and Forgasz, H., 2006. A primary numeracy: a mapping review and
analysis of Australian research in numeracy learning at the primary school level: report.
Centre for Studies in Mathematics, Science and Environmental Education, Deakin
University.
Hair, J.F., and et.al., 1998. Multivariate data analysis (Vol. 5, No. 3, pp. 207-219). Upper Saddle
River, NJ: Prentice hall.
Kenny, D.A., Kashy, D.A. and Cook, W.L., 2006. Dyadic data analysis. Guilford press.
1 out of 11