Southern Cross University MAT10251 Project Part C Analysis

Verified

Added on  2023/04/26

|11
|1553
|213
Project
AI Summary
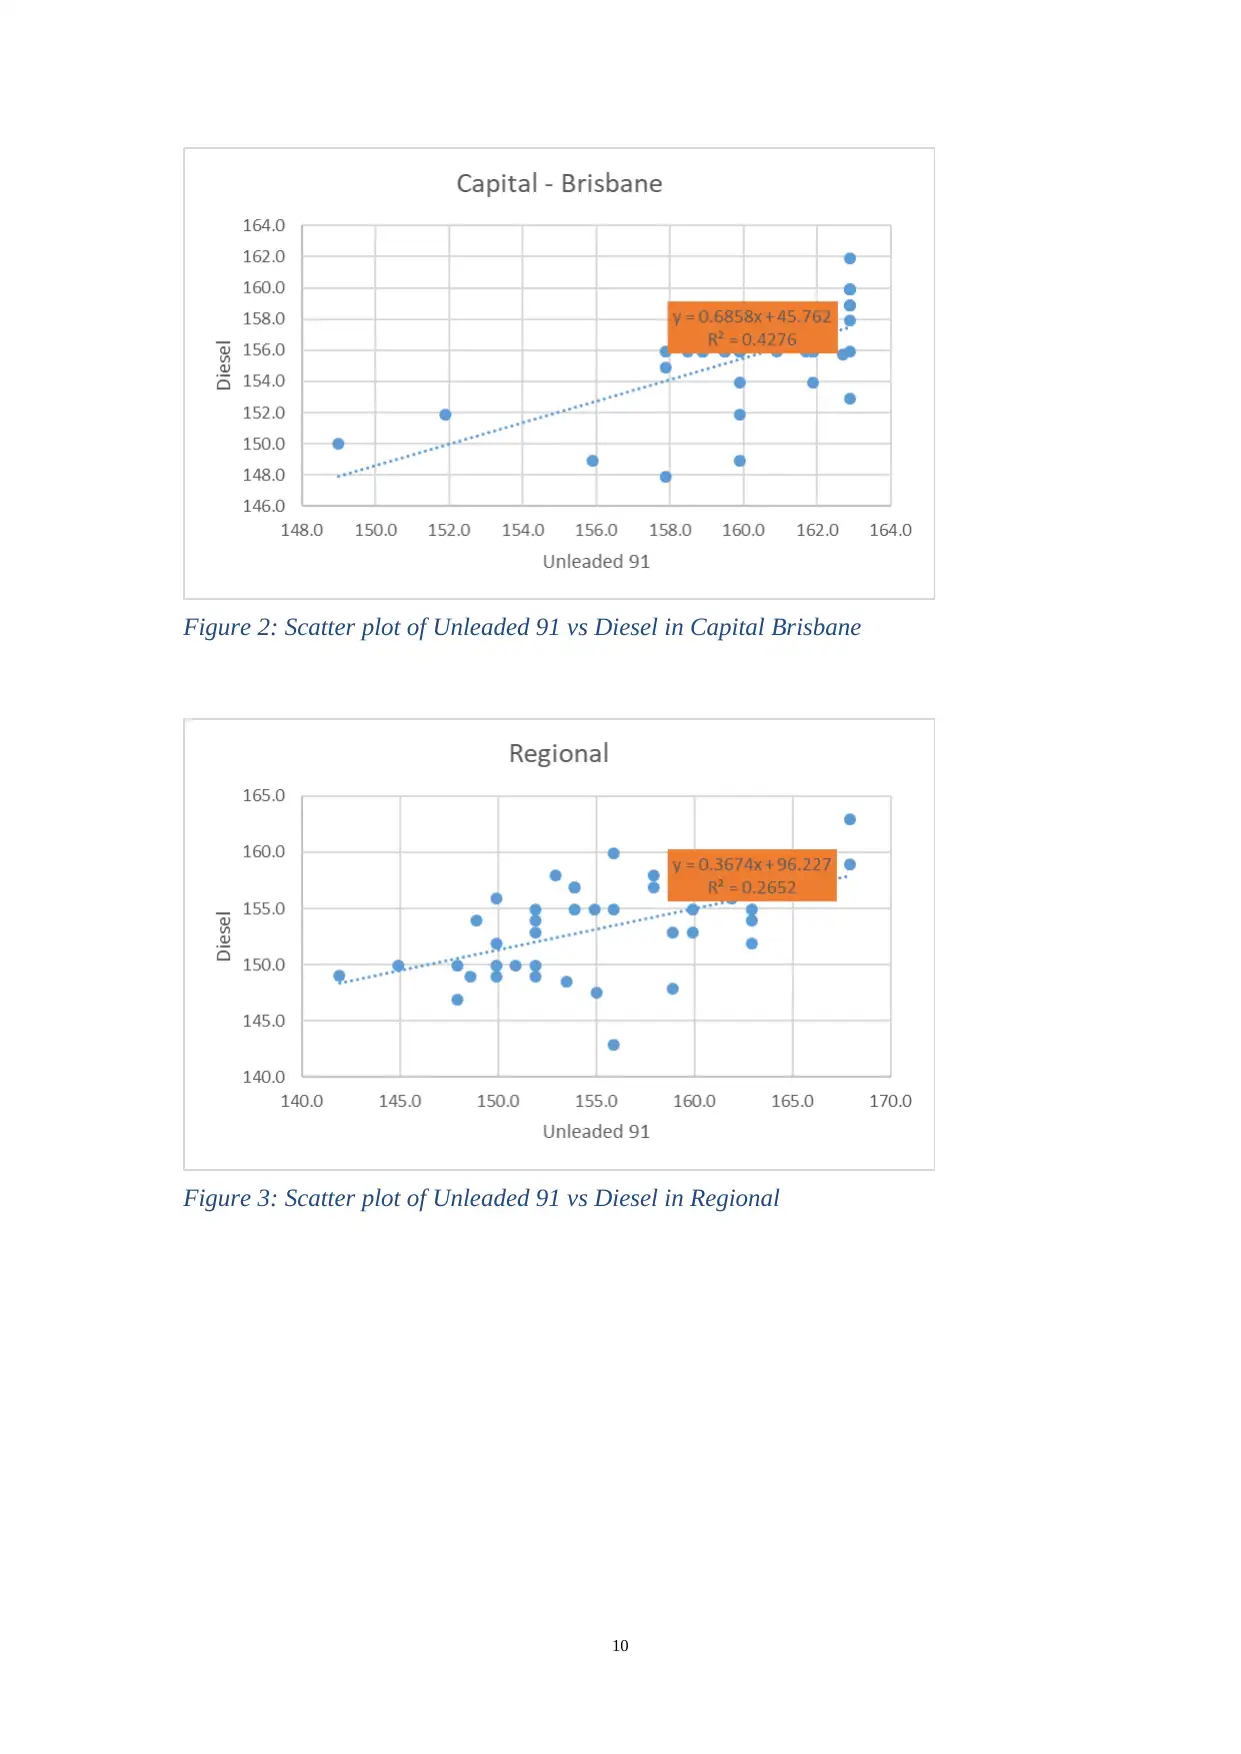
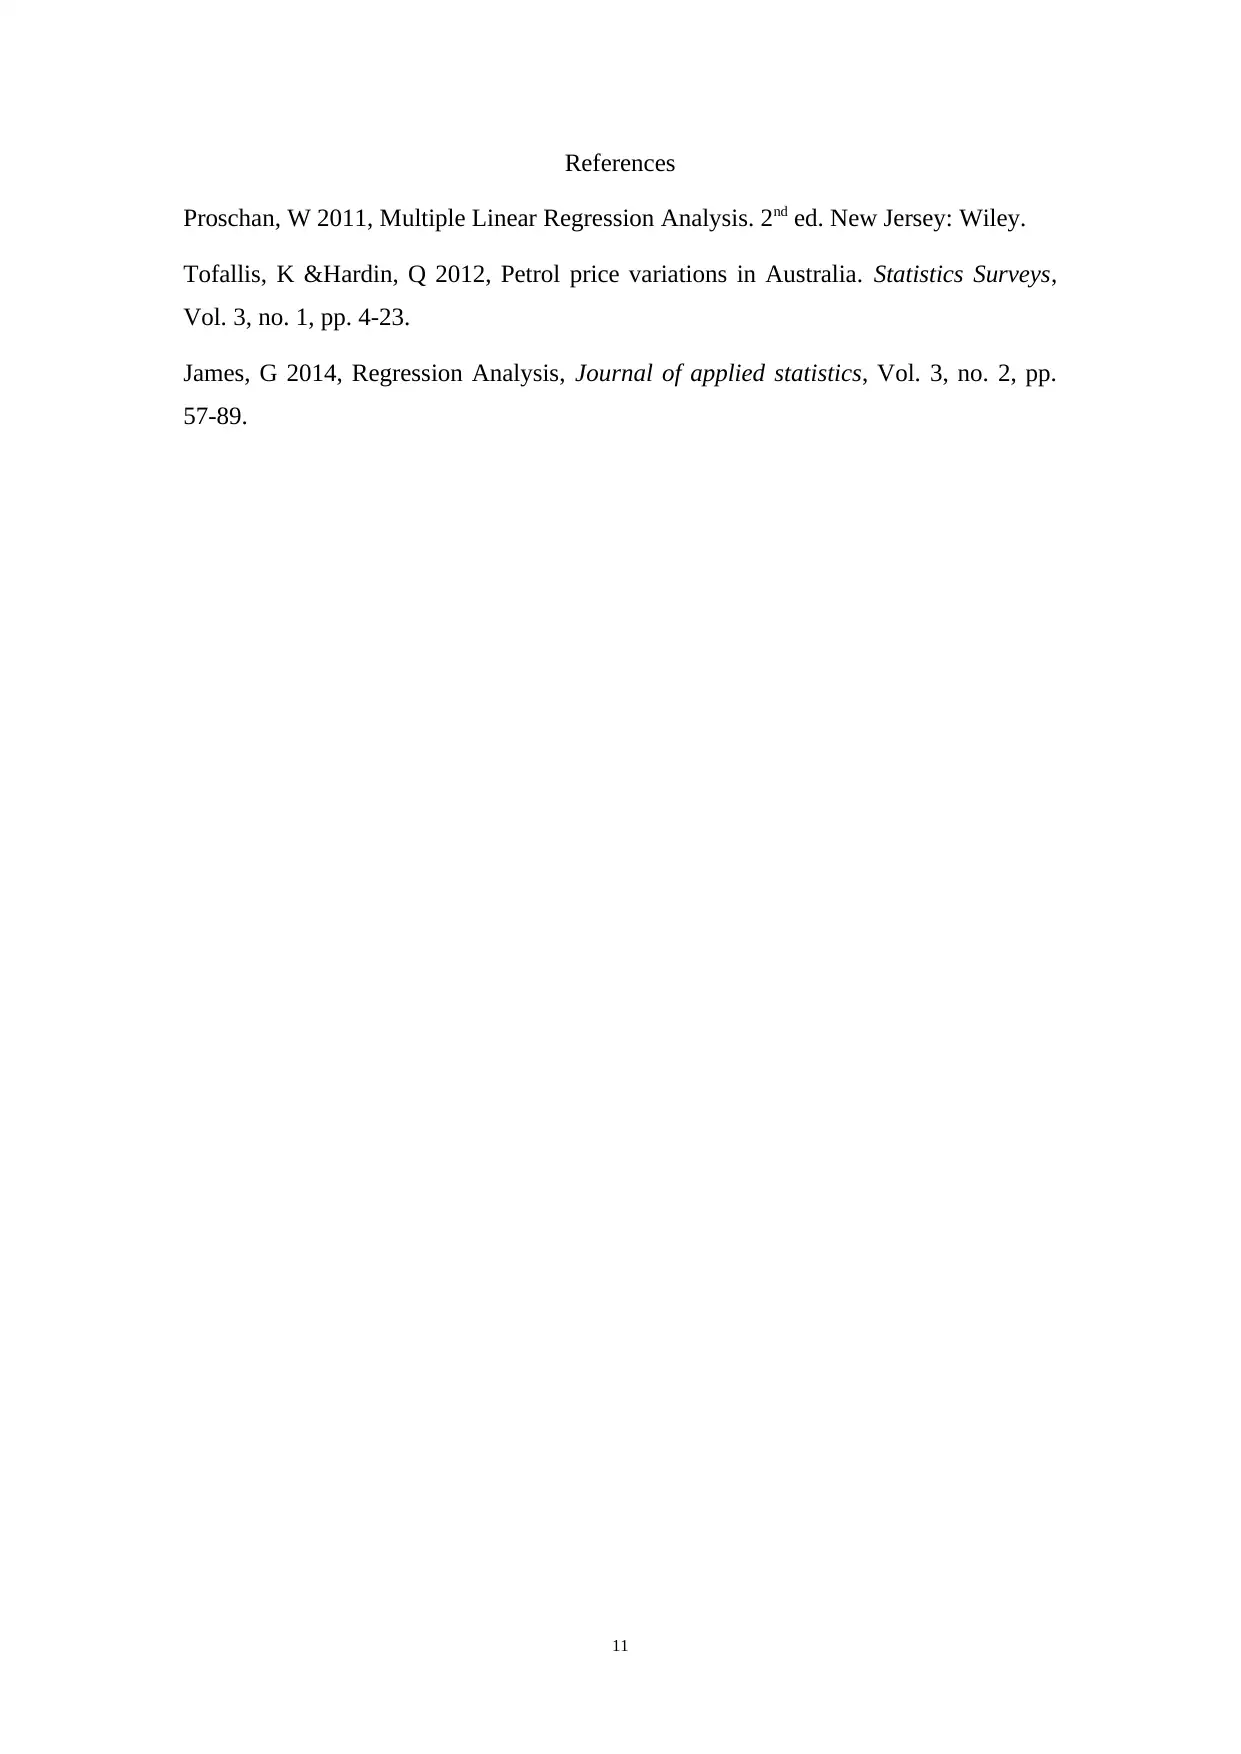
This document presents a comprehensive statistical analysis project focusing on fuel price data from Queensland, Australia. The project, completed for Southern Cross University's MAT10251 course, explores various statistical techniques to analyze the relationship between unleaded 91 and diesel fuel prices. It begins with a hypothesis test comparing fuel prices in the capital city versus other regions, utilizing a two-sample t-test with unequal variances to determine if the mean price of unleaded 91 is lower in the capital. The analysis includes interpretation of the t-statistic, p-value, and the decision to reject the null hypothesis. Further, the project investigates the correlation between unleaded 91 and diesel prices using a simple linear regression model, including the development of a scatter plot, and the interpretation of regression and correlation coefficients, including the R-squared value. Finally, the project extends to a multiple linear regression model to determine the influence of location on the relationship between unleaded 91 and diesel prices. The findings suggest location impacts the relationship between the two products. The document includes detailed statistical calculations, interpretations, and appendices with supporting tables and figures.
tabler-icon-diamond-filled.svg

Contribute Materials

Your contribution can guide someone’s learning journey. Share your documents today.
Document Page
SOUTHERN CROSS UNIVERSITY
School of Business and Tourism
MAT10251 Statistical Analysis
PART C
Student Name: Ashish Kharel
Student ID No.: 23097289
Tutor’s name:
Due date:
Date submitted:
Declaration:
I have read and understand the Rules Relating to Awards (Rule 3 Section
18 – Academic Integrity) as contained in the SCU Policy Library. I
understand the penalties that apply for academic misconduct and agree
to be bound by these rules.
The work I am submitting electronically is entirely my own work.
.
Signed:
(please type
your name)
Date:
tabler-icon-diamond-filled.svg

Secure Best Marks with AI Grader

Need help grading? Try our AI Grader for instant feedback on your assignments.
Document Page
STUDENT NAME:
STUDENT ID NUMBER:
MAT10251 – Statistical Analysis
Project Part C
Complete the summary table below.
Sample Number (last digit of your student ID number) 9
Fuel (Independent Variable Questions 2 and 3)
First letter family name A to M – Unleaded 91
First letter family name N to Z – Diesel
Unleaded 91
Level of Significance 95%
Value: 20%
2
Document Page
PLEASE ENSURE YOU KEEP A COPY OF YOUR PROJECT
3
Document Page
Marking and Feedback Sheet
Mark
Cover sheet or sample incorrect -2
Incorrect format, including file name -2
Statistical Inference Question 1
Choice of technique, assumptions & other required steps 5
Calculation (Excel output) 3
Decision and conclusion 2
Regression and Correlation
Assumptions and random variables defined 2
Simple Linear Model Question 2
Scatter plot 3
Equation and coefficients 2
Interpretation of regression & correlation coefficients 2
Multiple Linear Model Question 3
Equation, Coefficients and p-values 4
Interpretation of regression & correlation coefficients 3
Statistical Inference
Choice of technique and other required steps 2
Decision and conclusion 2
Best model 1
Total Statistical Calculations 31 0.0
Written Answer
Question 1
Introduction, discussion and results 2
Question 2 & 3
Introduction 1
Interpretation of scatter plot 2
Introduction and discussion of best model 2
Structure, grammar and spelling 2
Total Written Answer 9 0.0
Total Part C 40 0.0
Max
Marks
Comments
4
tabler-icon-diamond-filled.svg

Secure Best Marks with AI Grader

Need help grading? Try our AI Grader for instant feedback on your assignments.
Document Page
Written Answer Part C
C.1 Price Comparison Capital City versus Elsewhere in State
Introduction
There is an assumption that the prices of fuels are normally less in the capital
city when compared to other areas in the state of Queensland. In this case Oz-Fuel
intend to evaluate if on 11th September 2018 the mean price of the unleaded 91 was
lower in the capital in comparison to all the other parts of the state. So as to verify this
notion will conduct a hypothesis test using the variable Location and Unleaded 91. The
test to be applied is the two-sample t- Test assuming unequal variance as it assists
evaluate if the mean differences are of any statistical relevance.
Analysis
From the excel output presented as table 1 in the appendix the value of t critical
for a one tail test is obtains as 1.6730, this is lower than the value of t Stat which is
5.348. In such a scenario the decision is to reject the null hypothesis and conclude that
the fuel price in the capital was lower than in any other area in the city. The same
decision can be arrived at when the p value for the one tail is applied (James 2014).
For instance, the p value is less than 0.05, at a 95% confidence interval the null
hypothesis is rejected and thus it can be concluded that the capital fuel prices are
relatively lower.
Conclusion
Using the sampled data, it can be concluded that as at 11 September 2018 the
fuel prices in various towns in the capital of Queensland state were retailing at lower
prices compared to locations outside the capital.
C.2 Relationship between Unleaded 91 and Diesel
Introduction
How an item relates to another do have an effect in business management
decision. In this scenario Oz-Fuel needs to understand if the Unleaded 91 fuel prices
do have an effect on the Diesel fuel prices. So as to analyse these two variables, the
unleaded 91 will be considered as the independent variable (x) and Diesel the
dependent variable (y). This simply mean that the prices of the unleaded fuel are not
5
Document Page
affected by any indicated variable while those of diesel might be affected by the
changes in unleaded 91 prices.
Analysis
To evaluate the relationship a scatter plot has been plotted. This is given as
figure 1 in the appendix section of the report. From the scatter plot the equation
y=0.4452 x +84.267 is the least square regression equation. It gives an explanation as
to how the two variables relate (Tofallis & Hardin 2012).
From the equation the coefficient of variation is obtained as 0.6168, this value
means the two variables have strong positive correlation. This is to say 38.01% of the
changes in the diesel prices are caused by changes in the price of the unleaded 91. A
change in the unleaded fuel by 1 cent will mean a variation of the diesel price by
0.4452 cents. These findings are also supported by the distributions in the scatter plot.
Conclusion
The unleaded fuel prices do affect the prices of diesel therefore when
determining the prices of the unleaded care should be taken so that the prices of diesel
is not inflated.
Question 3: Multiple Linear Regression Model Topic 9
Introduction
Occasionally, several factors might influence the relationship between items. In
our case we are interested in evaluating if the association between the unleaded 91 and
diesel is influenced by location.
6
Document Page
Analysis
Location is not a numerical variable hence it is not possible to include it when
plotting a scatter plot. However so as to evaluate it will group the data by location and
obtain the various plots.
From figure 2 and 3 in the appendix, it’s evident that in the capital 42.76 of the
variations in the diesel prices are explainable by the variations in the prices of
unleaded 91 this is different from the case in Regional where only 26.52% of the
variations in diesel can be explained by the variations in the unleaded 91 pieces. This
means that even though the two products prices do have a positive relationship, the
location have an influence in the magnitude of the relationship (Proschan 2011). The
multiple linear regression is thereby a more effective model in determining the prices
as it accounts for the variable location
Conclusion
In conclusion location is a factor that should be taken into account when modelling the
prices of diesel using the unleaded 91 as it has an impact on the relationship between
the two products
7
tabler-icon-diamond-filled.svg

Paraphrase This Document

Need a fresh take? Get an instant paraphrase of this document with our AI Paraphraser
Document Page
Appendices Part C
Appendix C.1 Statistical answer for Question 1
Steps
Development of hypothesis
The hypothesis tested were
H0 : μ0 ¿ μ1
Vs
H1 : μ0 ¿ μ1
Where μ0 is the mean of the unleaded 91 fuel in the city and μ1 the mean price of the
unleaded fuel outside the capital.
The decision it to reject the null hypothesis if
t Critical one tail <t Stat or if P one tail<α
α is the level of confidence which in our case is 0.05
Capital - Brisbane Regional
Mean 160.3756098 154.7564103
Variance 8.772390244 34.70673414
Observations 41 39
Hypothesized Mean Difference 0
df 55
t Stat 5.348279673
P(T<=t) one-tail 8.84615E-07
t Critical one-tail 1.673033965
P(T<=t) two-tail 1.76923E-06
t Critical two-tail 2.004044783
t-Test: Two-Sample Assuming Unequal Variances
Table 1: Two sample t-Test
Appendix C.2 Statistical answer for Question 2 and Question 3
Assumptions and Variables Defined
8
Document Page
Simple Linear Regression Model
Figure 1: Scatter plot of Unleaded 91 vs Diesel prices
Regression Statistics
Multiple R 0.616733
R Square 0.38036
Adjusted R Square 0.372416
Standard Error 3.086462
Observations 80
ANOVA
df SS MS F Significance F
Regression 1 456.1121 456.1120587 47.87950083 1.12048E-09
Residual 78 743.0474 9.526249247
Total 79 1199.16
CoefficientsStandard Error t Stat P-value Lower 95% Upper 95% Lower 95.0% Upper 95.0%
Intercept 84.26718 10.14899 8.30301348 2.43285E-12 64.06209423 104.4722559 64.06209423 104.4722559
Unleaded 91 (Cents per Litre) 0.445236 0.064345 6.919501487 1.12048E-09 0.317134712 0.57333718 0.317134712 0.57333718
SUMMARY OUTPUT
Table 2: A model of a simple linear regression Develop a simple linear regression model Include interpretation of regression and correlation coefficients.
Multiple Linear Regression Model
9
Document Page
Figure 2: Scatter plot of Unleaded 91 vs Diesel in Capital Brisbane
Figure 3: Scatter plot of Unleaded 91 vs Diesel in Regional
10
tabler-icon-diamond-filled.svg

Secure Best Marks with AI Grader

Need help grading? Try our AI Grader for instant feedback on your assignments.
Document Page
References
Proschan, W 2011, Multiple Linear Regression Analysis. 2nd ed. New Jersey: Wiley.
Tofallis, K &Hardin, Q 2012, Petrol price variations in Australia. Statistics Surveys,
Vol. 3, no. 1, pp. 4-23.
James, G 2014, Regression Analysis, Journal of applied statistics, Vol. 3, no. 2, pp.
57-89.
11
chevron_up_icon
1 out of 11
circle_padding
hide_on_mobile
zoom_out_icon
logo.png

Your All-in-One AI-Powered Toolkit for Academic Success.

Available 24*7 on WhatsApp / Email

[object Object]