Comprehensive Statistical Analysis of Project Success Factors
VerifiedAdded on 2023/05/29
|22
|3549
|221
Report
AI Summary
This report presents a statistical analysis of various independent variables (gender, highest educational level, major of study, qualifications in project management, number of courses in project management, and experience as a project manager) and their impact on dependent variables related to project success (completion within budget and time, meeting quality and design requirements, client satisfaction, and business objectives). The analysis includes descriptive statistics, frequency tables, correlation analysis, reliability tests (Cronbach's Alpha), cross-tabulations, ANOVA, and regression analysis. Key findings include correlations between project success metrics and the influence of educational background and experience on project outcomes. The report concludes with a discussion of the statistical results and their implications for understanding and improving project success.
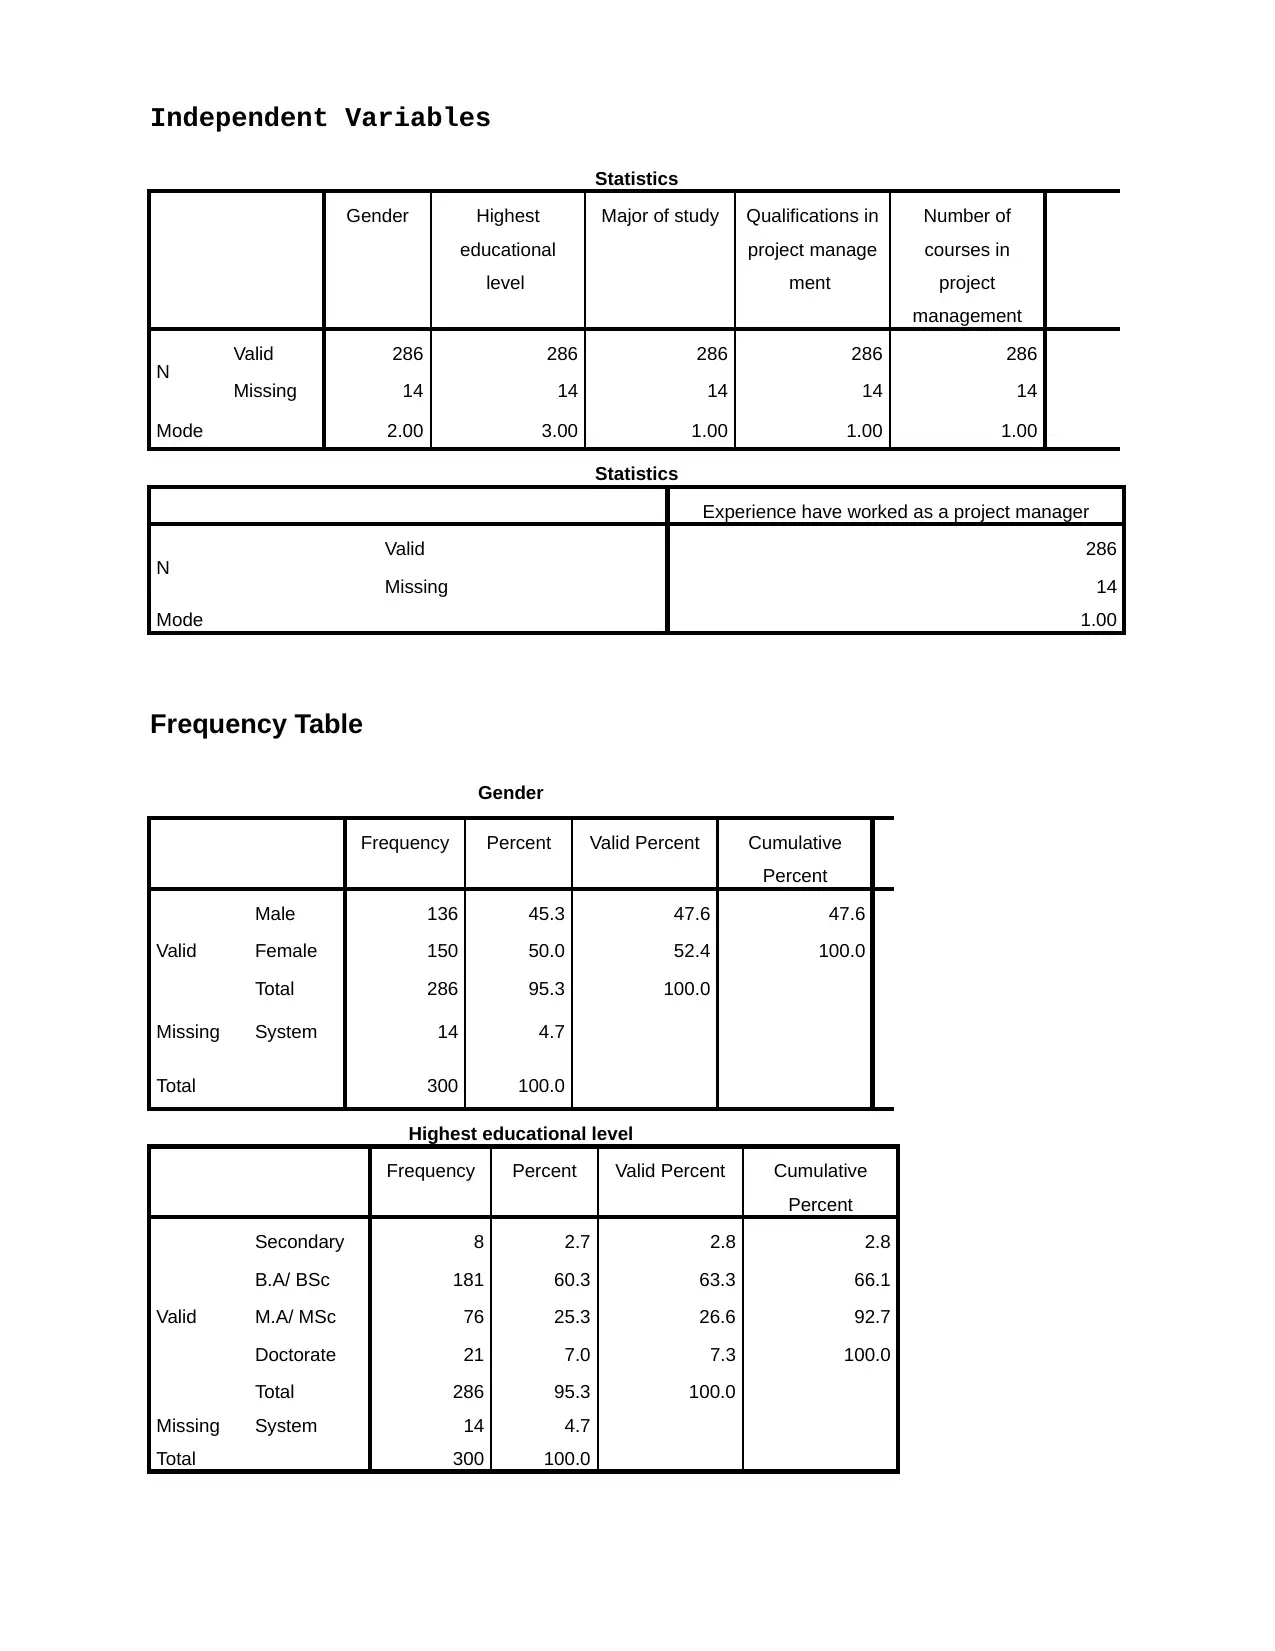
Independent Variables
Statistics
Gender Highest
educational
level
Major of study Qualifications in
project manage
ment
Number of
courses in
project
management
N Valid 286 286 286 286 286
Missing 14 14 14 14 14
Mode 2.00 3.00 1.00 1.00 1.00
Statistics
Experience have worked as a project manager
N Valid 286
Missing 14
Mode 1.00
Frequency Table
Gender
Frequency Percent Valid Percent Cumulative
Percent
Valid
Male 136 45.3 47.6 47.6
Female 150 50.0 52.4 100.0
Total 286 95.3 100.0
Missing System 14 4.7
Total 300 100.0
Highest educational level
Frequency Percent Valid Percent Cumulative
Percent
Valid
Secondary 8 2.7 2.8 2.8
B.A/ BSc 181 60.3 63.3 66.1
M.A/ MSc 76 25.3 26.6 92.7
Doctorate 21 7.0 7.3 100.0
Total 286 95.3 100.0
Missing System 14 4.7
Total 300 100.0
Statistics
Gender Highest
educational
level
Major of study Qualifications in
project manage
ment
Number of
courses in
project
management
N Valid 286 286 286 286 286
Missing 14 14 14 14 14
Mode 2.00 3.00 1.00 1.00 1.00
Statistics
Experience have worked as a project manager
N Valid 286
Missing 14
Mode 1.00
Frequency Table
Gender
Frequency Percent Valid Percent Cumulative
Percent
Valid
Male 136 45.3 47.6 47.6
Female 150 50.0 52.4 100.0
Total 286 95.3 100.0
Missing System 14 4.7
Total 300 100.0
Highest educational level
Frequency Percent Valid Percent Cumulative
Percent
Valid
Secondary 8 2.7 2.8 2.8
B.A/ BSc 181 60.3 63.3 66.1
M.A/ MSc 76 25.3 26.6 92.7
Doctorate 21 7.0 7.3 100.0
Total 286 95.3 100.0
Missing System 14 4.7
Total 300 100.0
Paraphrase This Document
Need a fresh take? Get an instant paraphrase of this document with our AI Paraphraser
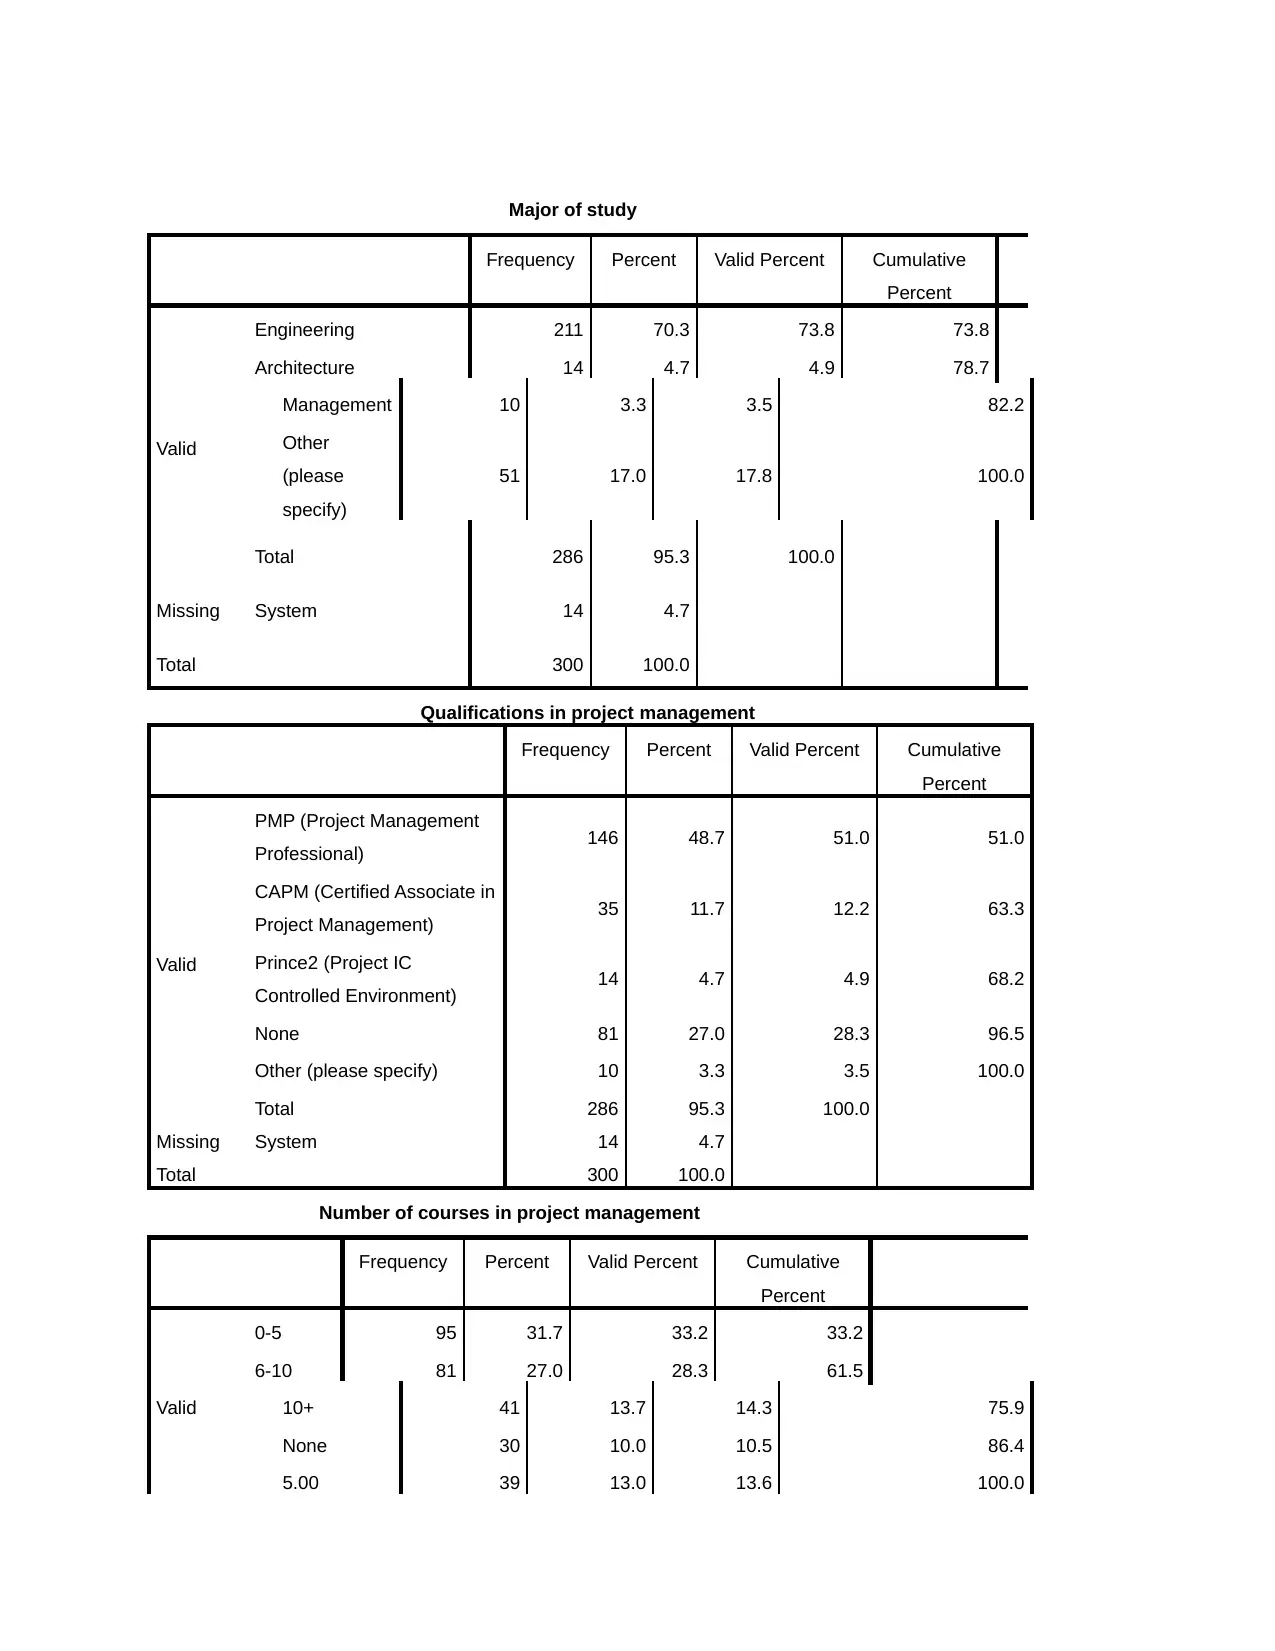
Major of study
Frequency Percent Valid Percent Cumulative
Percent
Valid
Engineering 211 70.3 73.8 73.8
Architecture 14 4.7 4.9 78.7
Management 10 3.3 3.5 82.2
Other
(please
specify)
51 17.0 17.8 100.0
Total 286 95.3 100.0
Missing System 14 4.7
Total 300 100.0
Qualifications in project management
Frequency Percent Valid Percent Cumulative
Percent
Valid
PMP (Project Management
Professional) 146 48.7 51.0 51.0
CAPM (Certified Associate in
Project Management) 35 11.7 12.2 63.3
Prince2 (Project IC
Controlled Environment) 14 4.7 4.9 68.2
None 81 27.0 28.3 96.5
Other (please specify) 10 3.3 3.5 100.0
Total 286 95.3 100.0
Missing System 14 4.7
Total 300 100.0
Number of courses in project management
Frequency Percent Valid Percent Cumulative
Percent
Valid
0-5 95 31.7 33.2 33.2
6-10 81 27.0 28.3 61.5
10+ 41 13.7 14.3 75.9
None 30 10.0 10.5 86.4
5.00 39 13.0 13.6 100.0
Frequency Percent Valid Percent Cumulative
Percent
Valid
Engineering 211 70.3 73.8 73.8
Architecture 14 4.7 4.9 78.7
Management 10 3.3 3.5 82.2
Other
(please
specify)
51 17.0 17.8 100.0
Total 286 95.3 100.0
Missing System 14 4.7
Total 300 100.0
Qualifications in project management
Frequency Percent Valid Percent Cumulative
Percent
Valid
PMP (Project Management
Professional) 146 48.7 51.0 51.0
CAPM (Certified Associate in
Project Management) 35 11.7 12.2 63.3
Prince2 (Project IC
Controlled Environment) 14 4.7 4.9 68.2
None 81 27.0 28.3 96.5
Other (please specify) 10 3.3 3.5 100.0
Total 286 95.3 100.0
Missing System 14 4.7
Total 300 100.0
Number of courses in project management
Frequency Percent Valid Percent Cumulative
Percent
Valid
0-5 95 31.7 33.2 33.2
6-10 81 27.0 28.3 61.5
10+ 41 13.7 14.3 75.9
None 30 10.0 10.5 86.4
5.00 39 13.0 13.6 100.0
Total 286 95.3 100.0
Missing System 14 4.7
Total 300 100.0
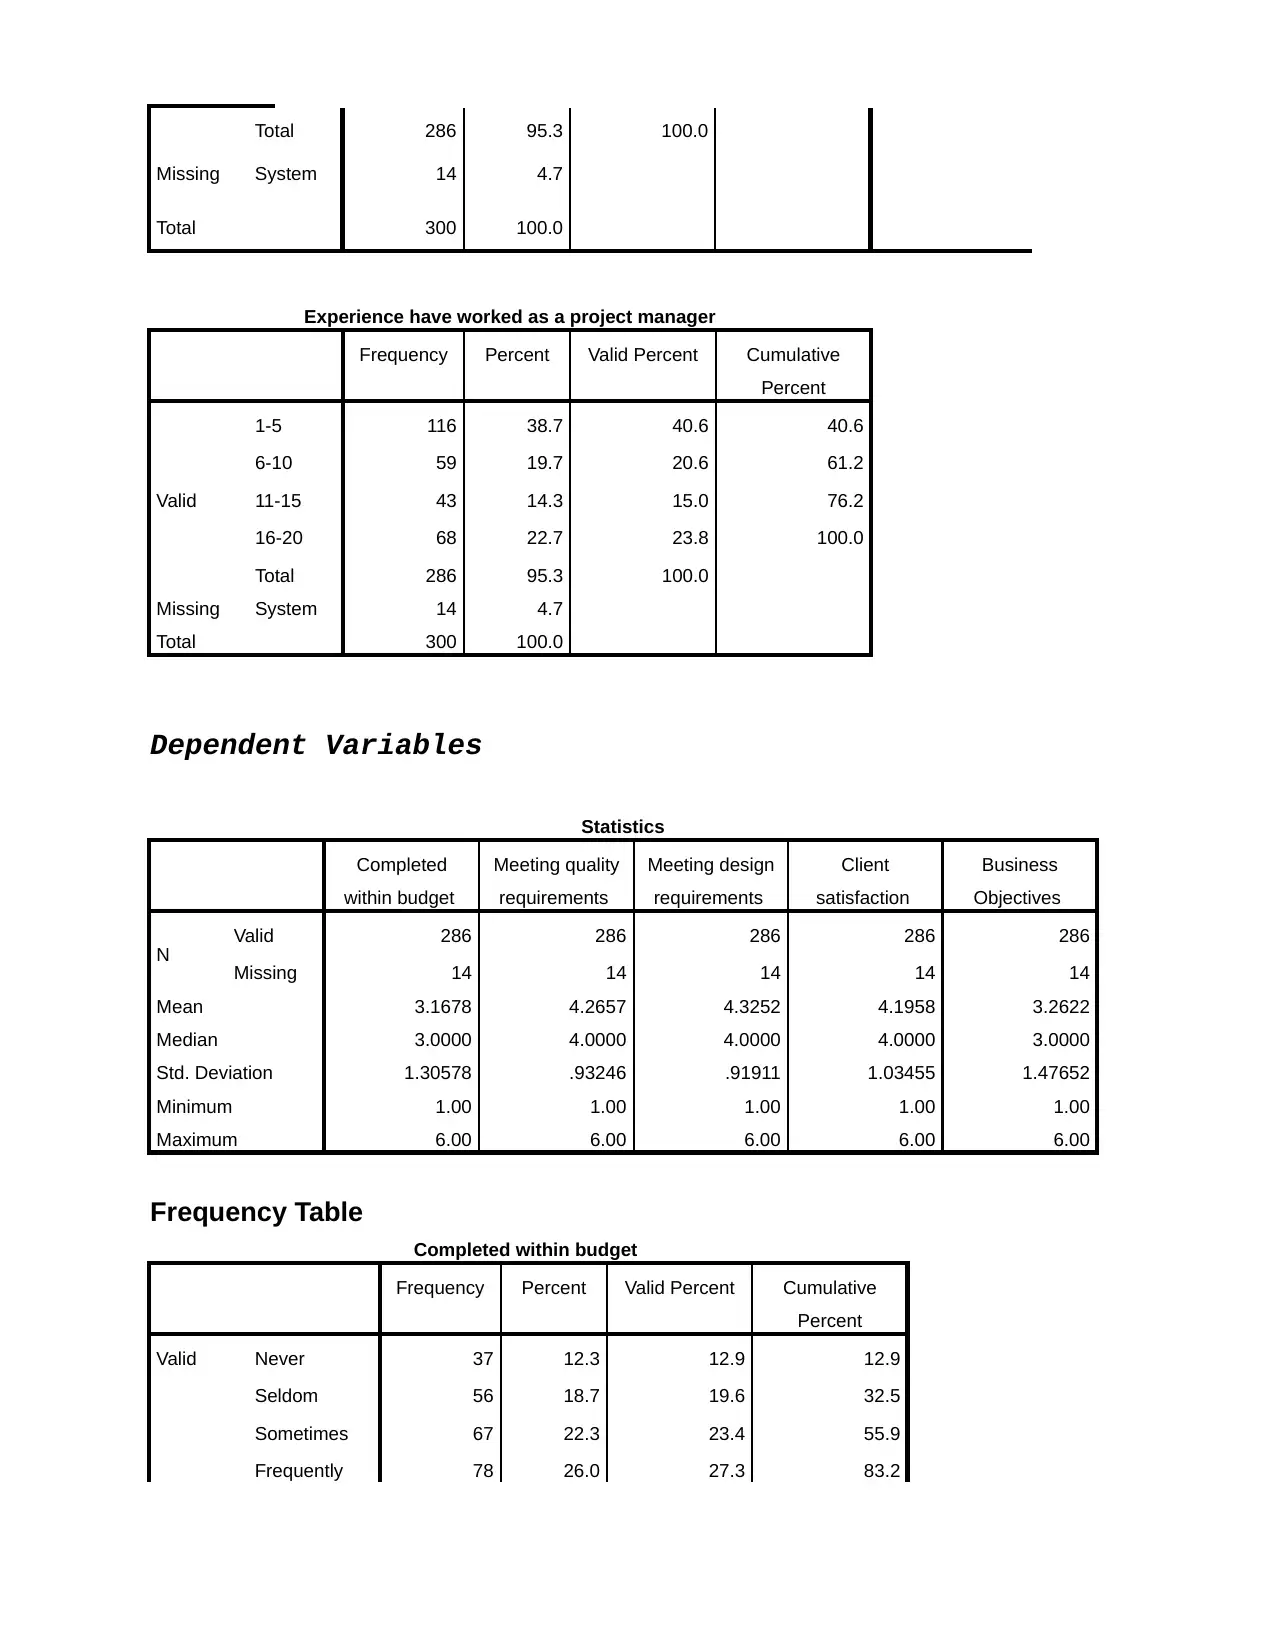
Experience have worked as a project manager
Frequency Percent Valid Percent Cumulative
Percent
Valid
1-5 116 38.7 40.6 40.6
6-10 59 19.7 20.6 61.2
11-15 43 14.3 15.0 76.2
16-20 68 22.7 23.8 100.0
Total 286 95.3 100.0
Missing System 14 4.7
Total 300 100.0
Dependent Variables
Statistics
Completed
within budget
Meeting quality
requirements
Meeting design
requirements
Client
satisfaction
Business
Objectives
N Valid 286 286 286 286 286
Missing 14 14 14 14 14
Mean 3.1678 4.2657 4.3252 4.1958 3.2622
Median 3.0000 4.0000 4.0000 4.0000 3.0000
Std. Deviation 1.30578 .93246 .91911 1.03455 1.47652
Minimum 1.00 1.00 1.00 1.00 1.00
Maximum 6.00 6.00 6.00 6.00 6.00
Frequency Table
Completed within budget
Frequency Percent Valid Percent Cumulative
Percent
Valid Never 37 12.3 12.9 12.9
Seldom 56 18.7 19.6 32.5
Sometimes 67 22.3 23.4 55.9
Frequently 78 26.0 27.3 83.2
Missing System 14 4.7
Total 300 100.0
Experience have worked as a project manager
Frequency Percent Valid Percent Cumulative
Percent
Valid
1-5 116 38.7 40.6 40.6
6-10 59 19.7 20.6 61.2
11-15 43 14.3 15.0 76.2
16-20 68 22.7 23.8 100.0
Total 286 95.3 100.0
Missing System 14 4.7
Total 300 100.0
Dependent Variables
Statistics
Completed
within budget
Meeting quality
requirements
Meeting design
requirements
Client
satisfaction
Business
Objectives
N Valid 286 286 286 286 286
Missing 14 14 14 14 14
Mean 3.1678 4.2657 4.3252 4.1958 3.2622
Median 3.0000 4.0000 4.0000 4.0000 3.0000
Std. Deviation 1.30578 .93246 .91911 1.03455 1.47652
Minimum 1.00 1.00 1.00 1.00 1.00
Maximum 6.00 6.00 6.00 6.00 6.00
Frequency Table
Completed within budget
Frequency Percent Valid Percent Cumulative
Percent
Valid Never 37 12.3 12.9 12.9
Seldom 56 18.7 19.6 32.5
Sometimes 67 22.3 23.4 55.9
Frequently 78 26.0 27.3 83.2
⊘ This is a preview!⊘
Do you want full access?
Subscribe today to unlock all pages.
Trusted by 1+ million students worldwide
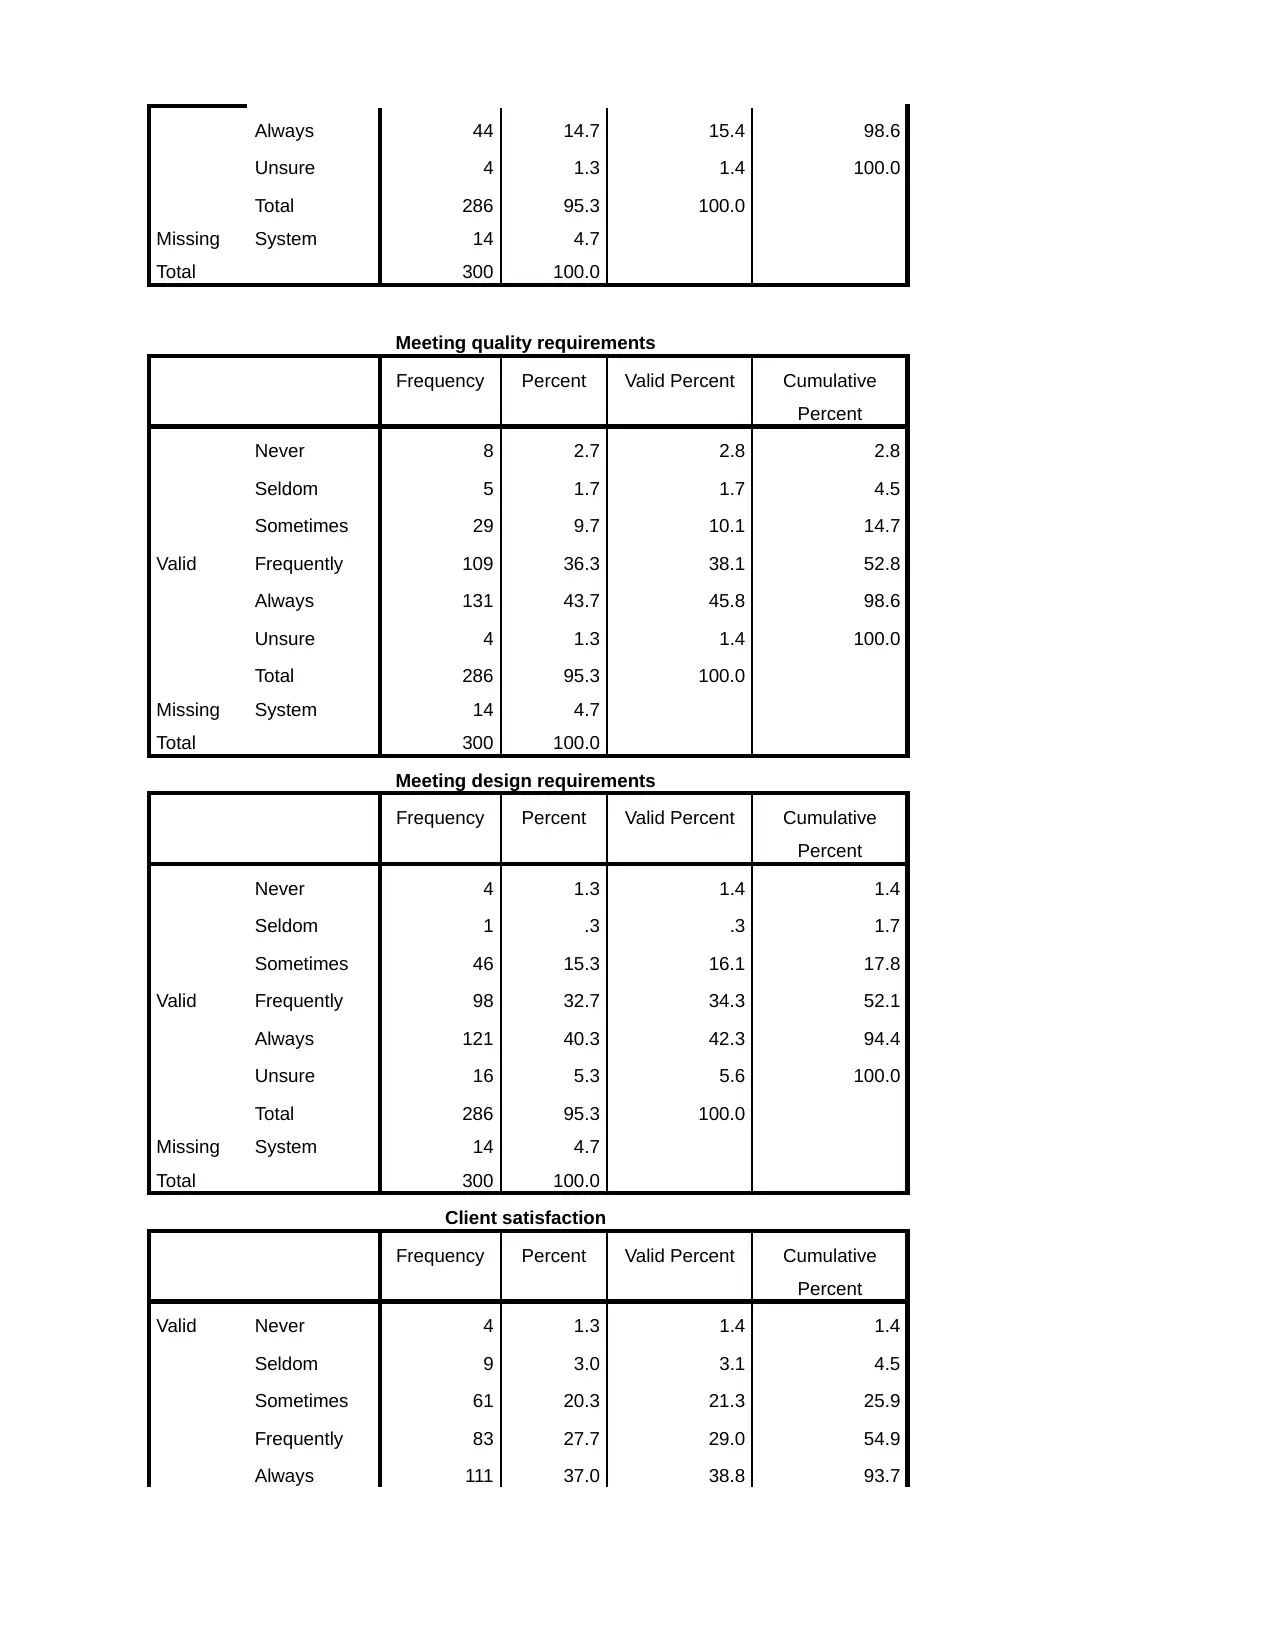
Always 44 14.7 15.4 98.6
Unsure 4 1.3 1.4 100.0
Total 286 95.3 100.0
Missing System 14 4.7
Total 300 100.0
Meeting quality requirements
Frequency Percent Valid Percent Cumulative
Percent
Valid
Never 8 2.7 2.8 2.8
Seldom 5 1.7 1.7 4.5
Sometimes 29 9.7 10.1 14.7
Frequently 109 36.3 38.1 52.8
Always 131 43.7 45.8 98.6
Unsure 4 1.3 1.4 100.0
Total 286 95.3 100.0
Missing System 14 4.7
Total 300 100.0
Meeting design requirements
Frequency Percent Valid Percent Cumulative
Percent
Valid
Never 4 1.3 1.4 1.4
Seldom 1 .3 .3 1.7
Sometimes 46 15.3 16.1 17.8
Frequently 98 32.7 34.3 52.1
Always 121 40.3 42.3 94.4
Unsure 16 5.3 5.6 100.0
Total 286 95.3 100.0
Missing System 14 4.7
Total 300 100.0
Client satisfaction
Frequency Percent Valid Percent Cumulative
Percent
Valid Never 4 1.3 1.4 1.4
Seldom 9 3.0 3.1 4.5
Sometimes 61 20.3 21.3 25.9
Frequently 83 27.7 29.0 54.9
Always 111 37.0 38.8 93.7
Unsure 4 1.3 1.4 100.0
Total 286 95.3 100.0
Missing System 14 4.7
Total 300 100.0
Meeting quality requirements
Frequency Percent Valid Percent Cumulative
Percent
Valid
Never 8 2.7 2.8 2.8
Seldom 5 1.7 1.7 4.5
Sometimes 29 9.7 10.1 14.7
Frequently 109 36.3 38.1 52.8
Always 131 43.7 45.8 98.6
Unsure 4 1.3 1.4 100.0
Total 286 95.3 100.0
Missing System 14 4.7
Total 300 100.0
Meeting design requirements
Frequency Percent Valid Percent Cumulative
Percent
Valid
Never 4 1.3 1.4 1.4
Seldom 1 .3 .3 1.7
Sometimes 46 15.3 16.1 17.8
Frequently 98 32.7 34.3 52.1
Always 121 40.3 42.3 94.4
Unsure 16 5.3 5.6 100.0
Total 286 95.3 100.0
Missing System 14 4.7
Total 300 100.0
Client satisfaction
Frequency Percent Valid Percent Cumulative
Percent
Valid Never 4 1.3 1.4 1.4
Seldom 9 3.0 3.1 4.5
Sometimes 61 20.3 21.3 25.9
Frequently 83 27.7 29.0 54.9
Always 111 37.0 38.8 93.7
Paraphrase This Document
Need a fresh take? Get an instant paraphrase of this document with our AI Paraphraser
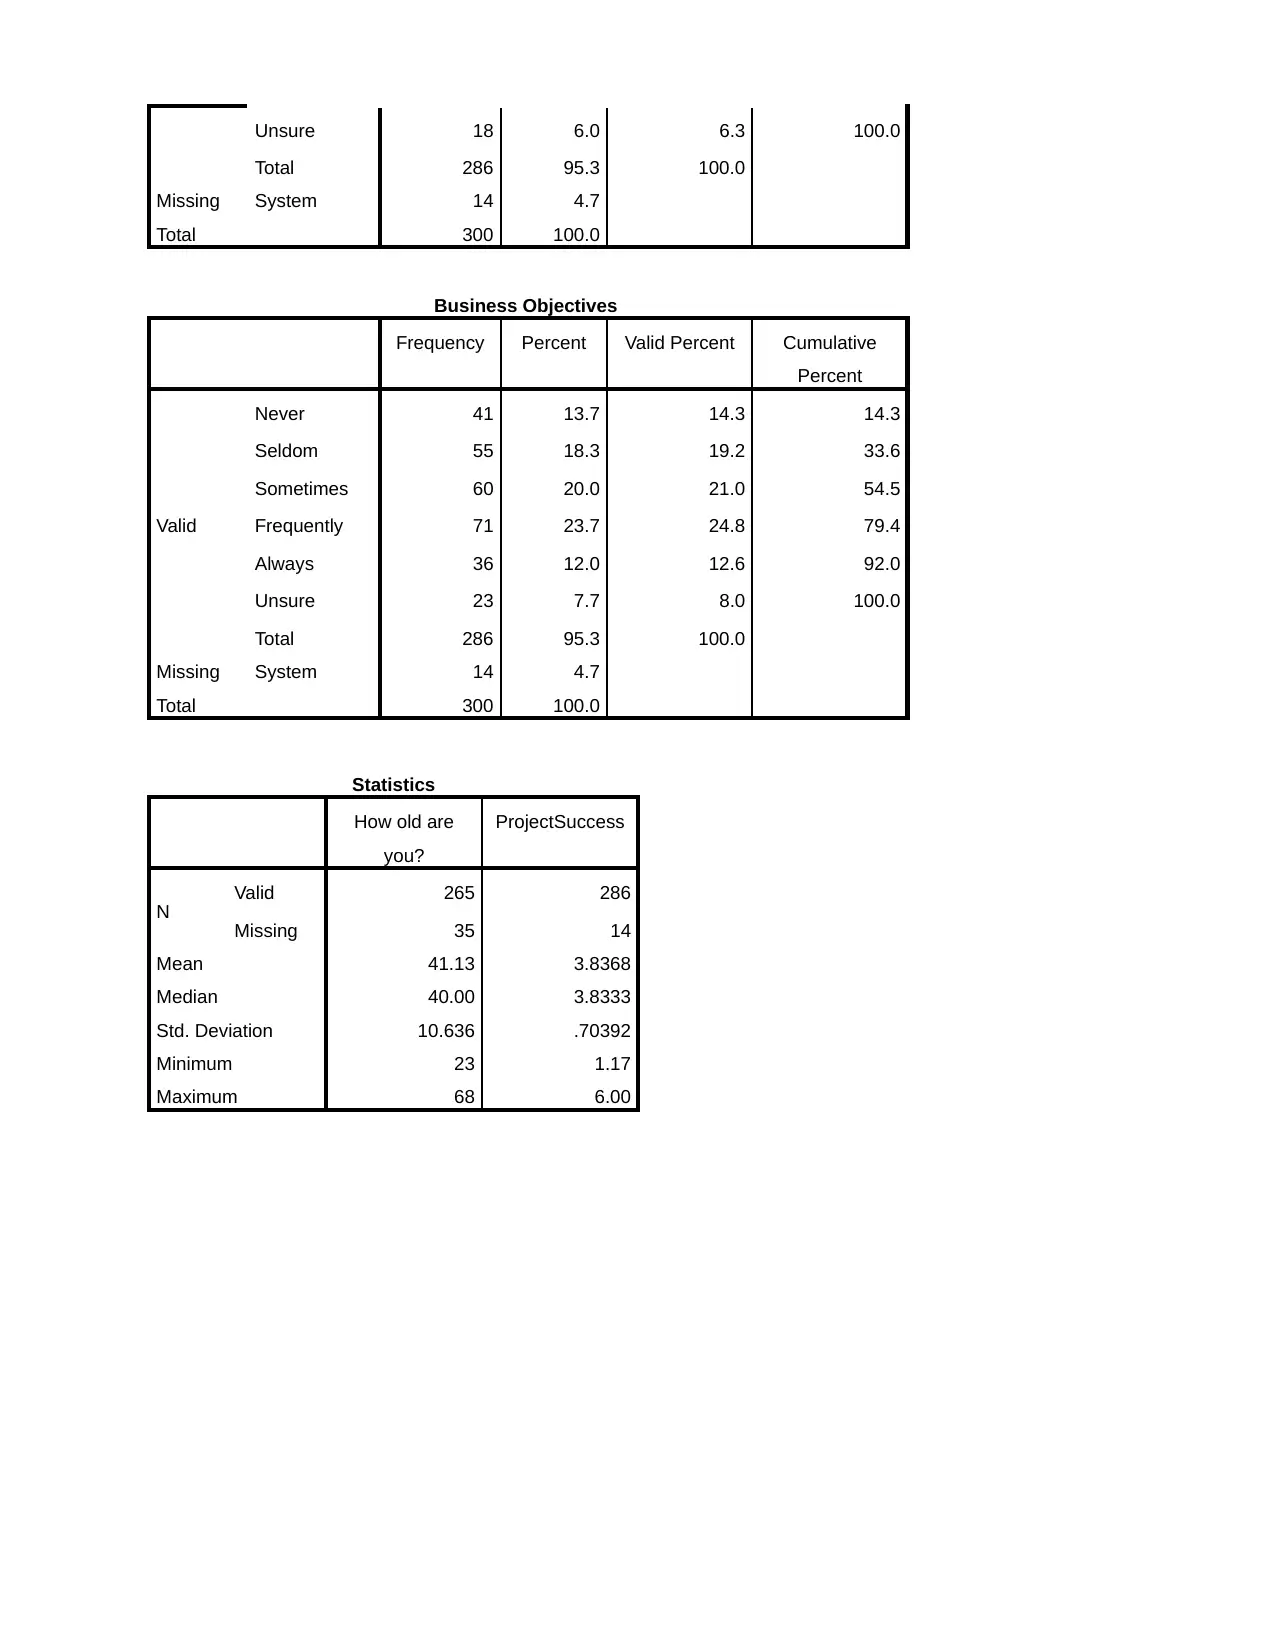
Unsure 18 6.0 6.3 100.0
Total 286 95.3 100.0
Missing System 14 4.7
Total 300 100.0
Business Objectives
Frequency Percent Valid Percent Cumulative
Percent
Valid
Never 41 13.7 14.3 14.3
Seldom 55 18.3 19.2 33.6
Sometimes 60 20.0 21.0 54.5
Frequently 71 23.7 24.8 79.4
Always 36 12.0 12.6 92.0
Unsure 23 7.7 8.0 100.0
Total 286 95.3 100.0
Missing System 14 4.7
Total 300 100.0
Statistics
How old are
you?
ProjectSuccess
N Valid 265 286
Missing 35 14
Mean 41.13 3.8368
Median 40.00 3.8333
Std. Deviation 10.636 .70392
Minimum 23 1.17
Maximum 68 6.00
Total 286 95.3 100.0
Missing System 14 4.7
Total 300 100.0
Business Objectives
Frequency Percent Valid Percent Cumulative
Percent
Valid
Never 41 13.7 14.3 14.3
Seldom 55 18.3 19.2 33.6
Sometimes 60 20.0 21.0 54.5
Frequently 71 23.7 24.8 79.4
Always 36 12.0 12.6 92.0
Unsure 23 7.7 8.0 100.0
Total 286 95.3 100.0
Missing System 14 4.7
Total 300 100.0
Statistics
How old are
you?
ProjectSuccess
N Valid 265 286
Missing 35 14
Mean 41.13 3.8368
Median 40.00 3.8333
Std. Deviation 10.636 .70392
Minimum 23 1.17
Maximum 68 6.00
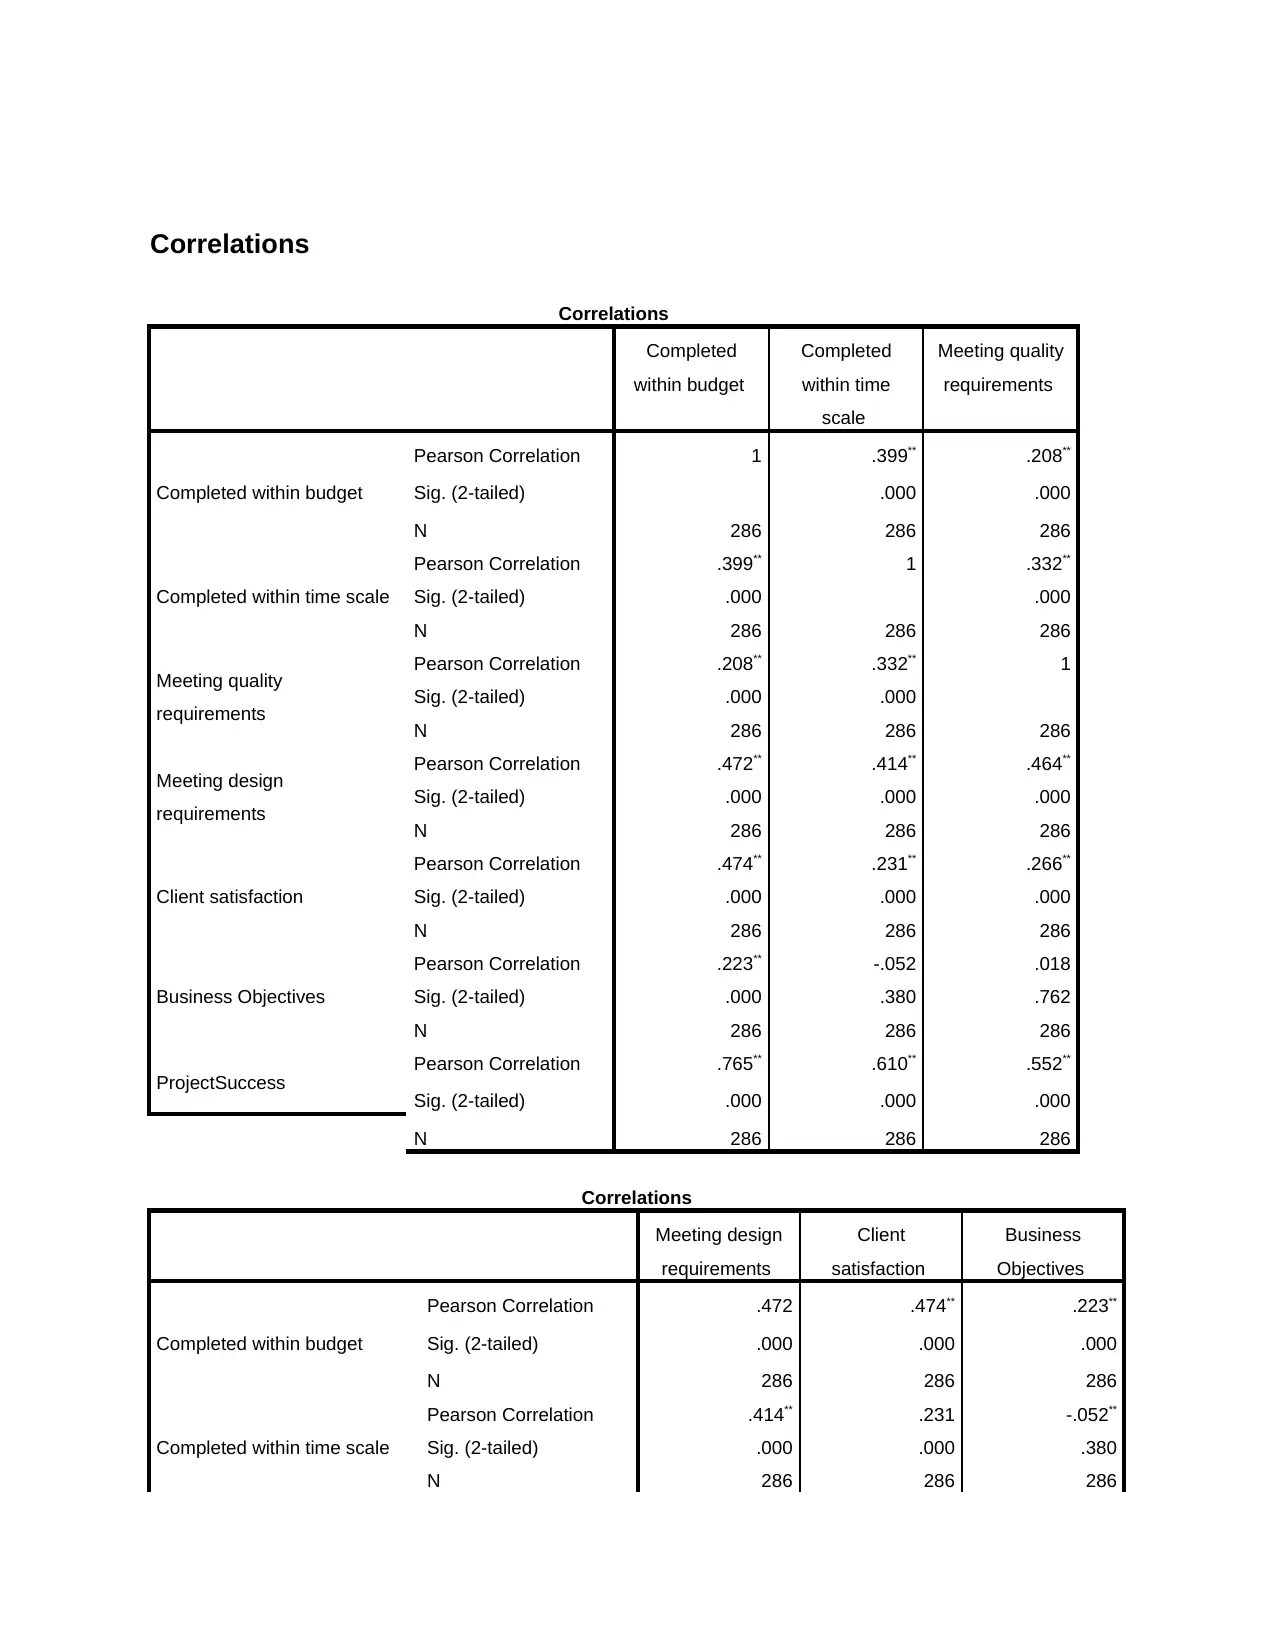
Correlations
Correlations
Completed
within budget
Completed
within time
scale
Meeting quality
requirements
Completed within budget
Pearson Correlation 1 .399** .208**
Sig. (2-tailed) .000 .000
N 286 286 286
Completed within time scale
Pearson Correlation .399** 1 .332**
Sig. (2-tailed) .000 .000
N 286 286 286
Meeting quality
requirements
Pearson Correlation .208** .332** 1
Sig. (2-tailed) .000 .000
N 286 286 286
Meeting design
requirements
Pearson Correlation .472** .414** .464**
Sig. (2-tailed) .000 .000 .000
N 286 286 286
Client satisfaction
Pearson Correlation .474** .231** .266**
Sig. (2-tailed) .000 .000 .000
N 286 286 286
Business Objectives
Pearson Correlation .223** -.052 .018
Sig. (2-tailed) .000 .380 .762
N 286 286 286
ProjectSuccess Pearson Correlation .765** .610** .552**
Sig. (2-tailed) .000 .000 .000
N 286 286 286
Correlations
Meeting design
requirements
Client
satisfaction
Business
Objectives
Completed within budget
Pearson Correlation .472 .474** .223**
Sig. (2-tailed) .000 .000 .000
N 286 286 286
Completed within time scale
Pearson Correlation .414** .231 -.052**
Sig. (2-tailed) .000 .000 .380
N 286 286 286
Correlations
Completed
within budget
Completed
within time
scale
Meeting quality
requirements
Completed within budget
Pearson Correlation 1 .399** .208**
Sig. (2-tailed) .000 .000
N 286 286 286
Completed within time scale
Pearson Correlation .399** 1 .332**
Sig. (2-tailed) .000 .000
N 286 286 286
Meeting quality
requirements
Pearson Correlation .208** .332** 1
Sig. (2-tailed) .000 .000
N 286 286 286
Meeting design
requirements
Pearson Correlation .472** .414** .464**
Sig. (2-tailed) .000 .000 .000
N 286 286 286
Client satisfaction
Pearson Correlation .474** .231** .266**
Sig. (2-tailed) .000 .000 .000
N 286 286 286
Business Objectives
Pearson Correlation .223** -.052 .018
Sig. (2-tailed) .000 .380 .762
N 286 286 286
ProjectSuccess Pearson Correlation .765** .610** .552**
Sig. (2-tailed) .000 .000 .000
N 286 286 286
Correlations
Meeting design
requirements
Client
satisfaction
Business
Objectives
Completed within budget
Pearson Correlation .472 .474** .223**
Sig. (2-tailed) .000 .000 .000
N 286 286 286
Completed within time scale
Pearson Correlation .414** .231 -.052**
Sig. (2-tailed) .000 .000 .380
N 286 286 286
⊘ This is a preview!⊘
Do you want full access?
Subscribe today to unlock all pages.
Trusted by 1+ million students worldwide
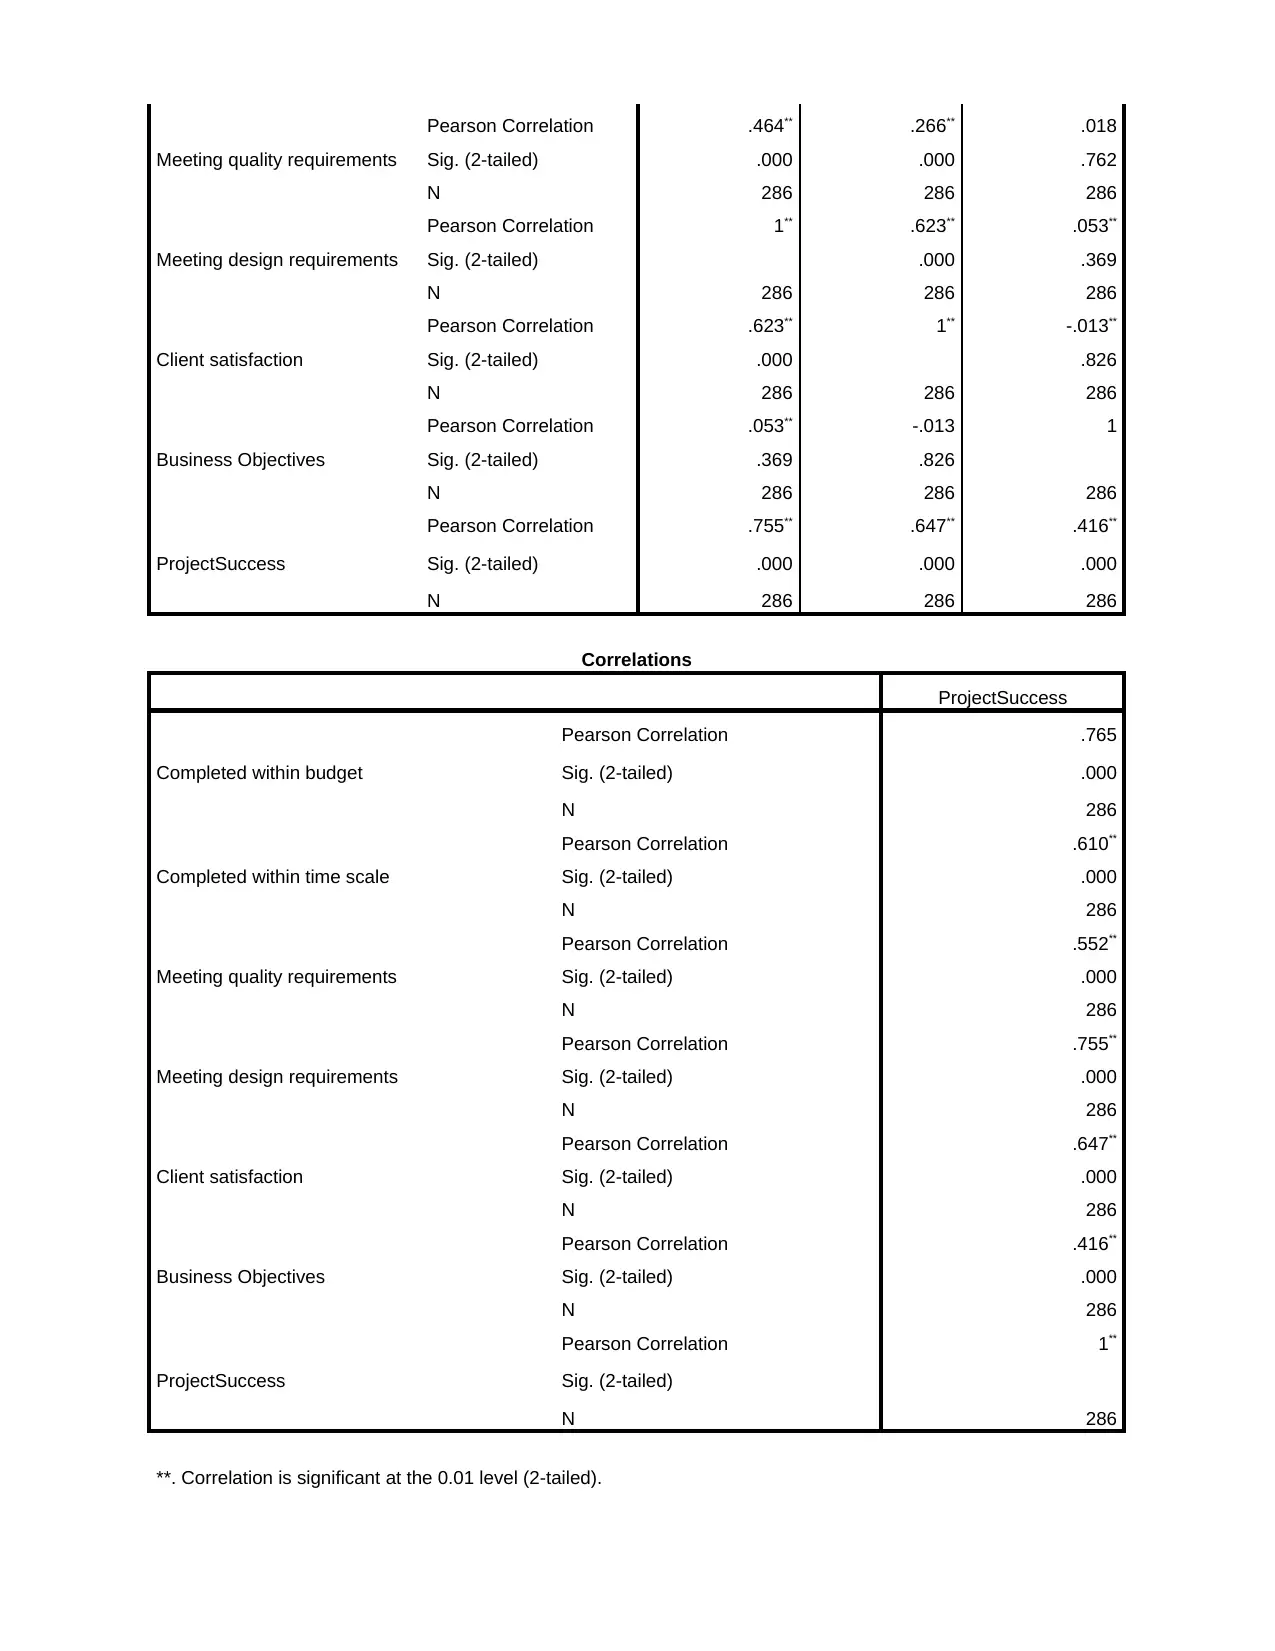
Meeting quality requirements
Pearson Correlation .464** .266** .018
Sig. (2-tailed) .000 .000 .762
N 286 286 286
Meeting design requirements
Pearson Correlation 1** .623** .053**
Sig. (2-tailed) .000 .369
N 286 286 286
Client satisfaction
Pearson Correlation .623** 1** -.013**
Sig. (2-tailed) .000 .826
N 286 286 286
Business Objectives
Pearson Correlation .053** -.013 1
Sig. (2-tailed) .369 .826
N 286 286 286
ProjectSuccess
Pearson Correlation .755** .647** .416**
Sig. (2-tailed) .000 .000 .000
N 286 286 286
Correlations
ProjectSuccess
Completed within budget
Pearson Correlation .765
Sig. (2-tailed) .000
N 286
Completed within time scale
Pearson Correlation .610**
Sig. (2-tailed) .000
N 286
Meeting quality requirements
Pearson Correlation .552**
Sig. (2-tailed) .000
N 286
Meeting design requirements
Pearson Correlation .755**
Sig. (2-tailed) .000
N 286
Client satisfaction
Pearson Correlation .647**
Sig. (2-tailed) .000
N 286
Business Objectives
Pearson Correlation .416**
Sig. (2-tailed) .000
N 286
ProjectSuccess
Pearson Correlation 1**
Sig. (2-tailed)
N 286
**. Correlation is significant at the 0.01 level (2-tailed).
Paraphrase This Document
Need a fresh take? Get an instant paraphrase of this document with our AI Paraphraser
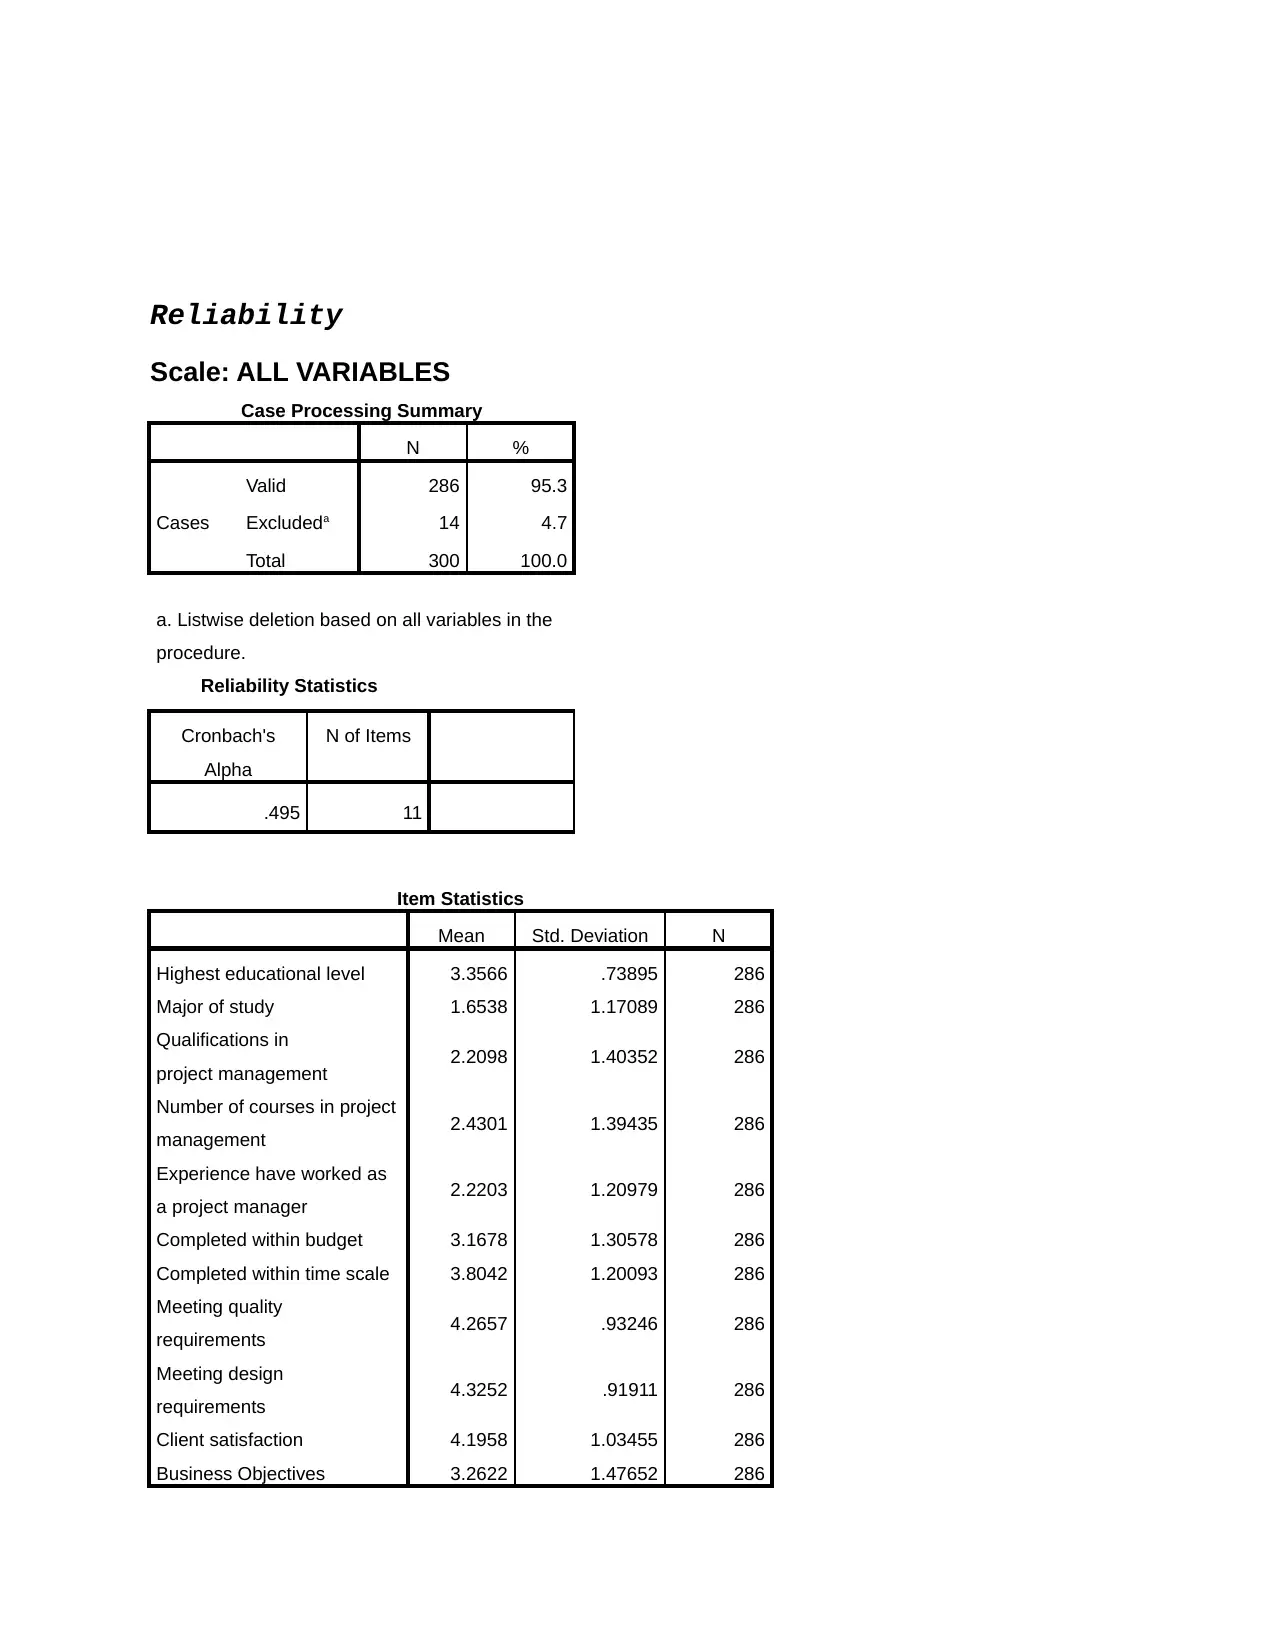
Reliability
Scale: ALL VARIABLES
Case Processing Summary
N %
Cases
Valid 286 95.3
Excludeda 14 4.7
Total 300 100.0
a. Listwise deletion based on all variables in the
procedure.
Reliability Statistics
Cronbach's
Alpha
N of Items
.495 11
Item Statistics
Mean Std. Deviation N
Highest educational level 3.3566 .73895 286
Major of study 1.6538 1.17089 286
Qualifications in
project management 2.2098 1.40352 286
Number of courses in project
management 2.4301 1.39435 286
Experience have worked as
a project manager 2.2203 1.20979 286
Completed within budget 3.1678 1.30578 286
Completed within time scale 3.8042 1.20093 286
Meeting quality
requirements 4.2657 .93246 286
Meeting design
requirements 4.3252 .91911 286
Client satisfaction 4.1958 1.03455 286
Business Objectives 3.2622 1.47652 286
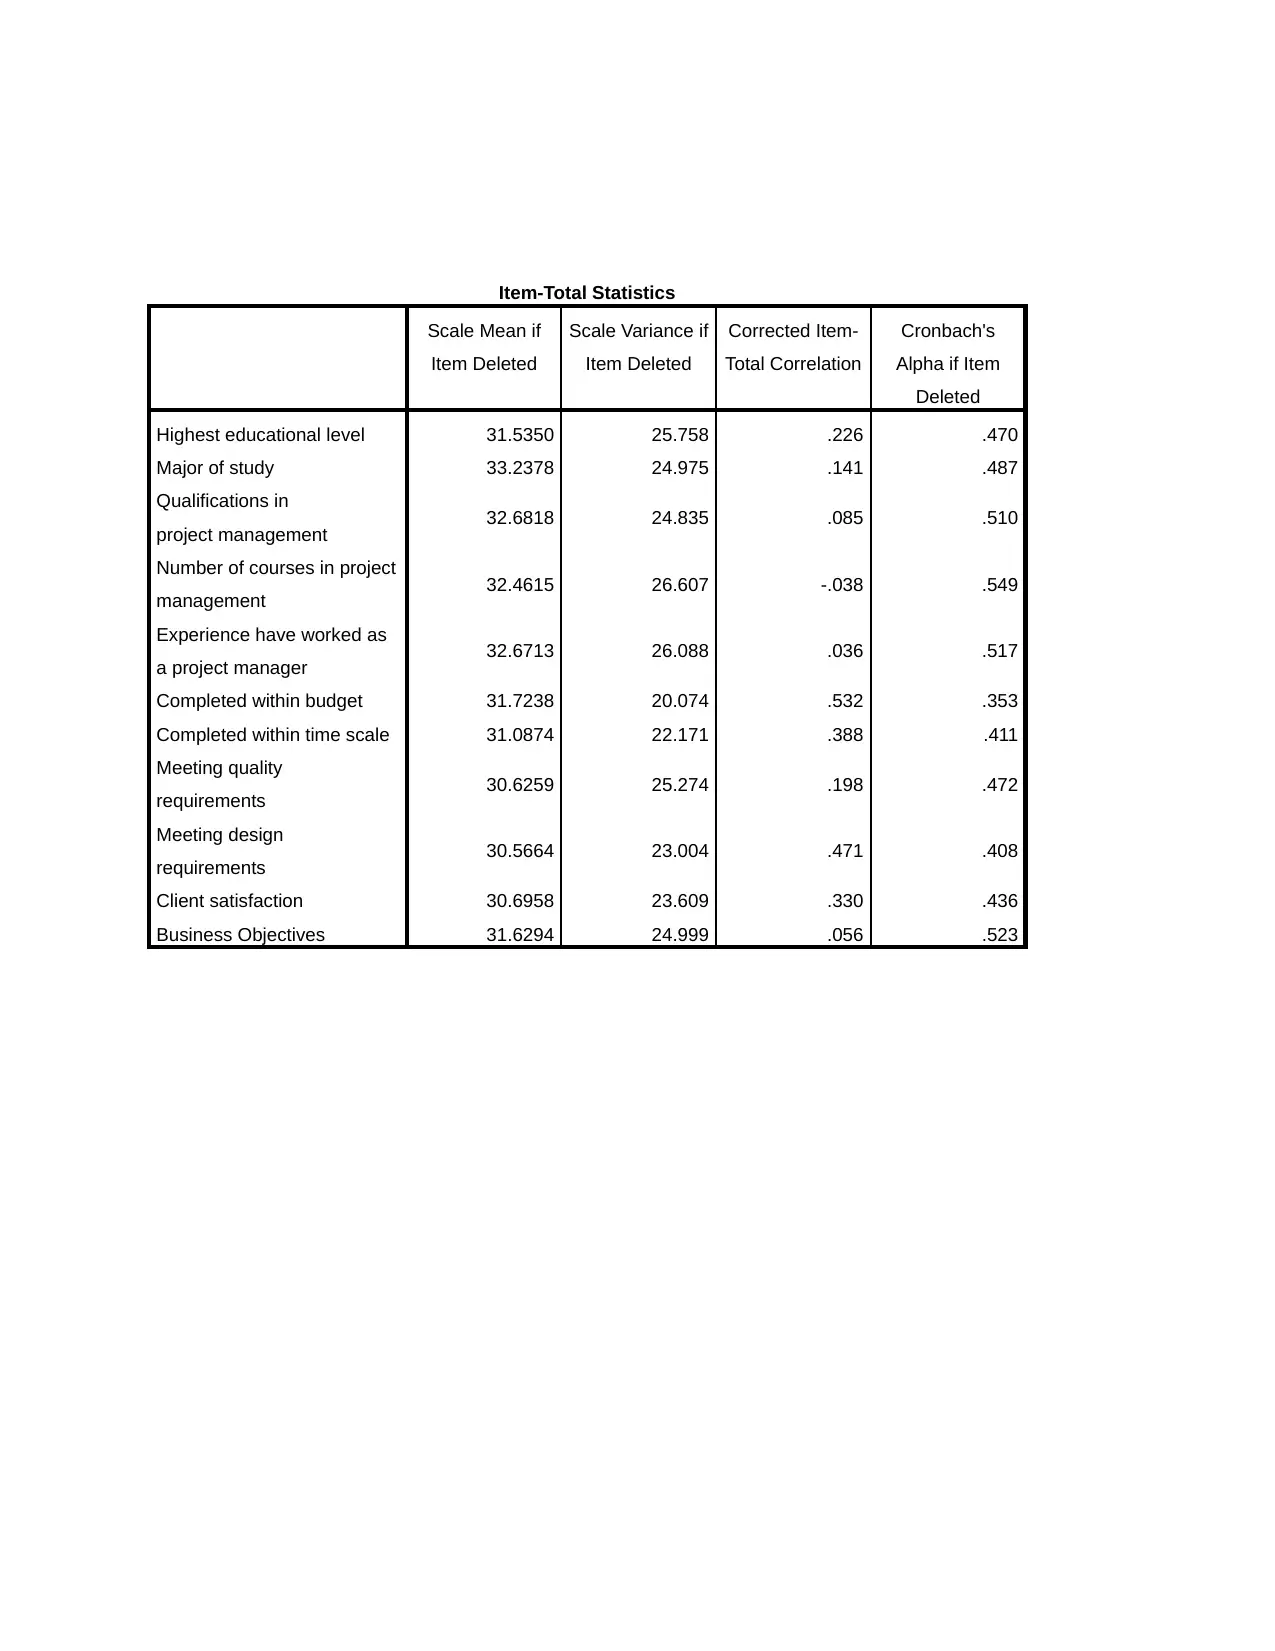
Item-Total Statistics
Scale Mean if
Item Deleted
Scale Variance if
Item Deleted
Corrected Item-
Total Correlation
Cronbach's
Alpha if Item
Deleted
Highest educational level 31.5350 25.758 .226 .470
Major of study 33.2378 24.975 .141 .487
Qualifications in
project management 32.6818 24.835 .085 .510
Number of courses in project
management 32.4615 26.607 -.038 .549
Experience have worked as
a project manager 32.6713 26.088 .036 .517
Completed within budget 31.7238 20.074 .532 .353
Completed within time scale 31.0874 22.171 .388 .411
Meeting quality
requirements 30.6259 25.274 .198 .472
Meeting design
requirements 30.5664 23.004 .471 .408
Client satisfaction 30.6958 23.609 .330 .436
Business Objectives 31.6294 24.999 .056 .523
⊘ This is a preview!⊘
Do you want full access?
Subscribe today to unlock all pages.
Trusted by 1+ million students worldwide
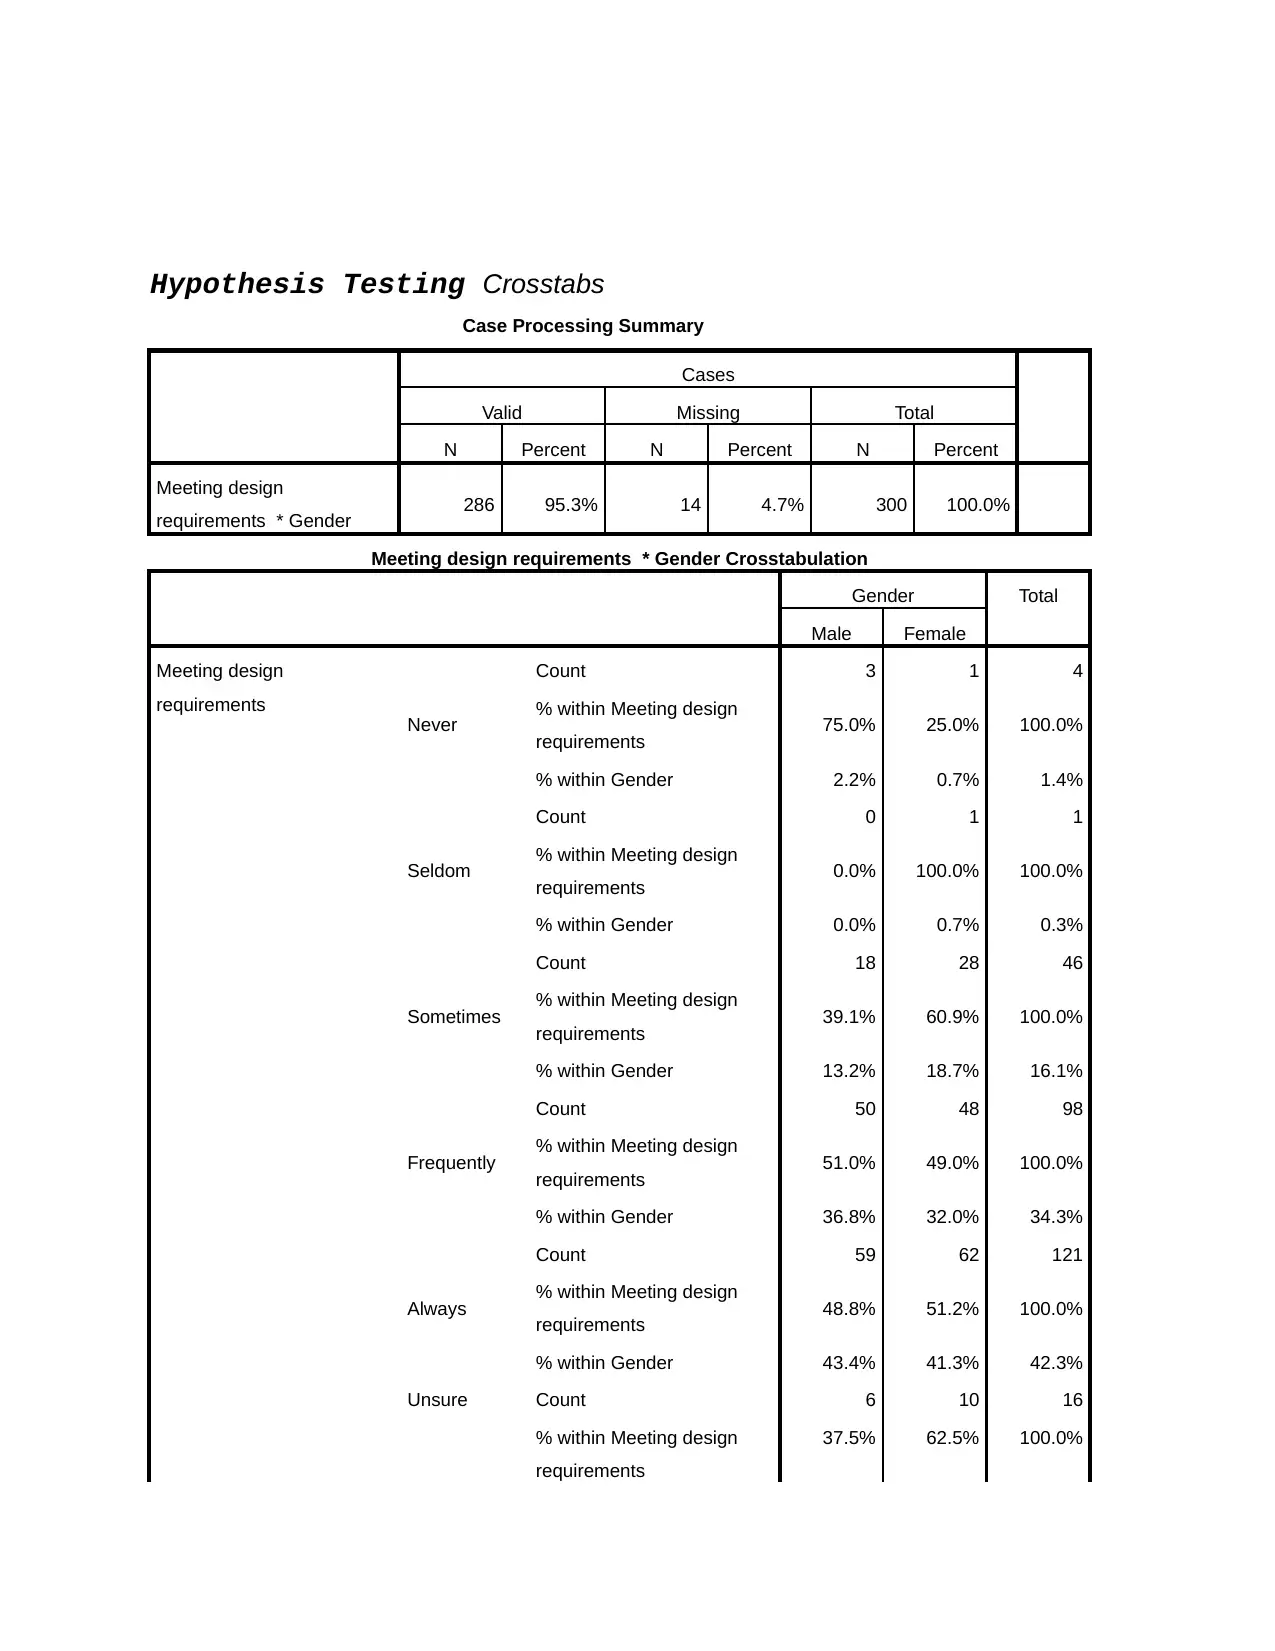
Hypothesis Testing Crosstabs
Case Processing Summary
Cases
Valid Missing Total
N Percent N Percent N Percent
Meeting design
requirements * Gender 286 95.3% 14 4.7% 300 100.0%
Meeting design requirements * Gender Crosstabulation
Gender Total
Male Female
Meeting design
requirements
Never
Count 3 1 4
% within Meeting design
requirements 75.0% 25.0% 100.0%
% within Gender 2.2% 0.7% 1.4%
Seldom
Count 0 1 1
% within Meeting design
requirements 0.0% 100.0% 100.0%
% within Gender 0.0% 0.7% 0.3%
Sometimes
Count 18 28 46
% within Meeting design
requirements 39.1% 60.9% 100.0%
% within Gender 13.2% 18.7% 16.1%
Frequently
Count 50 48 98
% within Meeting design
requirements 51.0% 49.0% 100.0%
% within Gender 36.8% 32.0% 34.3%
Always
Count 59 62 121
% within Meeting design
requirements 48.8% 51.2% 100.0%
% within Gender 43.4% 41.3% 42.3%
Unsure Count 6 10 16
% within Meeting design
requirements
37.5% 62.5% 100.0%
Paraphrase This Document
Need a fresh take? Get an instant paraphrase of this document with our AI Paraphraser
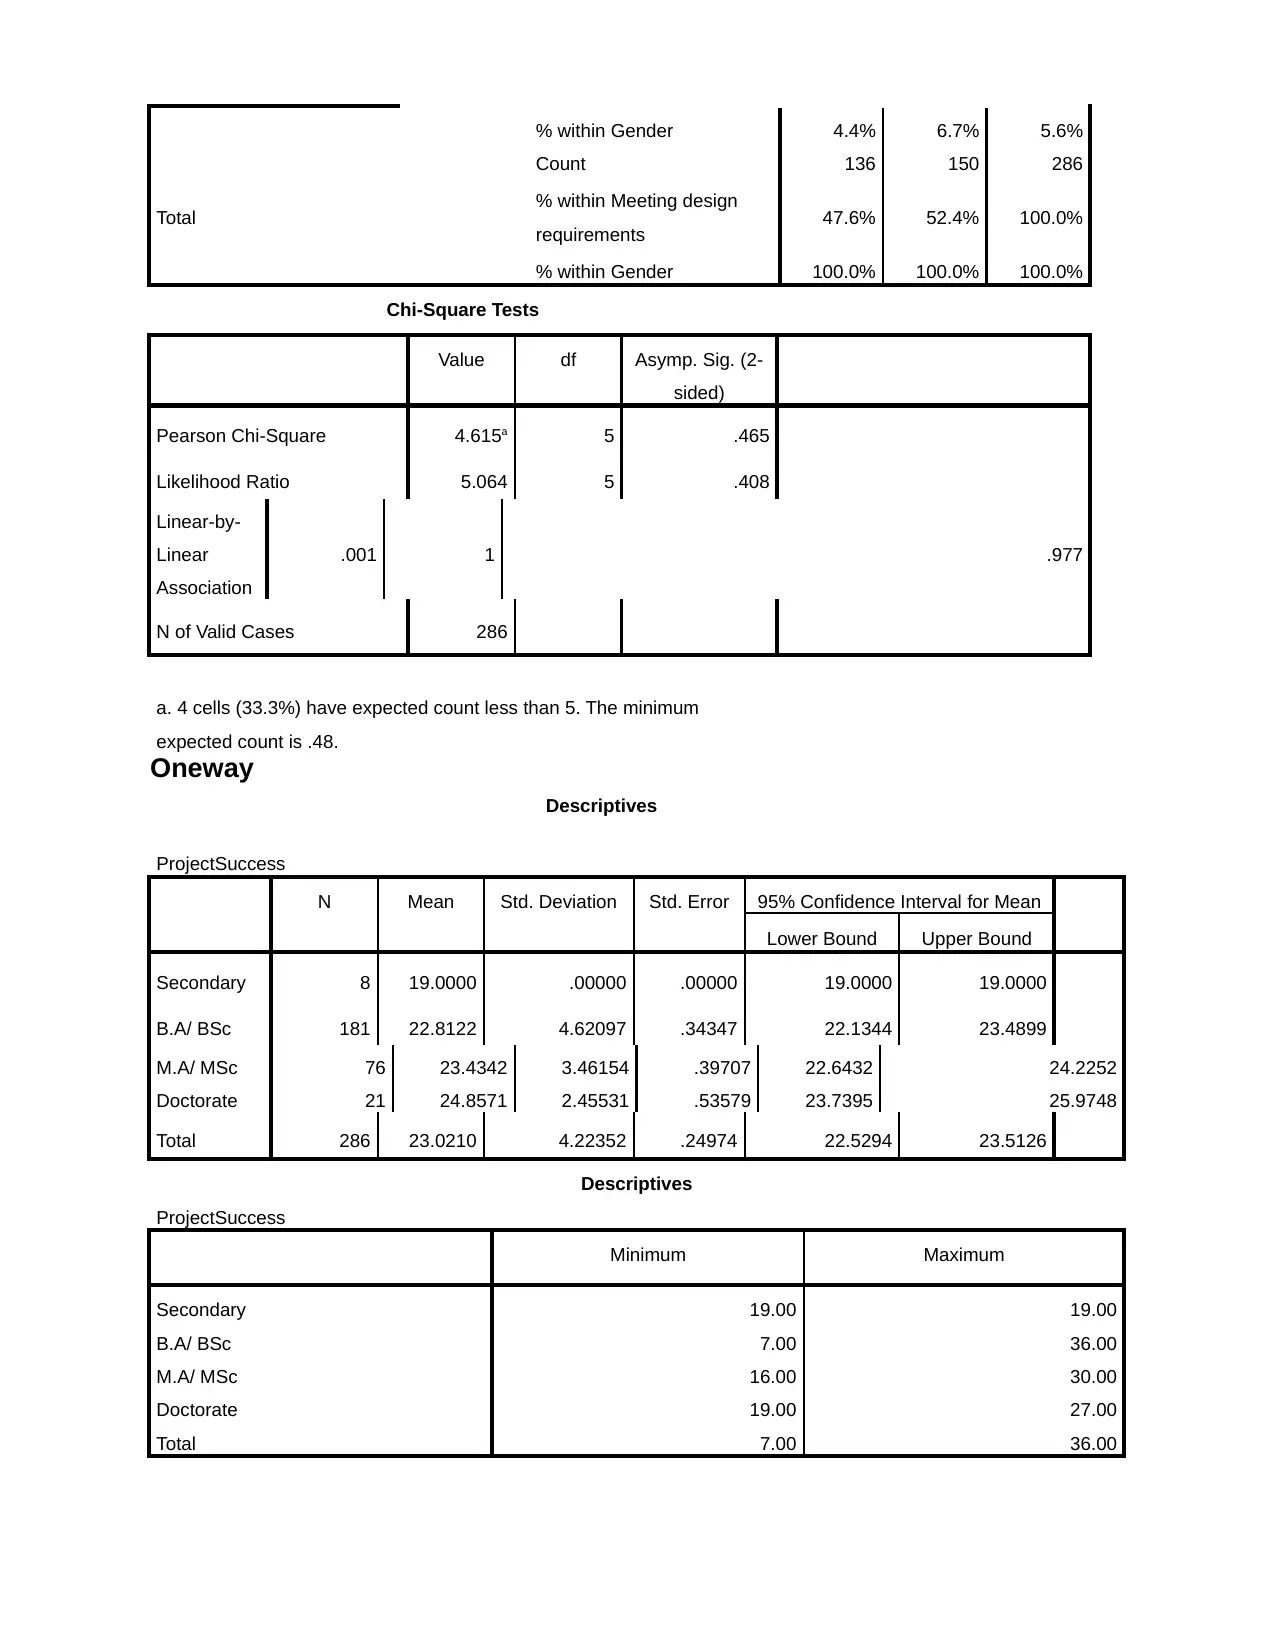
% within Gender 4.4% 6.7% 5.6%
Total
Count 136 150 286
% within Meeting design
requirements 47.6% 52.4% 100.0%
% within Gender 100.0% 100.0% 100.0%
Chi-Square Tests
Value df Asymp. Sig. (2-
sided)
Pearson Chi-Square 4.615a 5 .465
Likelihood Ratio 5.064 5 .408
Linear-by-
Linear
Association
.001 1 .977
N of Valid Cases 286
a. 4 cells (33.3%) have expected count less than 5. The minimum
expected count is .48.
Oneway
Descriptives
ProjectSuccess
N Mean Std. Deviation Std. Error 95% Confidence Interval for Mean
Lower Bound Upper Bound
Secondary 8 19.0000 .00000 .00000 19.0000 19.0000
B.A/ BSc 181 22.8122 4.62097 .34347 22.1344 23.4899
M.A/ MSc 76 23.4342 3.46154 .39707 22.6432 24.2252
Doctorate 21 24.8571 2.45531 .53579 23.7395 25.9748
Total 286 23.0210 4.22352 .24974 22.5294 23.5126
Descriptives
ProjectSuccess
Minimum Maximum
Secondary 19.00 19.00
B.A/ BSc 7.00 36.00
M.A/ MSc 16.00 30.00
Doctorate 19.00 27.00
Total 7.00 36.00
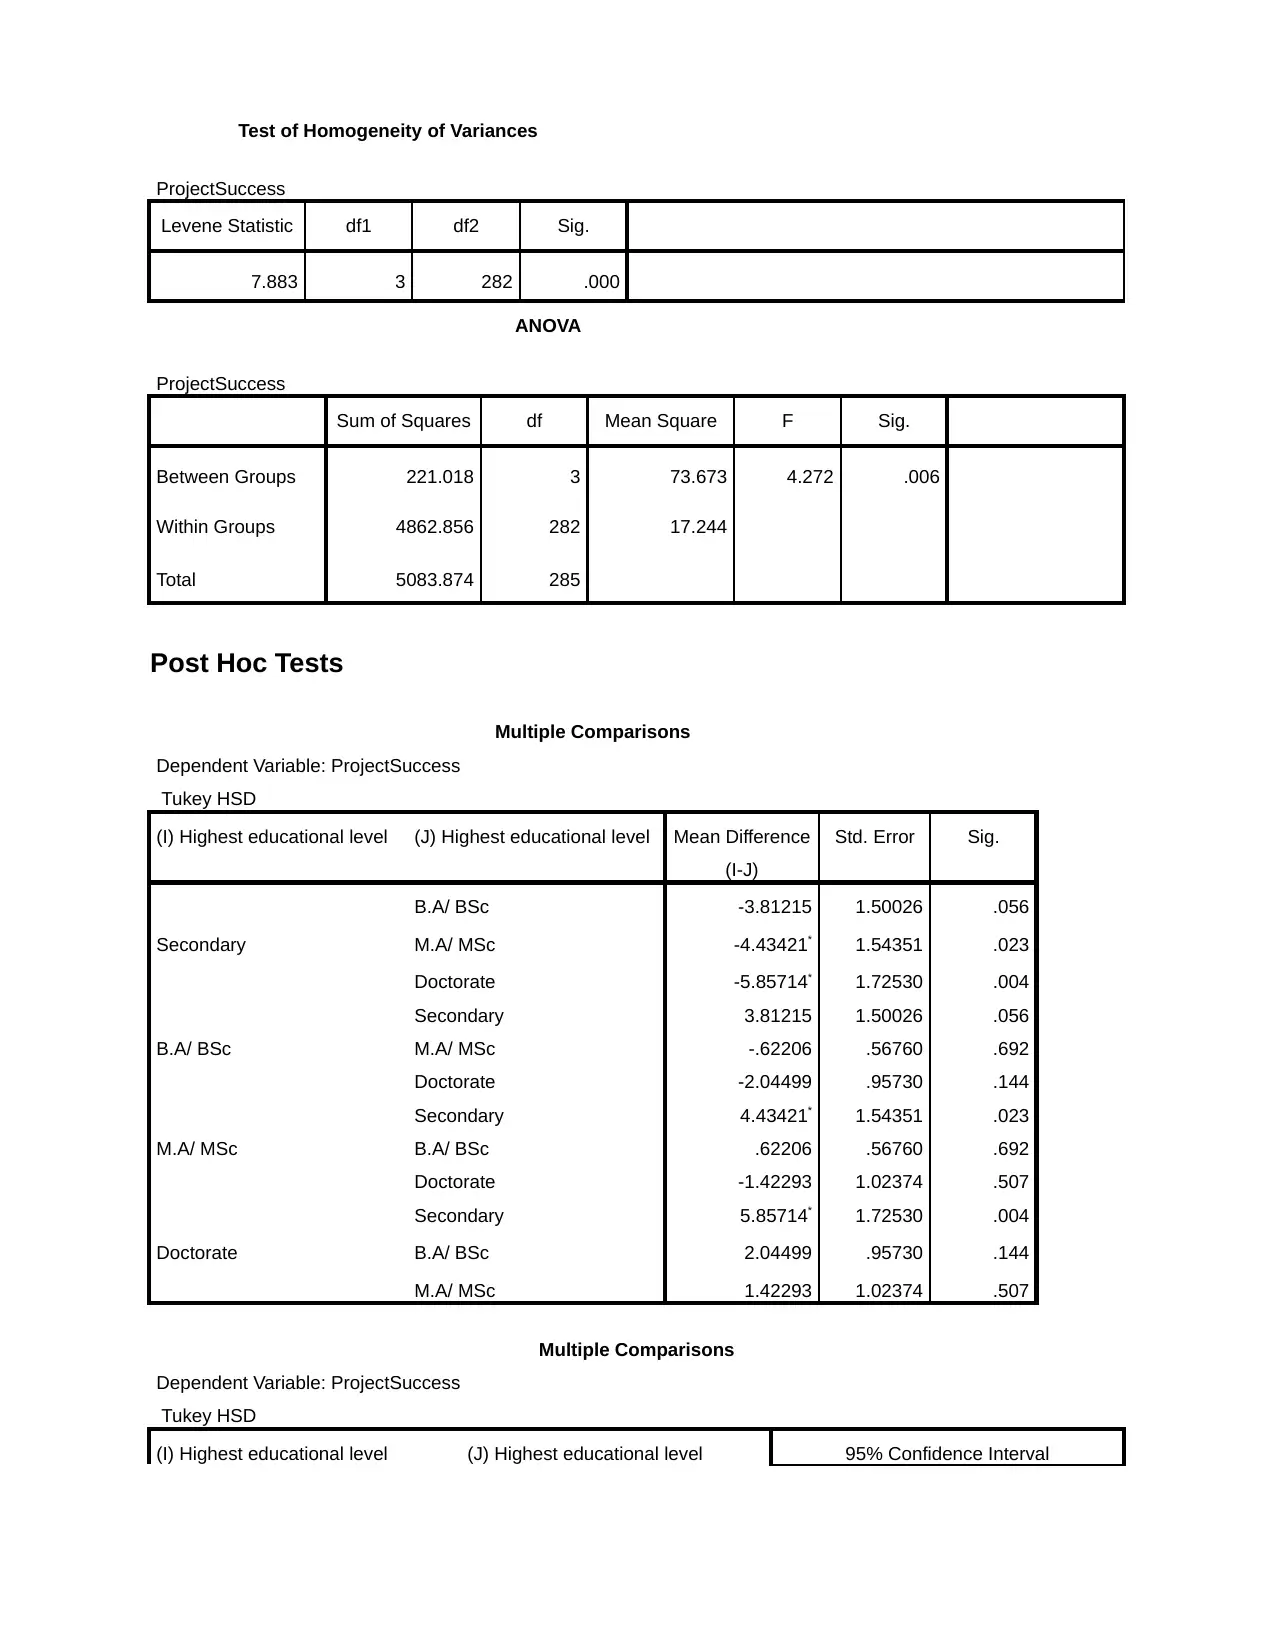
Test of Homogeneity of Variances
ProjectSuccess
Levene Statistic df1 df2 Sig.
7.883 3 282 .000
ANOVA
ProjectSuccess
Sum of Squares df Mean Square F Sig.
Between Groups 221.018 3 73.673 4.272 .006
Within Groups 4862.856 282 17.244
Total 5083.874 285
Post Hoc Tests
Multiple Comparisons
Dependent Variable: ProjectSuccess
Tukey HSD
(I) Highest educational level (J) Highest educational level Mean Difference
(I-J)
Std. Error Sig.
Secondary
B.A/ BSc -3.81215 1.50026 .056
M.A/ MSc -4.43421* 1.54351 .023
Doctorate -5.85714* 1.72530 .004
B.A/ BSc
Secondary 3.81215 1.50026 .056
M.A/ MSc -.62206 .56760 .692
Doctorate -2.04499 .95730 .144
M.A/ MSc
Secondary 4.43421* 1.54351 .023
B.A/ BSc .62206 .56760 .692
Doctorate -1.42293 1.02374 .507
Doctorate
Secondary 5.85714* 1.72530 .004
B.A/ BSc 2.04499 .95730 .144
M.A/ MSc 1.42293 1.02374 .507
Multiple Comparisons
Dependent Variable: ProjectSuccess
Tukey HSD
(I) Highest educational level (J) Highest educational level 95% Confidence Interval
ProjectSuccess
Levene Statistic df1 df2 Sig.
7.883 3 282 .000
ANOVA
ProjectSuccess
Sum of Squares df Mean Square F Sig.
Between Groups 221.018 3 73.673 4.272 .006
Within Groups 4862.856 282 17.244
Total 5083.874 285
Post Hoc Tests
Multiple Comparisons
Dependent Variable: ProjectSuccess
Tukey HSD
(I) Highest educational level (J) Highest educational level Mean Difference
(I-J)
Std. Error Sig.
Secondary
B.A/ BSc -3.81215 1.50026 .056
M.A/ MSc -4.43421* 1.54351 .023
Doctorate -5.85714* 1.72530 .004
B.A/ BSc
Secondary 3.81215 1.50026 .056
M.A/ MSc -.62206 .56760 .692
Doctorate -2.04499 .95730 .144
M.A/ MSc
Secondary 4.43421* 1.54351 .023
B.A/ BSc .62206 .56760 .692
Doctorate -1.42293 1.02374 .507
Doctorate
Secondary 5.85714* 1.72530 .004
B.A/ BSc 2.04499 .95730 .144
M.A/ MSc 1.42293 1.02374 .507
Multiple Comparisons
Dependent Variable: ProjectSuccess
Tukey HSD
(I) Highest educational level (J) Highest educational level 95% Confidence Interval
⊘ This is a preview!⊘
Do you want full access?
Subscribe today to unlock all pages.
Trusted by 1+ million students worldwide
1 out of 22
Your All-in-One AI-Powered Toolkit for Academic Success.
+13062052269
info@desklib.com
Available 24*7 on WhatsApp / Email
![[object Object]](/_next/static/media/star-bottom.7253800d.svg)
Unlock your academic potential
Copyright © 2020–2026 A2Z Services. All Rights Reserved. Developed and managed by ZUCOL.