Statistical Analysis Project PMU 2014

Verified

Added on  2019/09/19

|3
|923
|57
Project
AI Summary
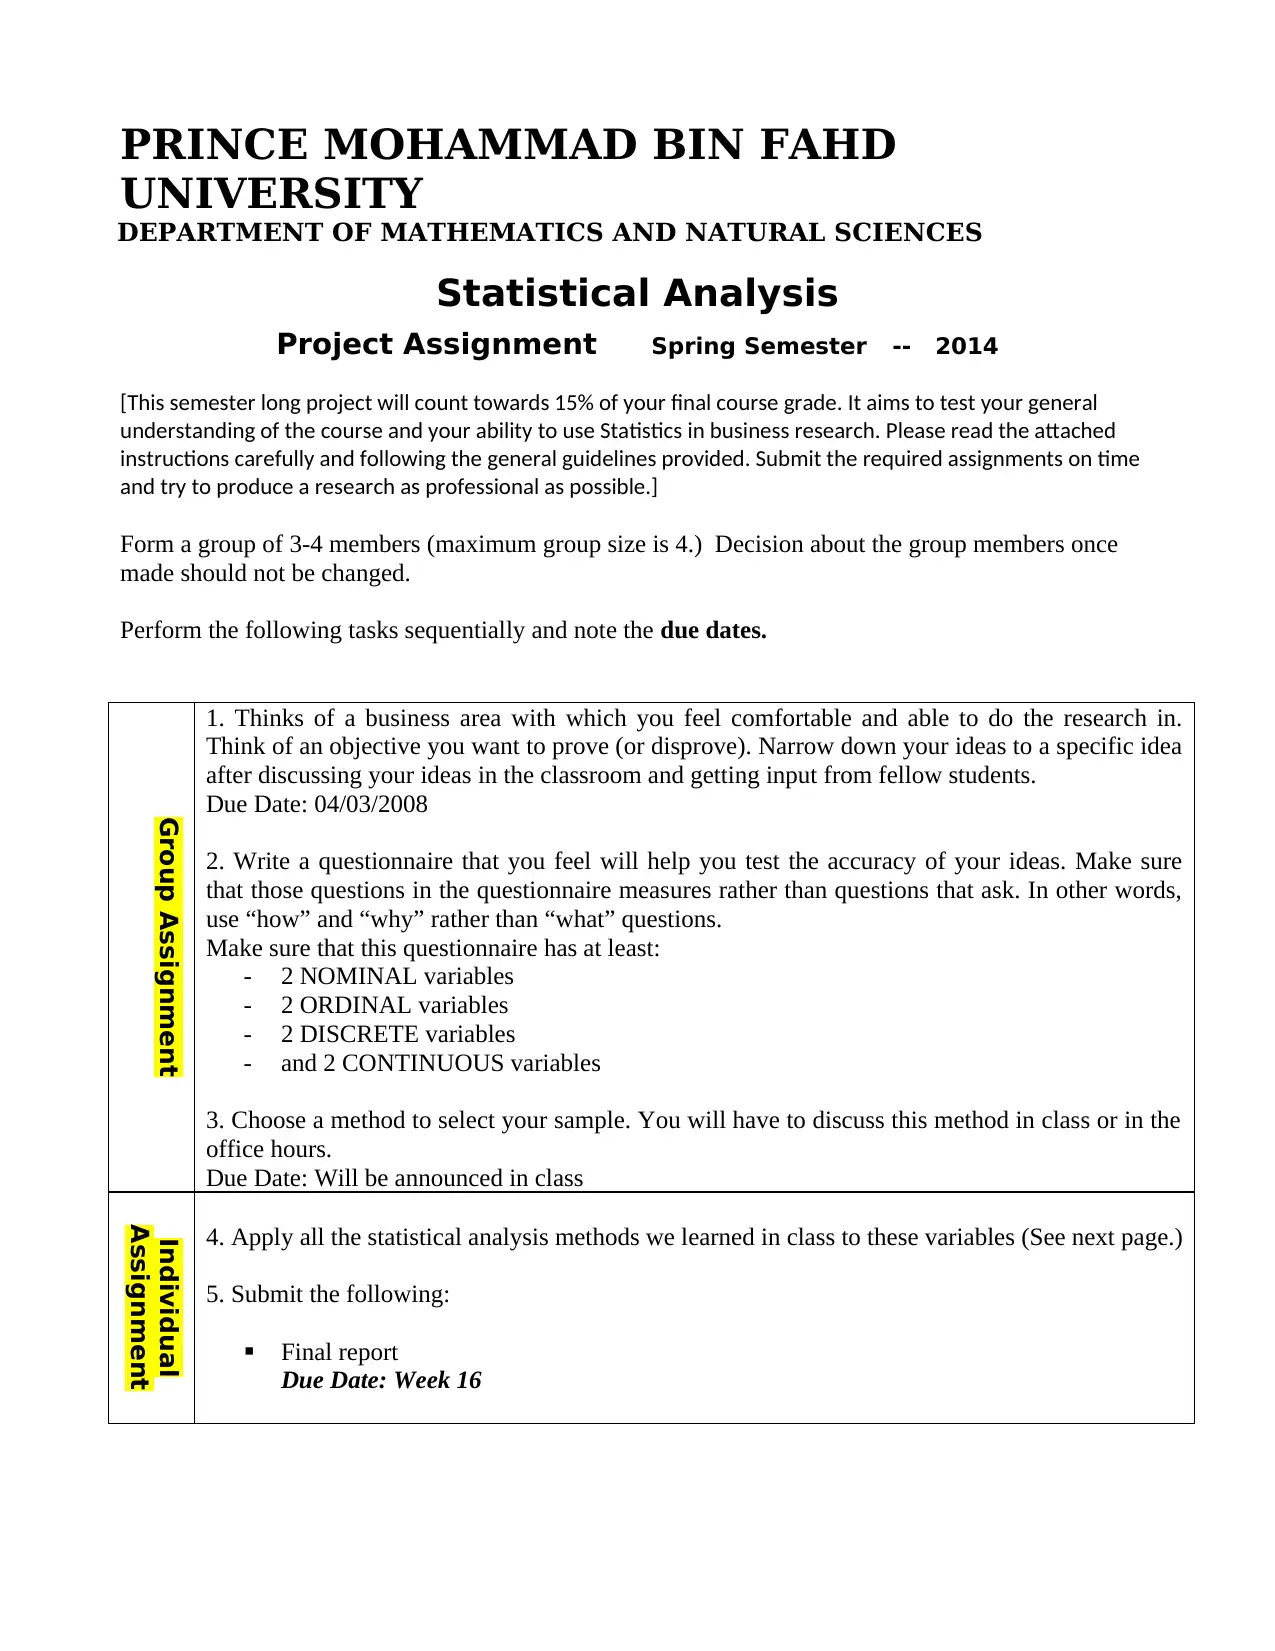
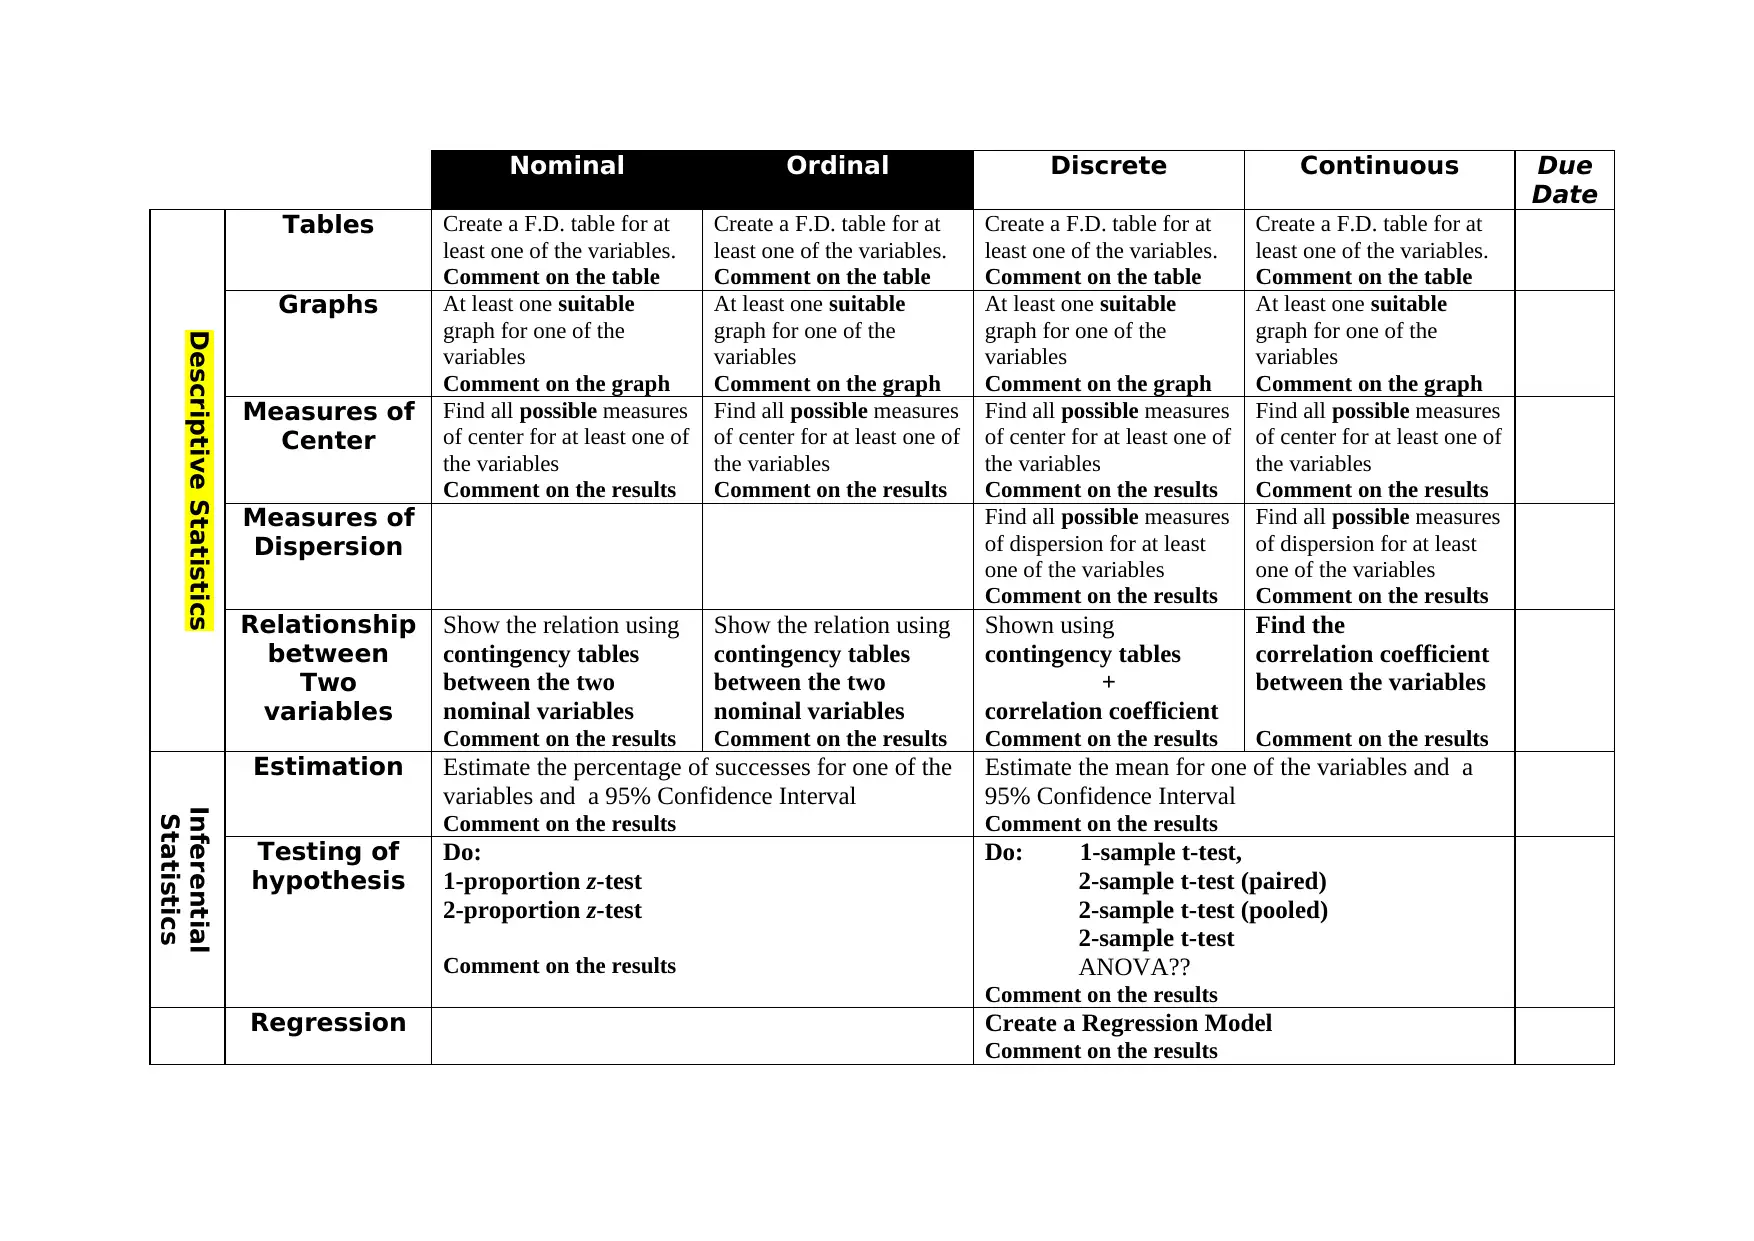
This document outlines a semester-long project for a Statistical Analysis course at Prince Mohammad Bin Fahd University. The project, worth 15% of the final grade, requires students to form groups and conduct business research using statistical methods. The project involves selecting a business area, creating a questionnaire with various types of variables, choosing a sampling method, applying statistical analysis techniques, and submitting a final report. The analysis includes descriptive statistics, measures of center and dispersion, relationship between variables, estimation, hypothesis testing, and regression analysis. The project aims to assess students' understanding of statistical concepts and their ability to apply them in a business context.
tabler-icon-diamond-filled.svg

Contribute Materials

Your contribution can guide someone’s learning journey. Share your documents today.
Document Page
PRINCE MOHAMMAD BIN FAHD
UNIVERSITY
DEPARTMENT OF MATHEMATICS AND NATURAL SCIENCES
Statistical Analysis
Project Assignment Spring Semester -- 2014
[This semester long project will count towards 15% of your final course grade. It aims to test your general
understanding of the course and your ability to use Statistics in business research. Please read the attached
instructions carefully and following the general guidelines provided. Submit the required assignments on time
and try to produce a research as professional as possible.]
Form a group of 3-4 members (maximum group size is 4.) Decision about the group members once
made should not be changed.
Perform the following tasks sequentially and note the due dates.
Group Assignment
1. Thinks of a business area with which you feel comfortable and able to do the research in.
Think of an objective you want to prove (or disprove). Narrow down your ideas to a specific idea
after discussing your ideas in the classroom and getting input from fellow students.
Due Date: 04/03/2008
2. Write a questionnaire that you feel will help you test the accuracy of your ideas. Make sure
that those questions in the questionnaire measures rather than questions that ask. In other words,
use “how” and “why” rather than “what” questions.
Make sure that this questionnaire has at least:
- 2 NOMINAL variables
- 2 ORDINAL variables
- 2 DISCRETE variables
- and 2 CONTINUOUS variables
3. Choose a method to select your sample. You will have to discuss this method in class or in the
office hours.
Due Date: Will be announced in class
Individual
Assignment
4. Apply all the statistical analysis methods we learned in class to these variables (See next page.)
5. Submit the following:
Final report
Due Date: Week 16
tabler-icon-diamond-filled.svg

Secure Best Marks with AI Grader

Need help grading? Try our AI Grader for instant feedback on your assignments.
Document Page
Nominal Ordinal Discrete Continuous Due
Date
Descriptive Statistics
Tables Create a F.D. table for at
least one of the variables.
Comment on the table
Create a F.D. table for at
least one of the variables.
Comment on the table
Create a F.D. table for at
least one of the variables.
Comment on the table
Create a F.D. table for at
least one of the variables.
Comment on the table
Graphs At least one suitable
graph for one of the
variables
Comment on the graph
At least one suitable
graph for one of the
variables
Comment on the graph
At least one suitable
graph for one of the
variables
Comment on the graph
At least one suitable
graph for one of the
variables
Comment on the graph
Measures of
Center
Find all possible measures
of center for at least one of
the variables
Comment on the results
Find all possible measures
of center for at least one of
the variables
Comment on the results
Find all possible measures
of center for at least one of
the variables
Comment on the results
Find all possible measures
of center for at least one of
the variables
Comment on the results
Measures of
Dispersion
Find all possible measures
of dispersion for at least
one of the variables
Comment on the results
Find all possible measures
of dispersion for at least
one of the variables
Comment on the results
Relationship
between
Two
variables
Show the relation using
contingency tables
between the two
nominal variables
Comment on the results
Show the relation using
contingency tables
between the two
nominal variables
Comment on the results
Shown using
contingency tables
+
correlation coefficient
Comment on the results
Find the
correlation coefficient
between the variables
Comment on the results
Inferential
Statistics
Estimation Estimate the percentage of successes for one of the
variables and a 95% Confidence Interval
Comment on the results
Estimate the mean for one of the variables and a
95% Confidence Interval
Comment on the results
Testing of
hypothesis
Do:
1-proportion z-test
2-proportion z-test
Comment on the results
Do: 1-sample t-test,
2-sample t-test (paired)
2-sample t-test (pooled)
2-sample t-test
ANOVA??
Comment on the results
Regression Create a Regression Model
Comment on the results
Document Page
chevron_up_icon
1 out of 3
circle_padding
hide_on_mobile
zoom_out_icon
logo.png

Your All-in-One AI-Powered Toolkit for Academic Success.

Available 24*7 on WhatsApp / Email

[object Object]