Statistical Analysis of Psychological Data: Assignment Solutions
VerifiedAdded on 2021/01/01
|10
|2071
|277
Homework Assignment
AI Summary
This document provides comprehensive solutions to a statistical analysis assignment in psychology, addressing questions on various statistical tests including t-tests, ANOVA, correlation, and regression. The assignment covers topics such as hypothesis testing, effect size, data accuracy, and the interpretation of statistical results. It includes detailed explanations of the tests used, their application, and the interpretation of the results in the context of the research questions. The assignment also explores the impact of educational interventions on self-efficacy and the correlation between psychological variables and fruit and vegetable consumption in children. The solutions include the null and alternative hypotheses, statistical output, and interpretations of the findings. This assignment helps students understand how to apply statistical methods to analyze psychological data and draw meaningful conclusions.
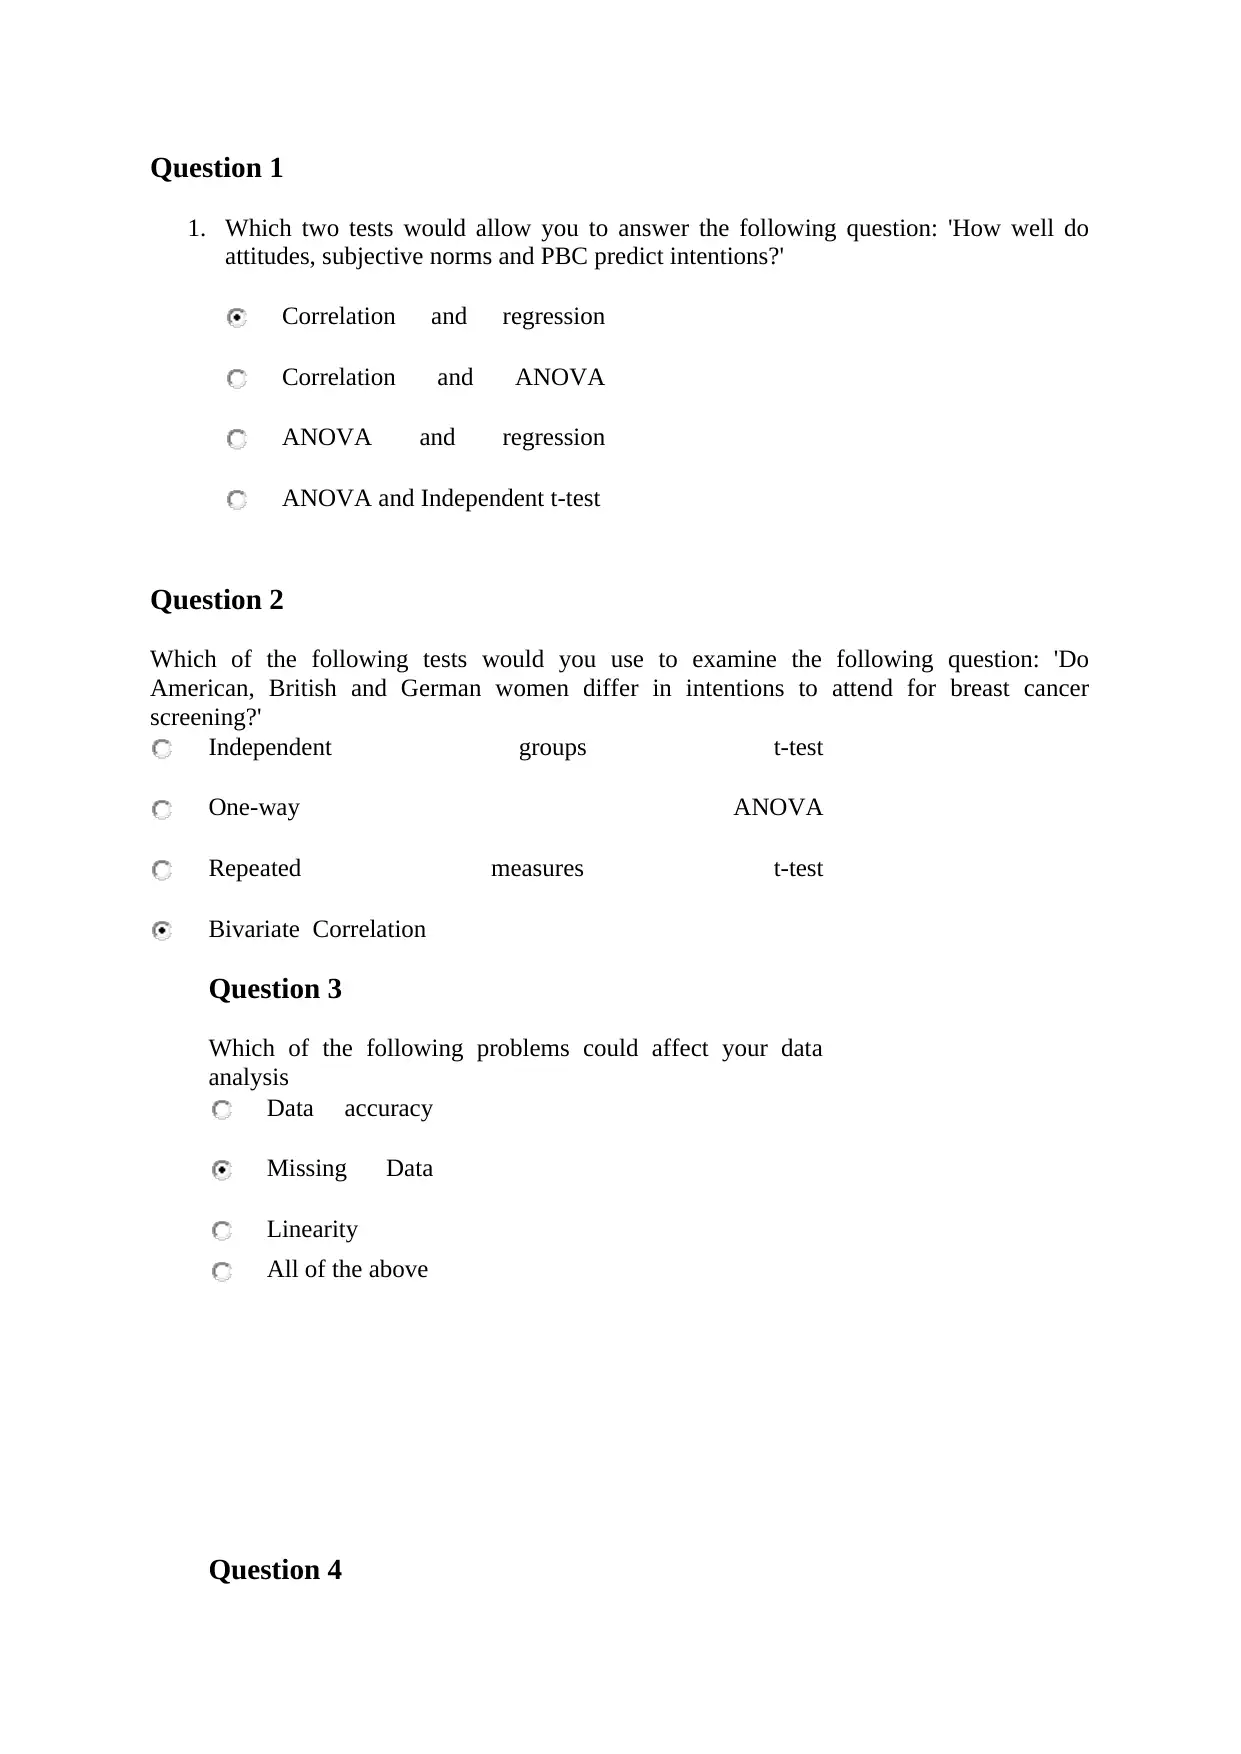
Question 1
1. Which two tests would allow you to answer the following question: 'How well do
attitudes, subjective norms and PBC predict intentions?'
Correlation and regression
Correlation and ANOVA
ANOVA and regression
ANOVA and Independent t-test
Question 2
Which of the following tests would you use to examine the following question: 'Do
American, British and German women differ in intentions to attend for breast cancer
screening?'
Independent groups t-test
One-way ANOVA
Repeated measures t-test
Bivariate Correlation
Question 3
Which of the following problems could affect your data
analysis
Data accuracy
Missing Data
Linearity
All of the above
Question 4
Paraphrase This Document
Need a fresh take? Get an instant paraphrase of this document with our AI Paraphraser
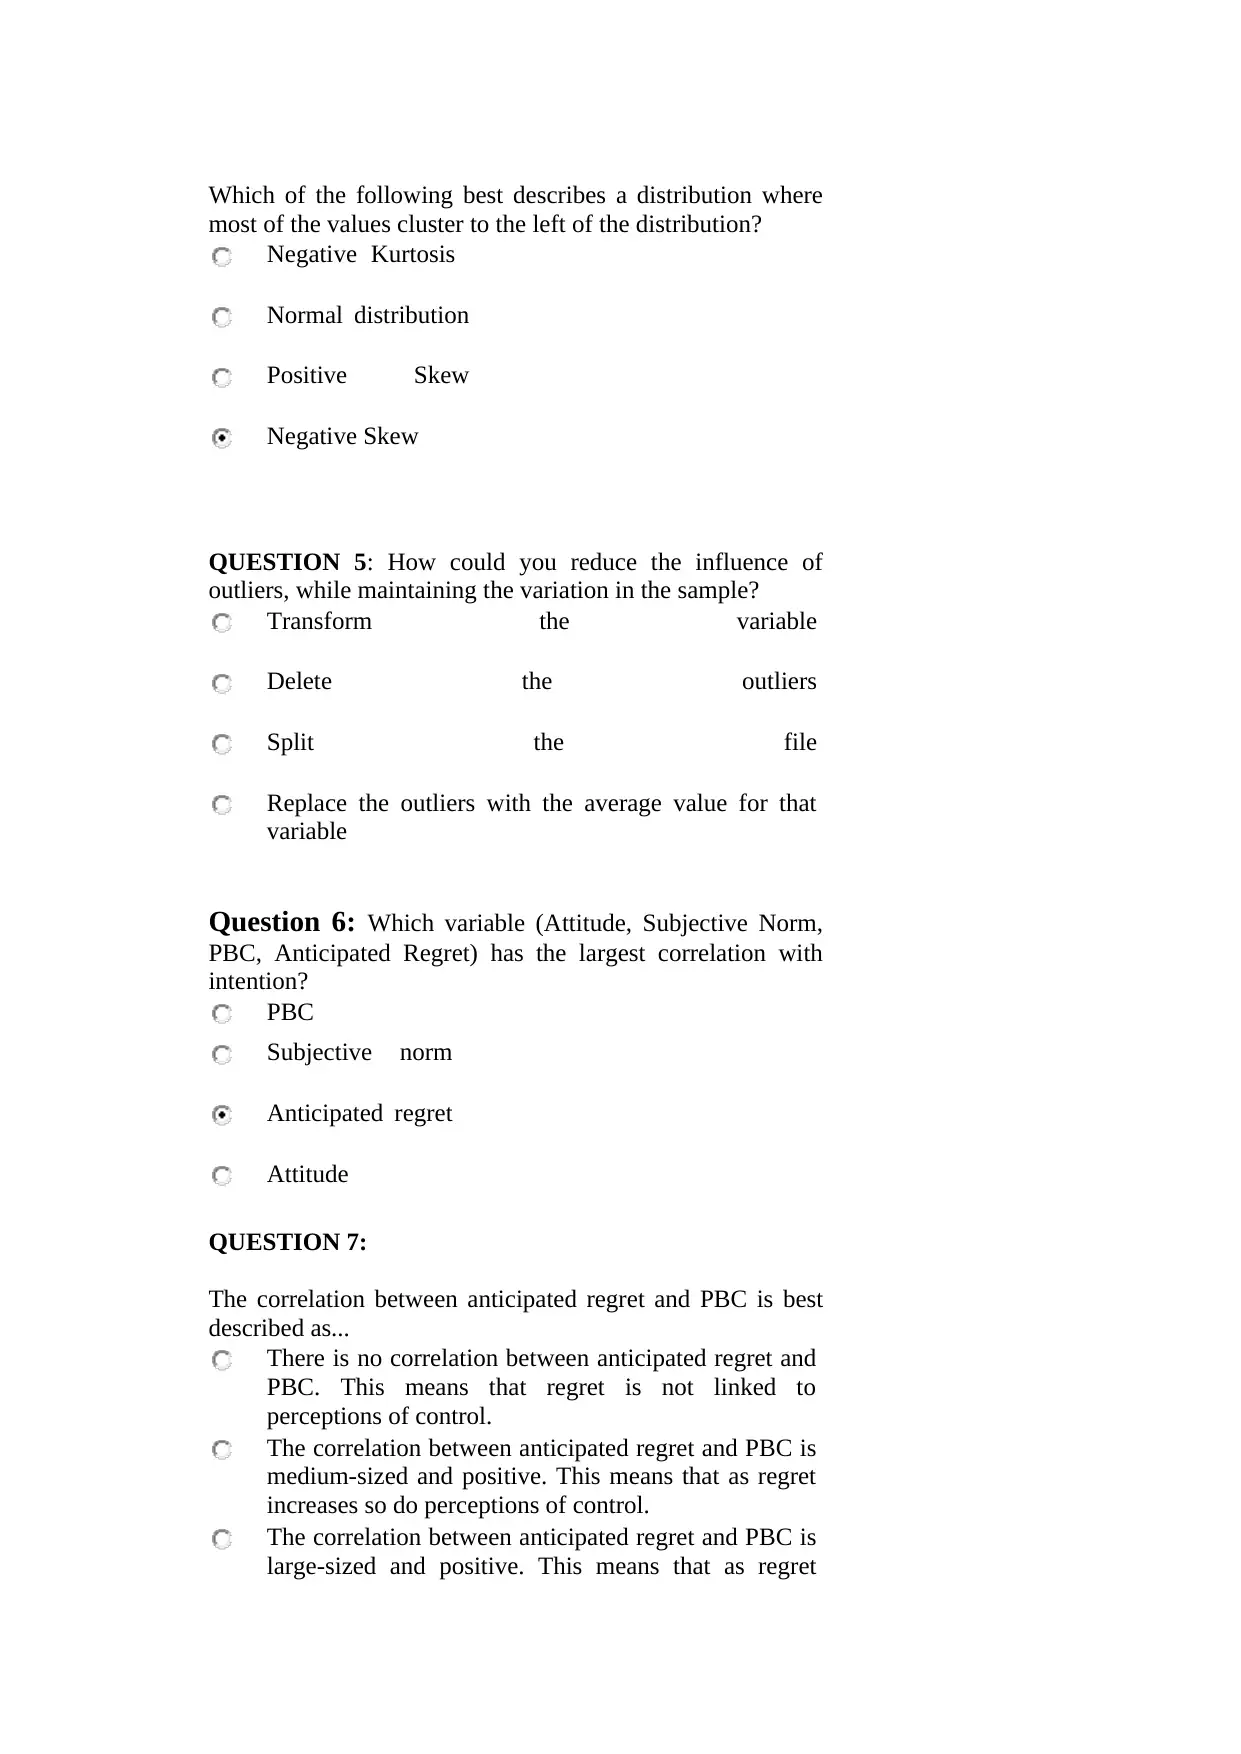
Which of the following best describes a distribution where
most of the values cluster to the left of the distribution?
Negative Kurtosis
Normal distribution
Positive Skew
Negative Skew
QUESTION 5: How could you reduce the influence of
outliers, while maintaining the variation in the sample?
Transform the variable
Delete the outliers
Split the file
Replace the outliers with the average value for that
variable
Question 6: Which variable (Attitude, Subjective Norm,
PBC, Anticipated Regret) has the largest correlation with
intention?
PBC
Subjective norm
Anticipated regret
Attitude
QUESTION 7:
The correlation between anticipated regret and PBC is best
described as...
There is no correlation between anticipated regret and
PBC. This means that regret is not linked to
perceptions of control.
The correlation between anticipated regret and PBC is
medium-sized and positive. This means that as regret
increases so do perceptions of control.
The correlation between anticipated regret and PBC is
large-sized and positive. This means that as regret
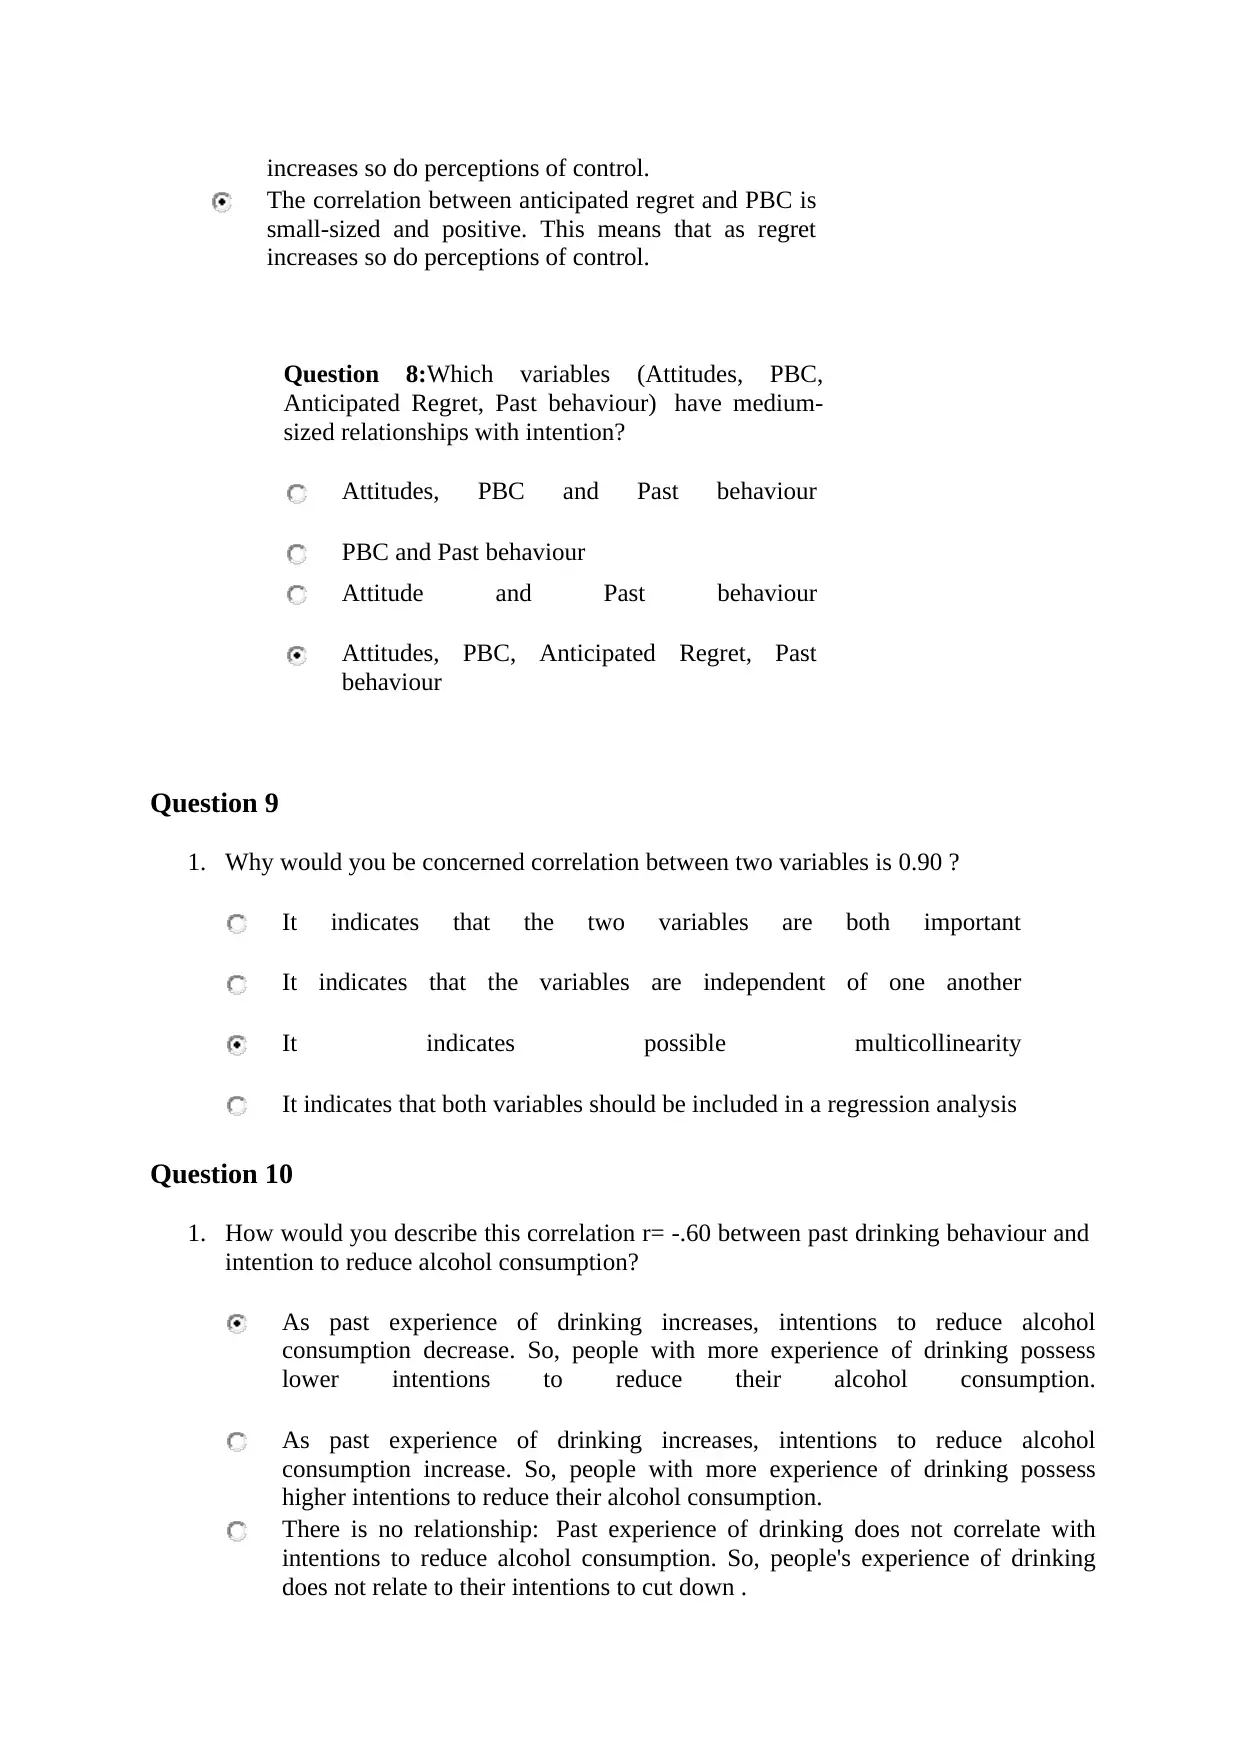
increases so do perceptions of control.
The correlation between anticipated regret and PBC is
small-sized and positive. This means that as regret
increases so do perceptions of control.
Question 8:Which variables (Attitudes, PBC,
Anticipated Regret, Past behaviour) have medium-
sized relationships with intention?
Attitudes, PBC and Past behaviour
PBC and Past behaviour
Attitude and Past behaviour
Attitudes, PBC, Anticipated Regret, Past
behaviour
Question 9
1. Why would you be concerned correlation between two variables is 0.90 ?
It indicates that the two variables are both important
It indicates that the variables are independent of one another
It indicates possible multicollinearity
It indicates that both variables should be included in a regression analysis
Question 10
1. How would you describe this correlation r= -.60 between past drinking behaviour and
intention to reduce alcohol consumption?
As past experience of drinking increases, intentions to reduce alcohol
consumption decrease. So, people with more experience of drinking possess
lower intentions to reduce their alcohol consumption.
As past experience of drinking increases, intentions to reduce alcohol
consumption increase. So, people with more experience of drinking possess
higher intentions to reduce their alcohol consumption.
There is no relationship: Past experience of drinking does not correlate with
intentions to reduce alcohol consumption. So, people's experience of drinking
does not relate to their intentions to cut down .
⊘ This is a preview!⊘
Do you want full access?
Subscribe today to unlock all pages.
Trusted by 1+ million students worldwide
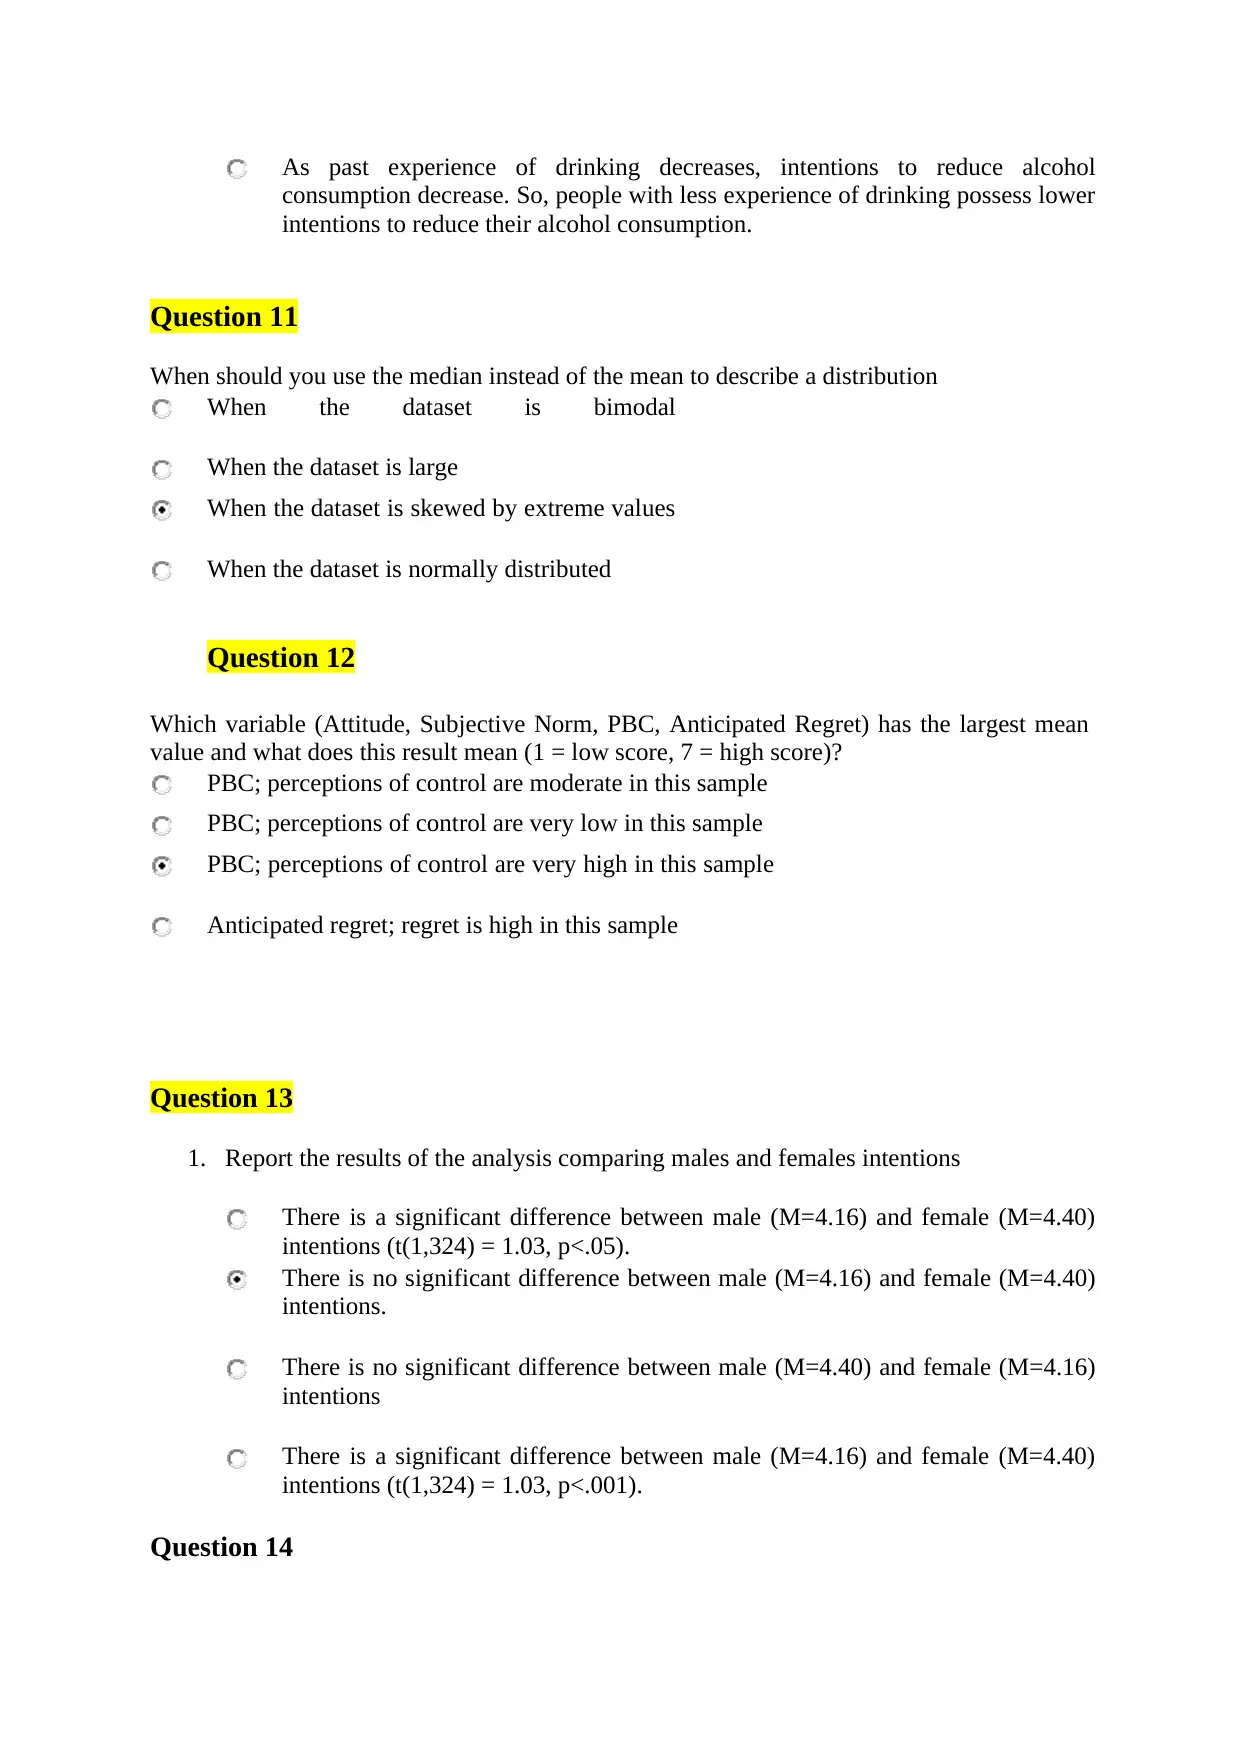
As past experience of drinking decreases, intentions to reduce alcohol
consumption decrease. So, people with less experience of drinking possess lower
intentions to reduce their alcohol consumption.
Question 11
When should you use the median instead of the mean to describe a distribution
When the dataset is bimodal
When the dataset is large
When the dataset is skewed by extreme values
When the dataset is normally distributed
Question 12
Which variable (Attitude, Subjective Norm, PBC, Anticipated Regret) has the largest mean
value and what does this result mean (1 = low score, 7 = high score)?
PBC; perceptions of control are moderate in this sample
PBC; perceptions of control are very low in this sample
PBC; perceptions of control are very high in this sample
Anticipated regret; regret is high in this sample
Question 13
1. Report the results of the analysis comparing males and females intentions
There is a significant difference between male (M=4.16) and female (M=4.40)
intentions (t(1,324) = 1.03, p<.05).
There is no significant difference between male (M=4.16) and female (M=4.40)
intentions.
There is no significant difference between male (M=4.40) and female (M=4.16)
intentions
There is a significant difference between male (M=4.16) and female (M=4.40)
intentions (t(1,324) = 1.03, p<.001).
Question 14
Paraphrase This Document
Need a fresh take? Get an instant paraphrase of this document with our AI Paraphraser
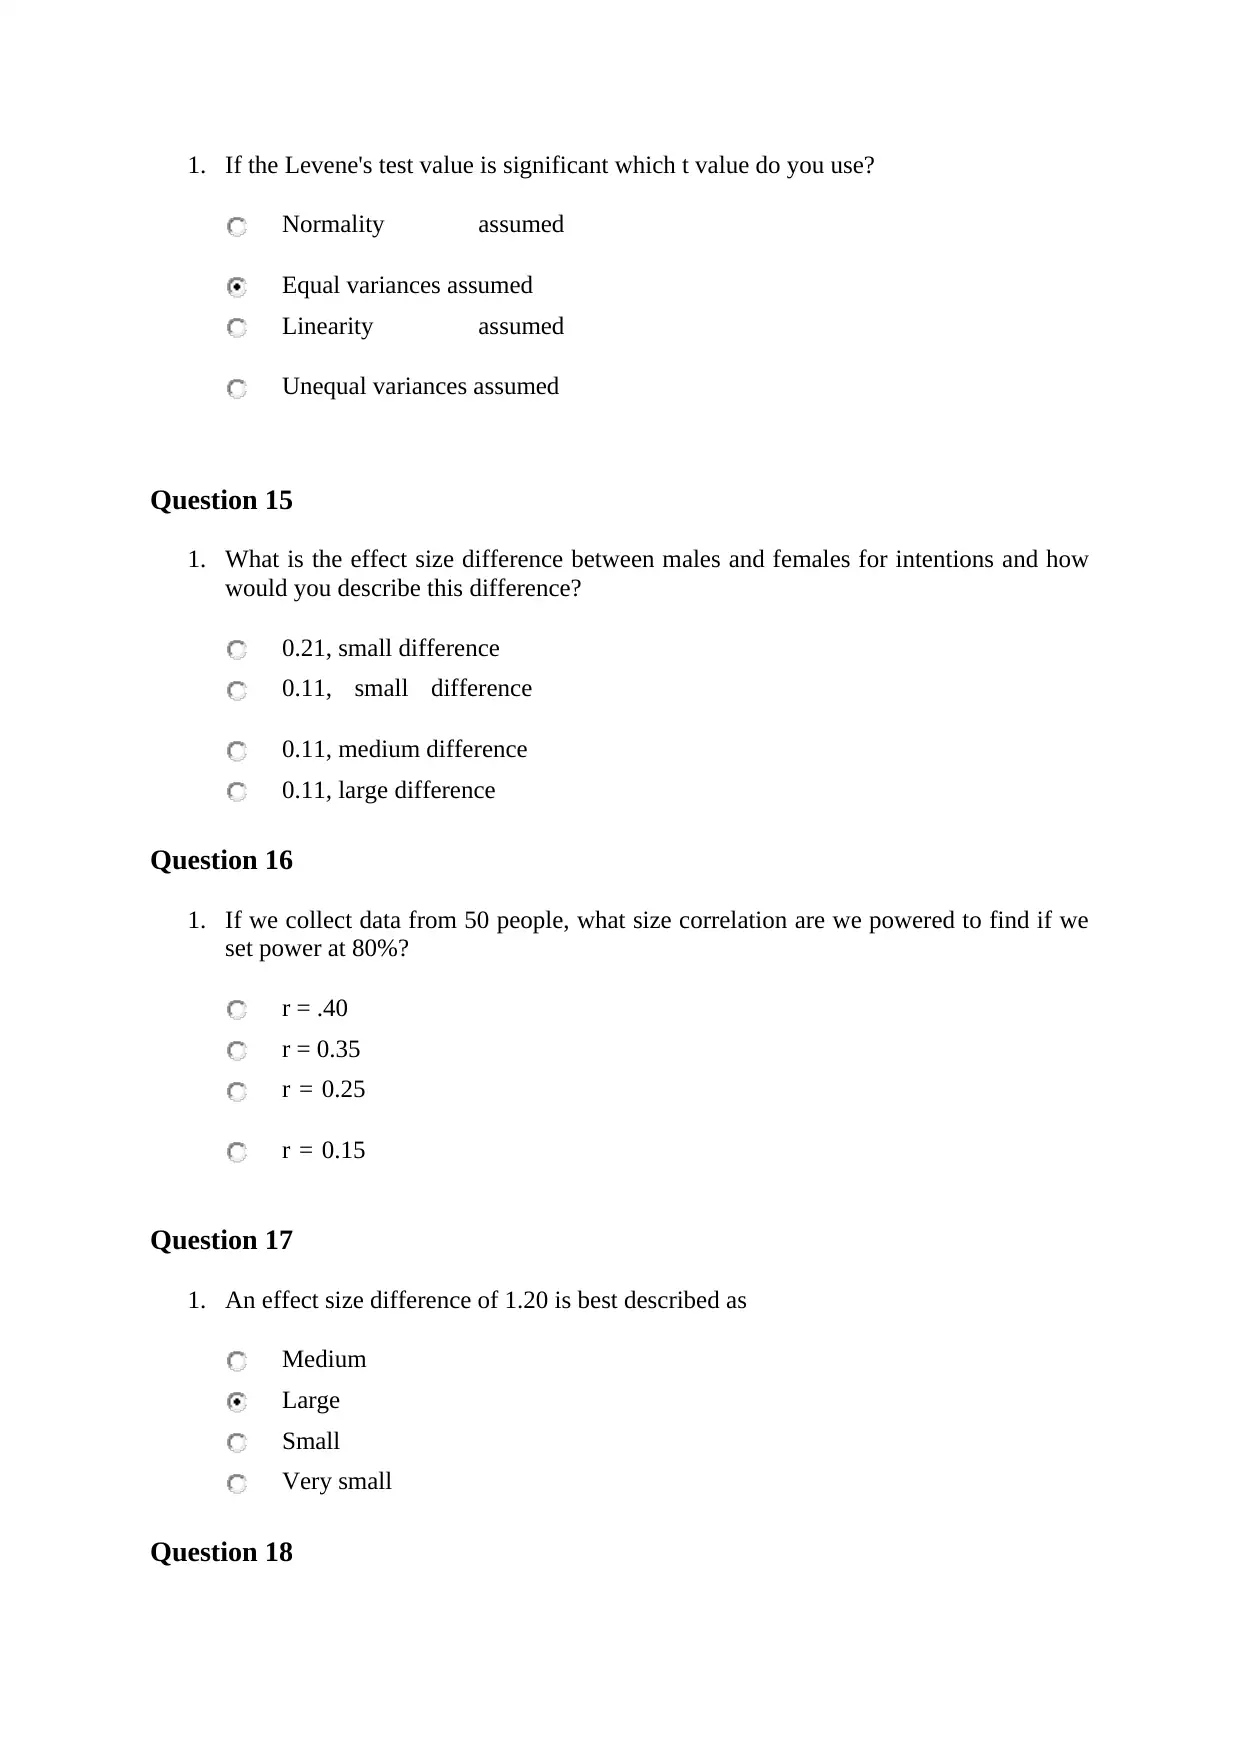
1. If the Levene's test value is significant which t value do you use?
Normality assumed
Equal variances assumed
Linearity assumed
Unequal variances assumed
Question 15
1. What is the effect size difference between males and females for intentions and how
would you describe this difference?
0.21, small difference
0.11, small difference
0.11, medium difference
0.11, large difference
Question 16
1. If we collect data from 50 people, what size correlation are we powered to find if we
set power at 80%?
r = .40
r = 0.35
r = 0.25
r = 0.15
Question 17
1. An effect size difference of 1.20 is best described as
Medium
Large
Small
Very small
Question 18
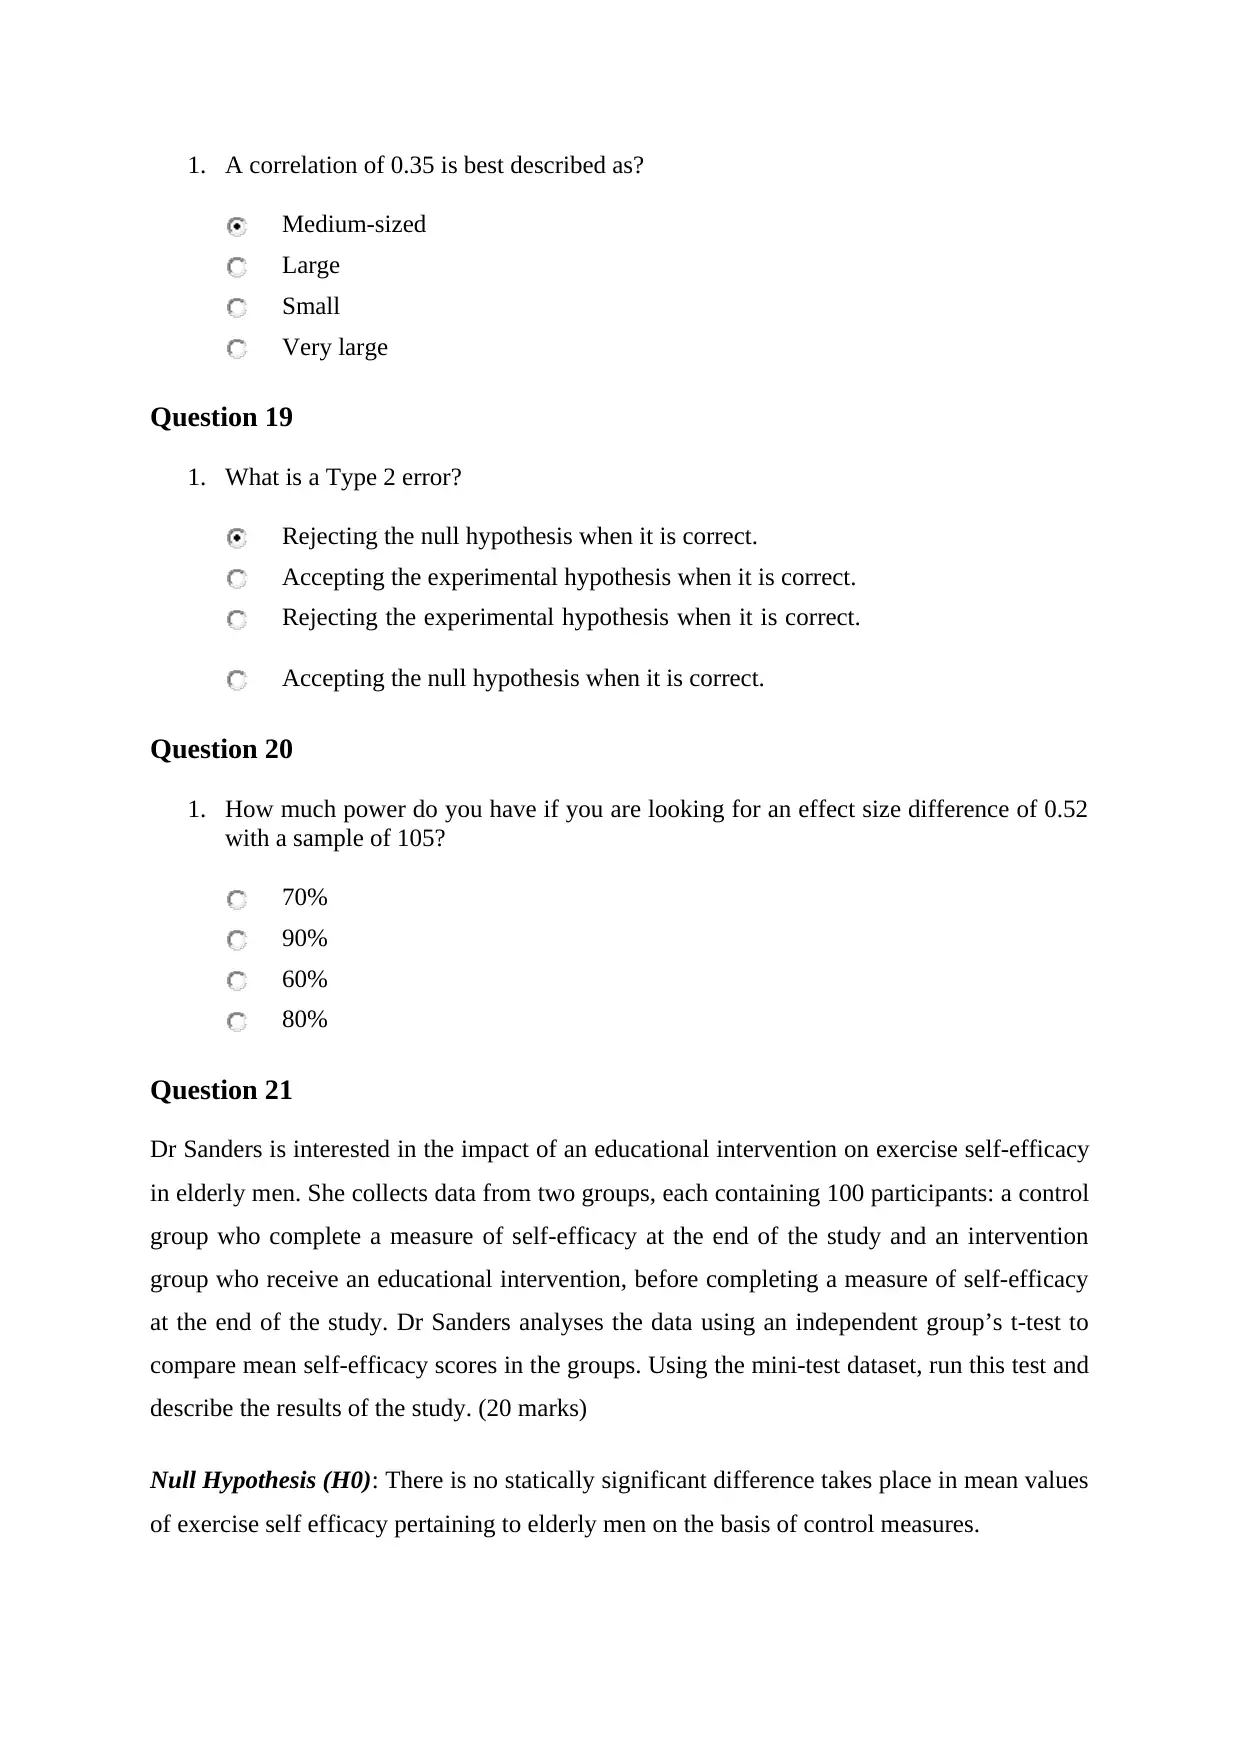
1. A correlation of 0.35 is best described as?
Medium-sized
Large
Small
Very large
Question 19
1. What is a Type 2 error?
Rejecting the null hypothesis when it is correct.
Accepting the experimental hypothesis when it is correct.
Rejecting the experimental hypothesis when it is correct.
Accepting the null hypothesis when it is correct.
Question 20
1. How much power do you have if you are looking for an effect size difference of 0.52
with a sample of 105?
70%
90%
60%
80%
Question 21
Dr Sanders is interested in the impact of an educational intervention on exercise self-efficacy
in elderly men. She collects data from two groups, each containing 100 participants: a control
group who complete a measure of self-efficacy at the end of the study and an intervention
group who receive an educational intervention, before completing a measure of self-efficacy
at the end of the study. Dr Sanders analyses the data using an independent group’s t-test to
compare mean self-efficacy scores in the groups. Using the mini-test dataset, run this test and
describe the results of the study. (20 marks)
Null Hypothesis (H0): There is no statically significant difference takes place in mean values
of exercise self efficacy pertaining to elderly men on the basis of control measures.
⊘ This is a preview!⊘
Do you want full access?
Subscribe today to unlock all pages.
Trusted by 1+ million students worldwide
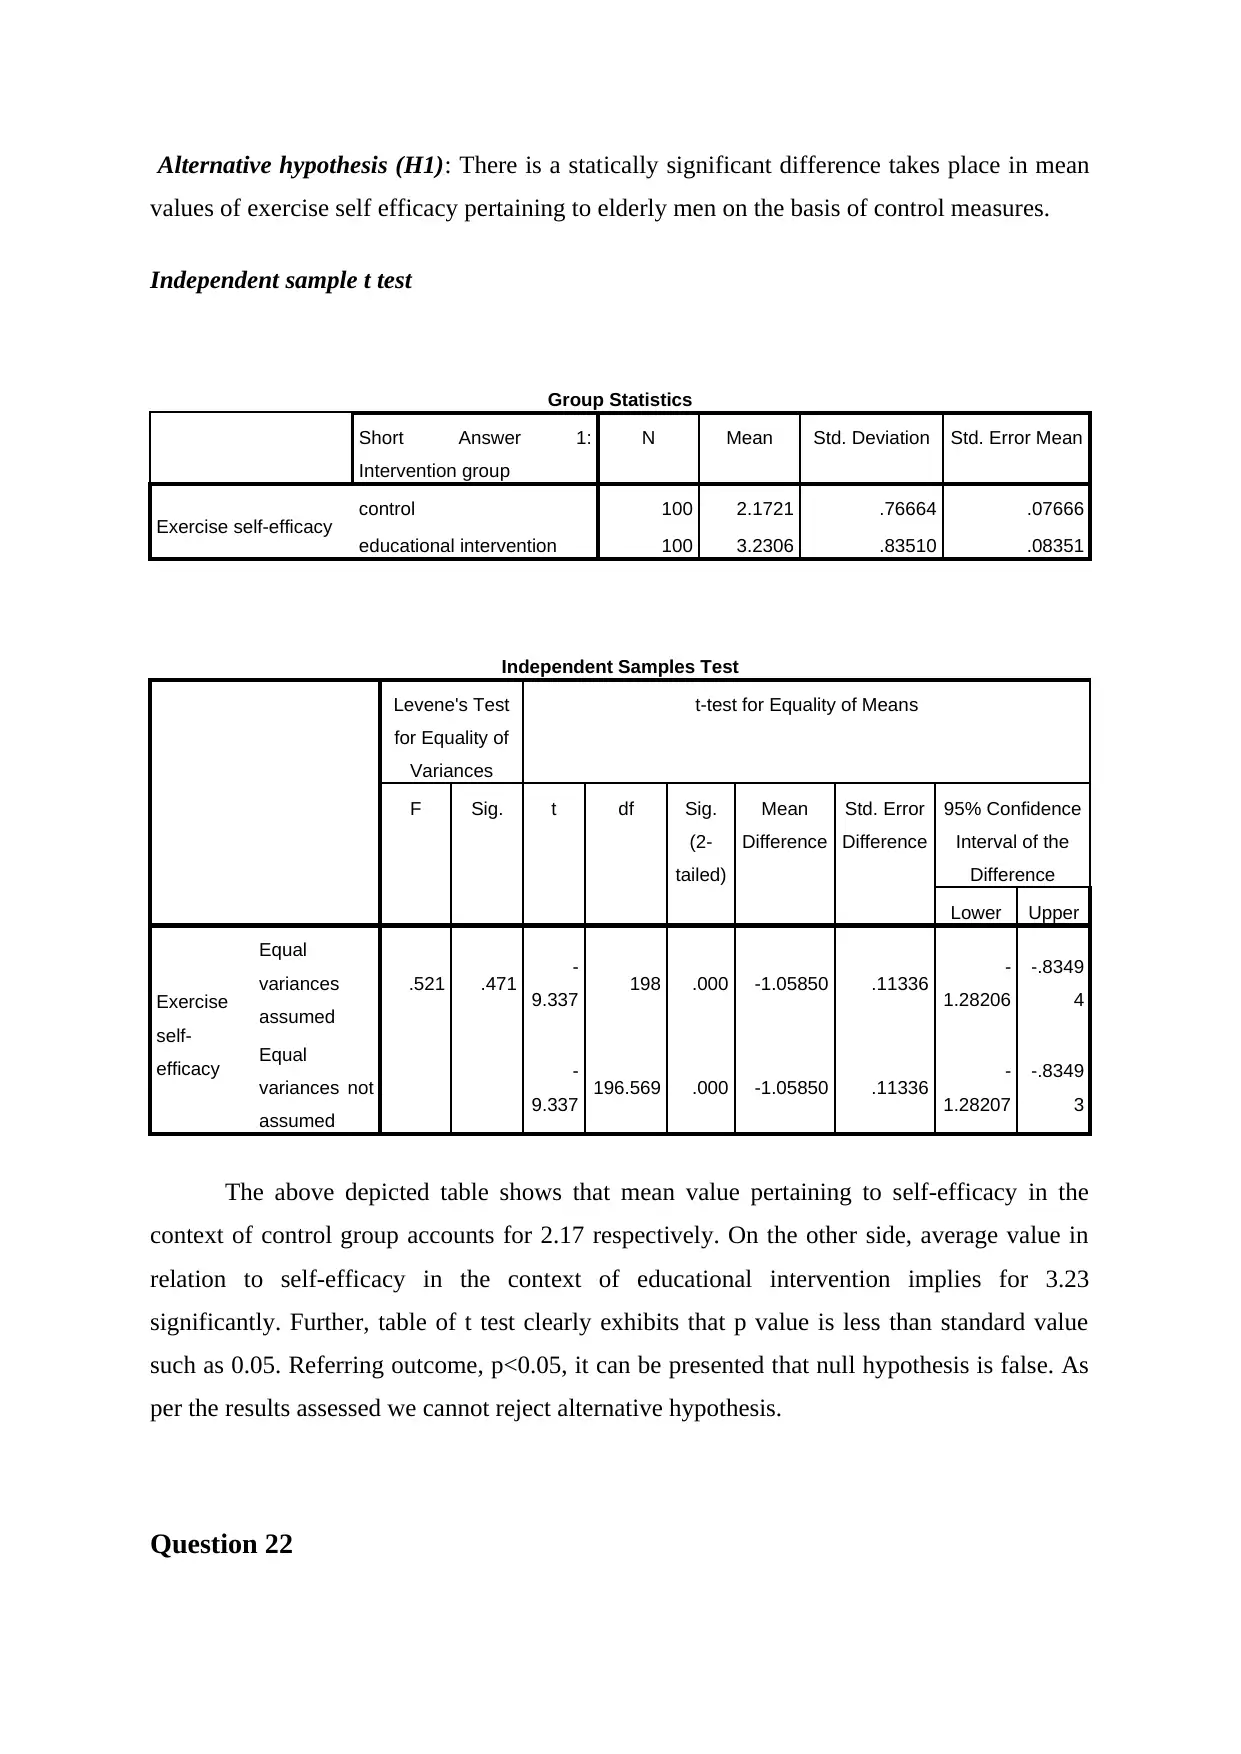
Alternative hypothesis (H1): There is a statically significant difference takes place in mean
values of exercise self efficacy pertaining to elderly men on the basis of control measures.
Independent sample t test
Group Statistics
Short Answer 1:
Intervention group
N Mean Std. Deviation Std. Error Mean
Exercise self-efficacy control 100 2.1721 .76664 .07666
educational intervention 100 3.2306 .83510 .08351
Independent Samples Test
Levene's Test
for Equality of
Variances
t-test for Equality of Means
F Sig. t df Sig.
(2-
tailed)
Mean
Difference
Std. Error
Difference
95% Confidence
Interval of the
Difference
Lower Upper
Exercise
self-
efficacy
Equal
variances
assumed
.521 .471 -
9.337 198 .000 -1.05850 .11336 -
1.28206
-.8349
4
Equal
variances not
assumed
-
9.337 196.569 .000 -1.05850 .11336 -
1.28207
-.8349
3
The above depicted table shows that mean value pertaining to self-efficacy in the
context of control group accounts for 2.17 respectively. On the other side, average value in
relation to self-efficacy in the context of educational intervention implies for 3.23
significantly. Further, table of t test clearly exhibits that p value is less than standard value
such as 0.05. Referring outcome, p<0.05, it can be presented that null hypothesis is false. As
per the results assessed we cannot reject alternative hypothesis.
Question 22
Paraphrase This Document
Need a fresh take? Get an instant paraphrase of this document with our AI Paraphraser
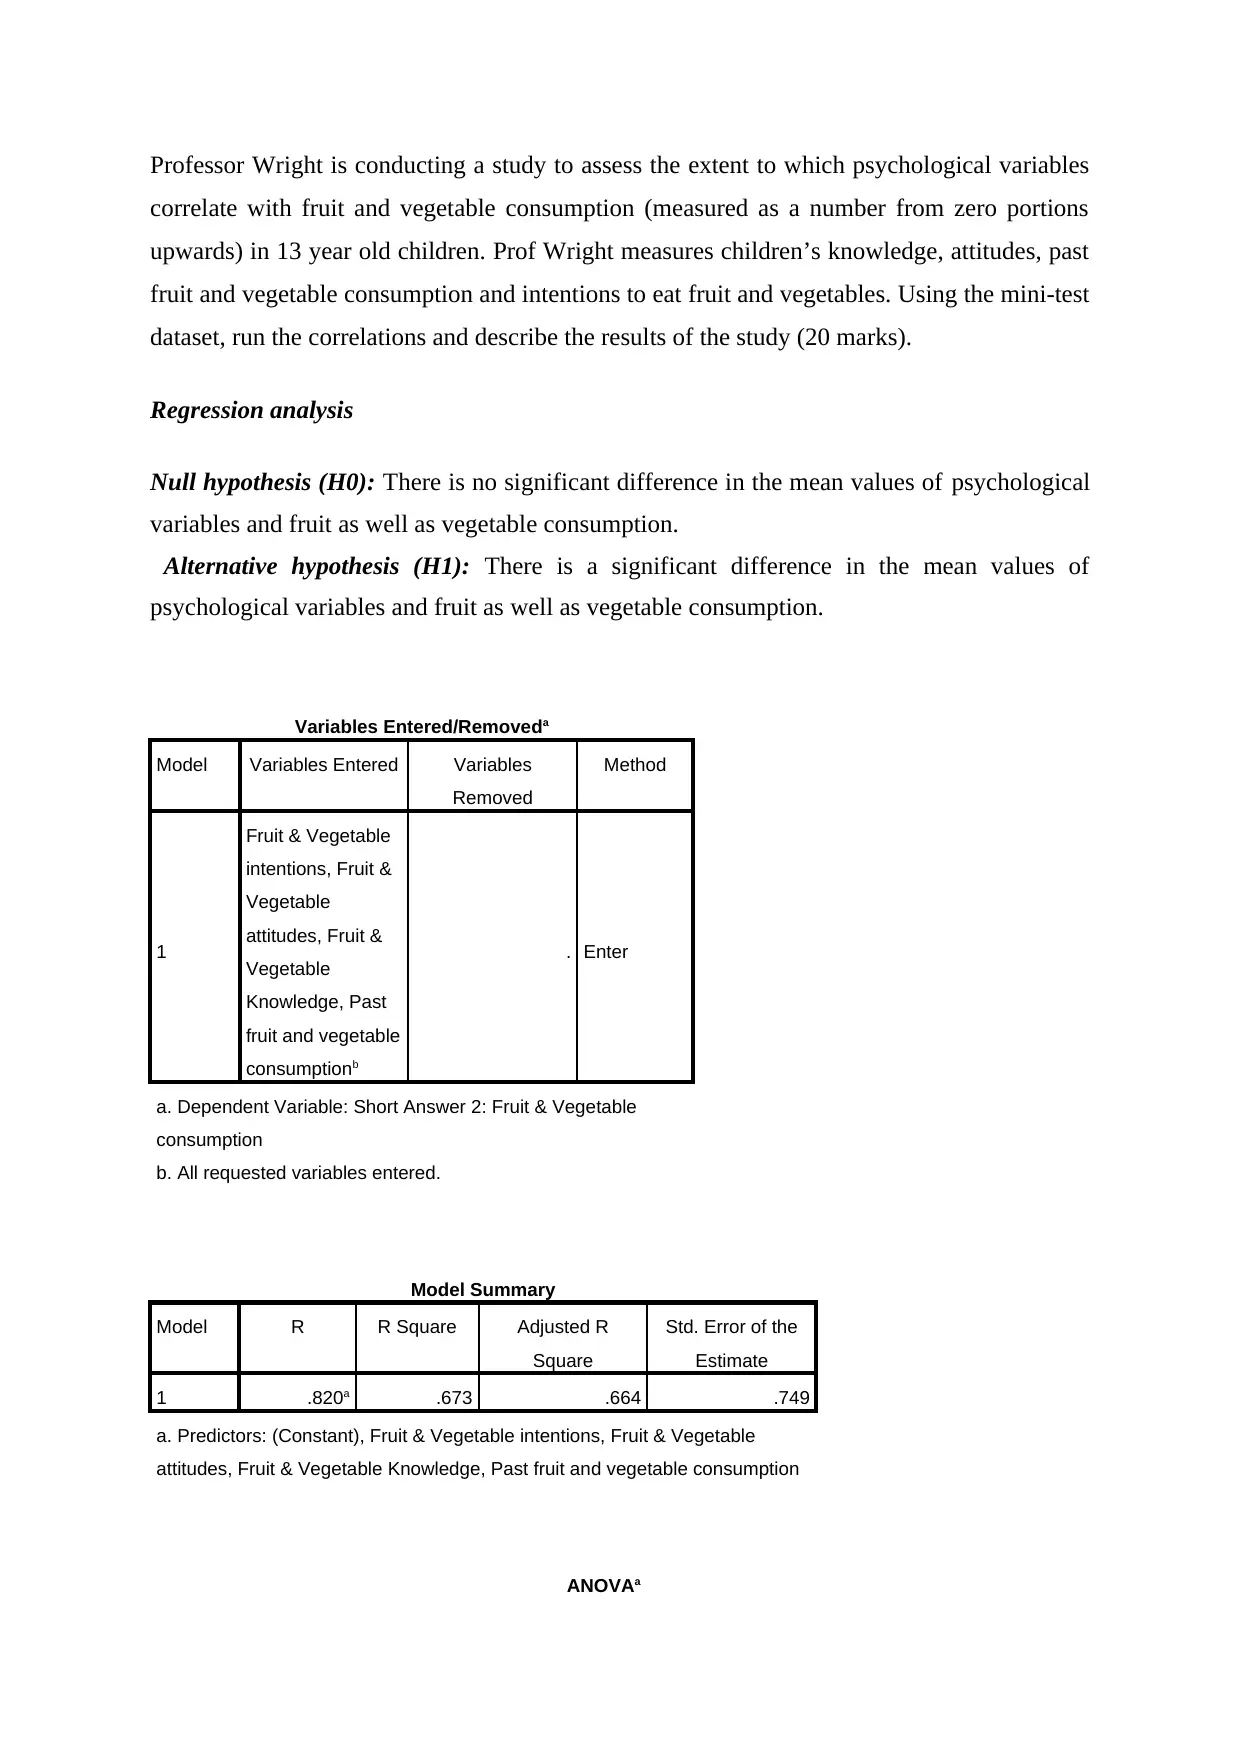
Professor Wright is conducting a study to assess the extent to which psychological variables
correlate with fruit and vegetable consumption (measured as a number from zero portions
upwards) in 13 year old children. Prof Wright measures children’s knowledge, attitudes, past
fruit and vegetable consumption and intentions to eat fruit and vegetables. Using the mini-test
dataset, run the correlations and describe the results of the study (20 marks).
Regression analysis
Null hypothesis (H0): There is no significant difference in the mean values of psychological
variables and fruit as well as vegetable consumption.
Alternative hypothesis (H1): There is a significant difference in the mean values of
psychological variables and fruit as well as vegetable consumption.
Variables Entered/Removeda
Model Variables Entered Variables
Removed
Method
1
Fruit & Vegetable
intentions, Fruit &
Vegetable
attitudes, Fruit &
Vegetable
Knowledge, Past
fruit and vegetable
consumptionb
. Enter
a. Dependent Variable: Short Answer 2: Fruit & Vegetable
consumption
b. All requested variables entered.
Model Summary
Model R R Square Adjusted R
Square
Std. Error of the
Estimate
1 .820a .673 .664 .749
a. Predictors: (Constant), Fruit & Vegetable intentions, Fruit & Vegetable
attitudes, Fruit & Vegetable Knowledge, Past fruit and vegetable consumption
ANOVAa
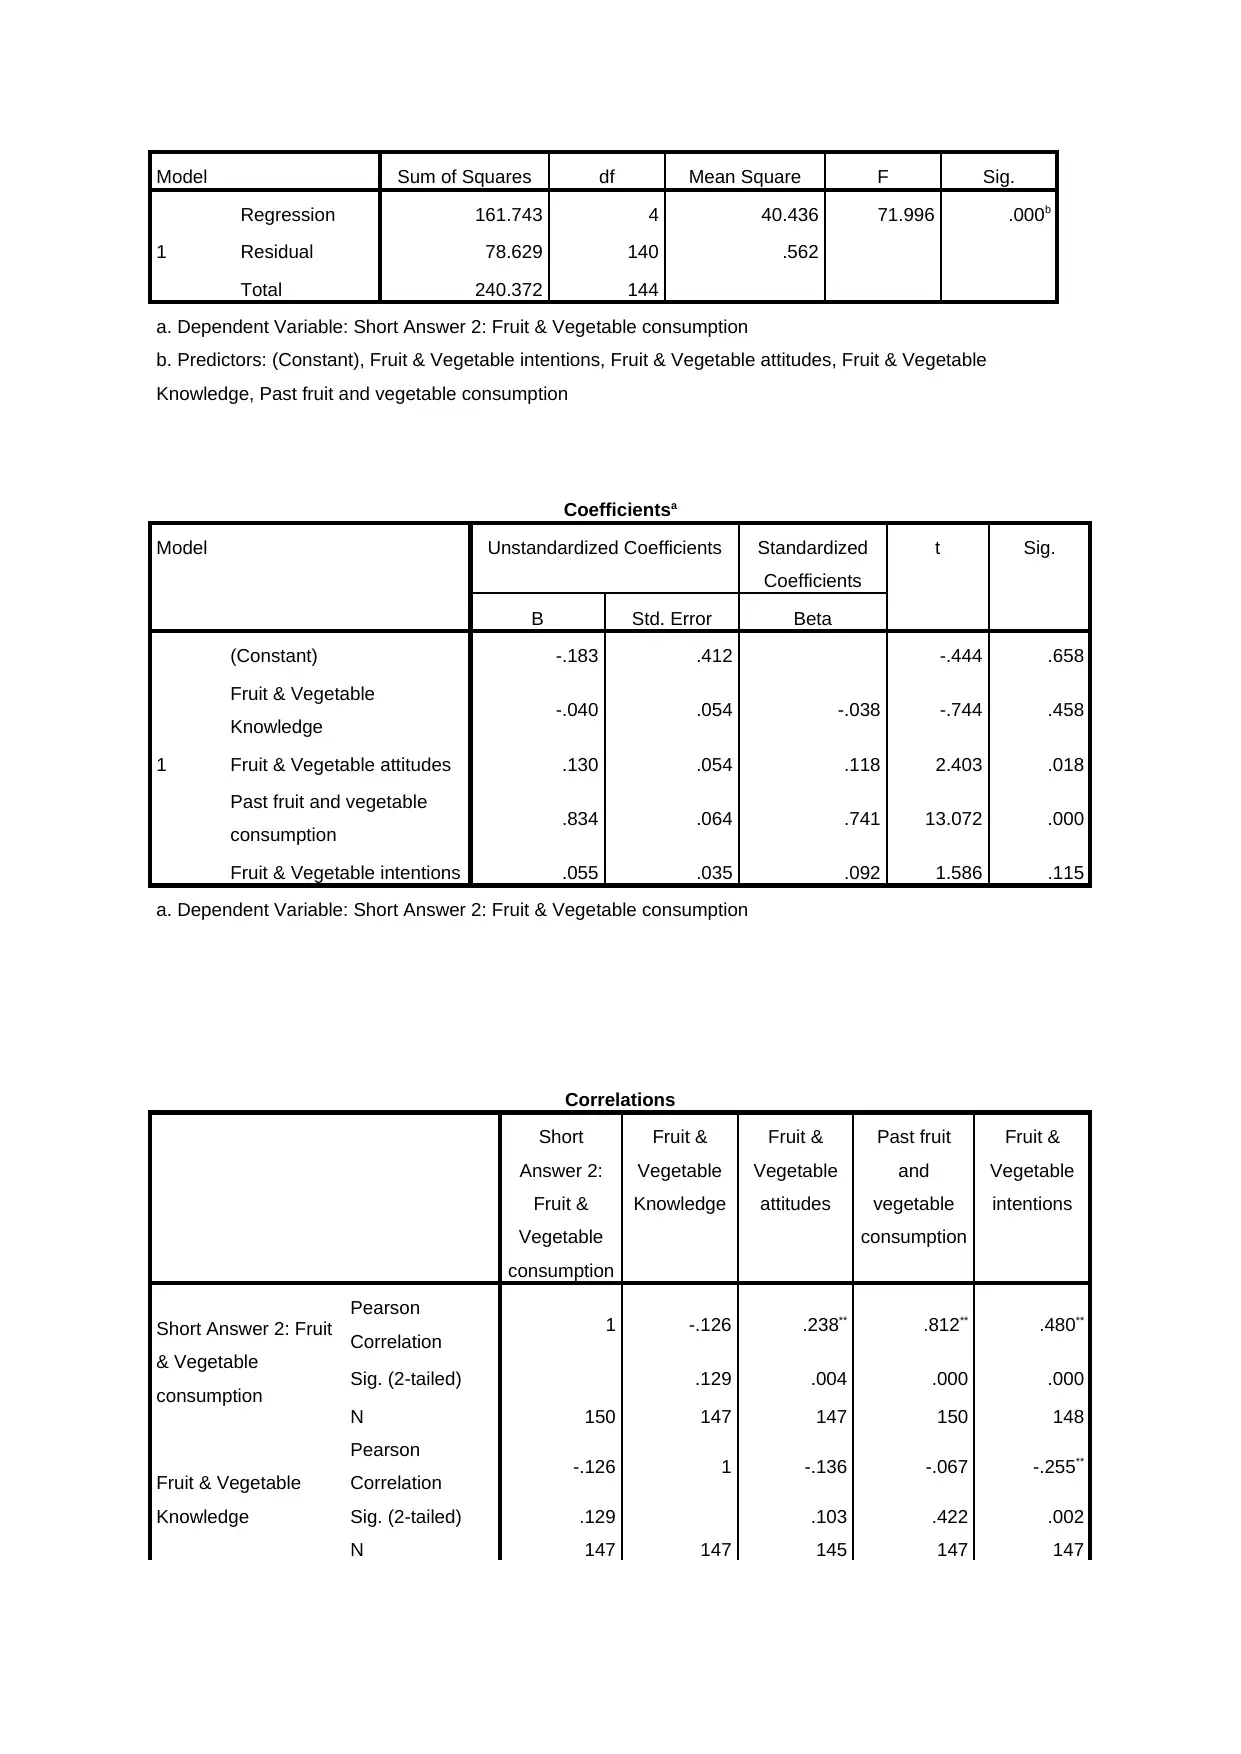
Model Sum of Squares df Mean Square F Sig.
1
Regression 161.743 4 40.436 71.996 .000b
Residual 78.629 140 .562
Total 240.372 144
a. Dependent Variable: Short Answer 2: Fruit & Vegetable consumption
b. Predictors: (Constant), Fruit & Vegetable intentions, Fruit & Vegetable attitudes, Fruit & Vegetable
Knowledge, Past fruit and vegetable consumption
Coefficientsa
Model Unstandardized Coefficients Standardized
Coefficients
t Sig.
B Std. Error Beta
1
(Constant) -.183 .412 -.444 .658
Fruit & Vegetable
Knowledge -.040 .054 -.038 -.744 .458
Fruit & Vegetable attitudes .130 .054 .118 2.403 .018
Past fruit and vegetable
consumption .834 .064 .741 13.072 .000
Fruit & Vegetable intentions .055 .035 .092 1.586 .115
a. Dependent Variable: Short Answer 2: Fruit & Vegetable consumption
Correlations
Short
Answer 2:
Fruit &
Vegetable
consumption
Fruit &
Vegetable
Knowledge
Fruit &
Vegetable
attitudes
Past fruit
and
vegetable
consumption
Fruit &
Vegetable
intentions
Short Answer 2: Fruit
& Vegetable
consumption
Pearson
Correlation 1 -.126 .238** .812** .480**
Sig. (2-tailed) .129 .004 .000 .000
N 150 147 147 150 148
Fruit & Vegetable
Knowledge
Pearson
Correlation -.126 1 -.136 -.067 -.255**
Sig. (2-tailed) .129 .103 .422 .002
N 147 147 145 147 147
1
Regression 161.743 4 40.436 71.996 .000b
Residual 78.629 140 .562
Total 240.372 144
a. Dependent Variable: Short Answer 2: Fruit & Vegetable consumption
b. Predictors: (Constant), Fruit & Vegetable intentions, Fruit & Vegetable attitudes, Fruit & Vegetable
Knowledge, Past fruit and vegetable consumption
Coefficientsa
Model Unstandardized Coefficients Standardized
Coefficients
t Sig.
B Std. Error Beta
1
(Constant) -.183 .412 -.444 .658
Fruit & Vegetable
Knowledge -.040 .054 -.038 -.744 .458
Fruit & Vegetable attitudes .130 .054 .118 2.403 .018
Past fruit and vegetable
consumption .834 .064 .741 13.072 .000
Fruit & Vegetable intentions .055 .035 .092 1.586 .115
a. Dependent Variable: Short Answer 2: Fruit & Vegetable consumption
Correlations
Short
Answer 2:
Fruit &
Vegetable
consumption
Fruit &
Vegetable
Knowledge
Fruit &
Vegetable
attitudes
Past fruit
and
vegetable
consumption
Fruit &
Vegetable
intentions
Short Answer 2: Fruit
& Vegetable
consumption
Pearson
Correlation 1 -.126 .238** .812** .480**
Sig. (2-tailed) .129 .004 .000 .000
N 150 147 147 150 148
Fruit & Vegetable
Knowledge
Pearson
Correlation -.126 1 -.136 -.067 -.255**
Sig. (2-tailed) .129 .103 .422 .002
N 147 147 145 147 147
⊘ This is a preview!⊘
Do you want full access?
Subscribe today to unlock all pages.
Trusted by 1+ million students worldwide
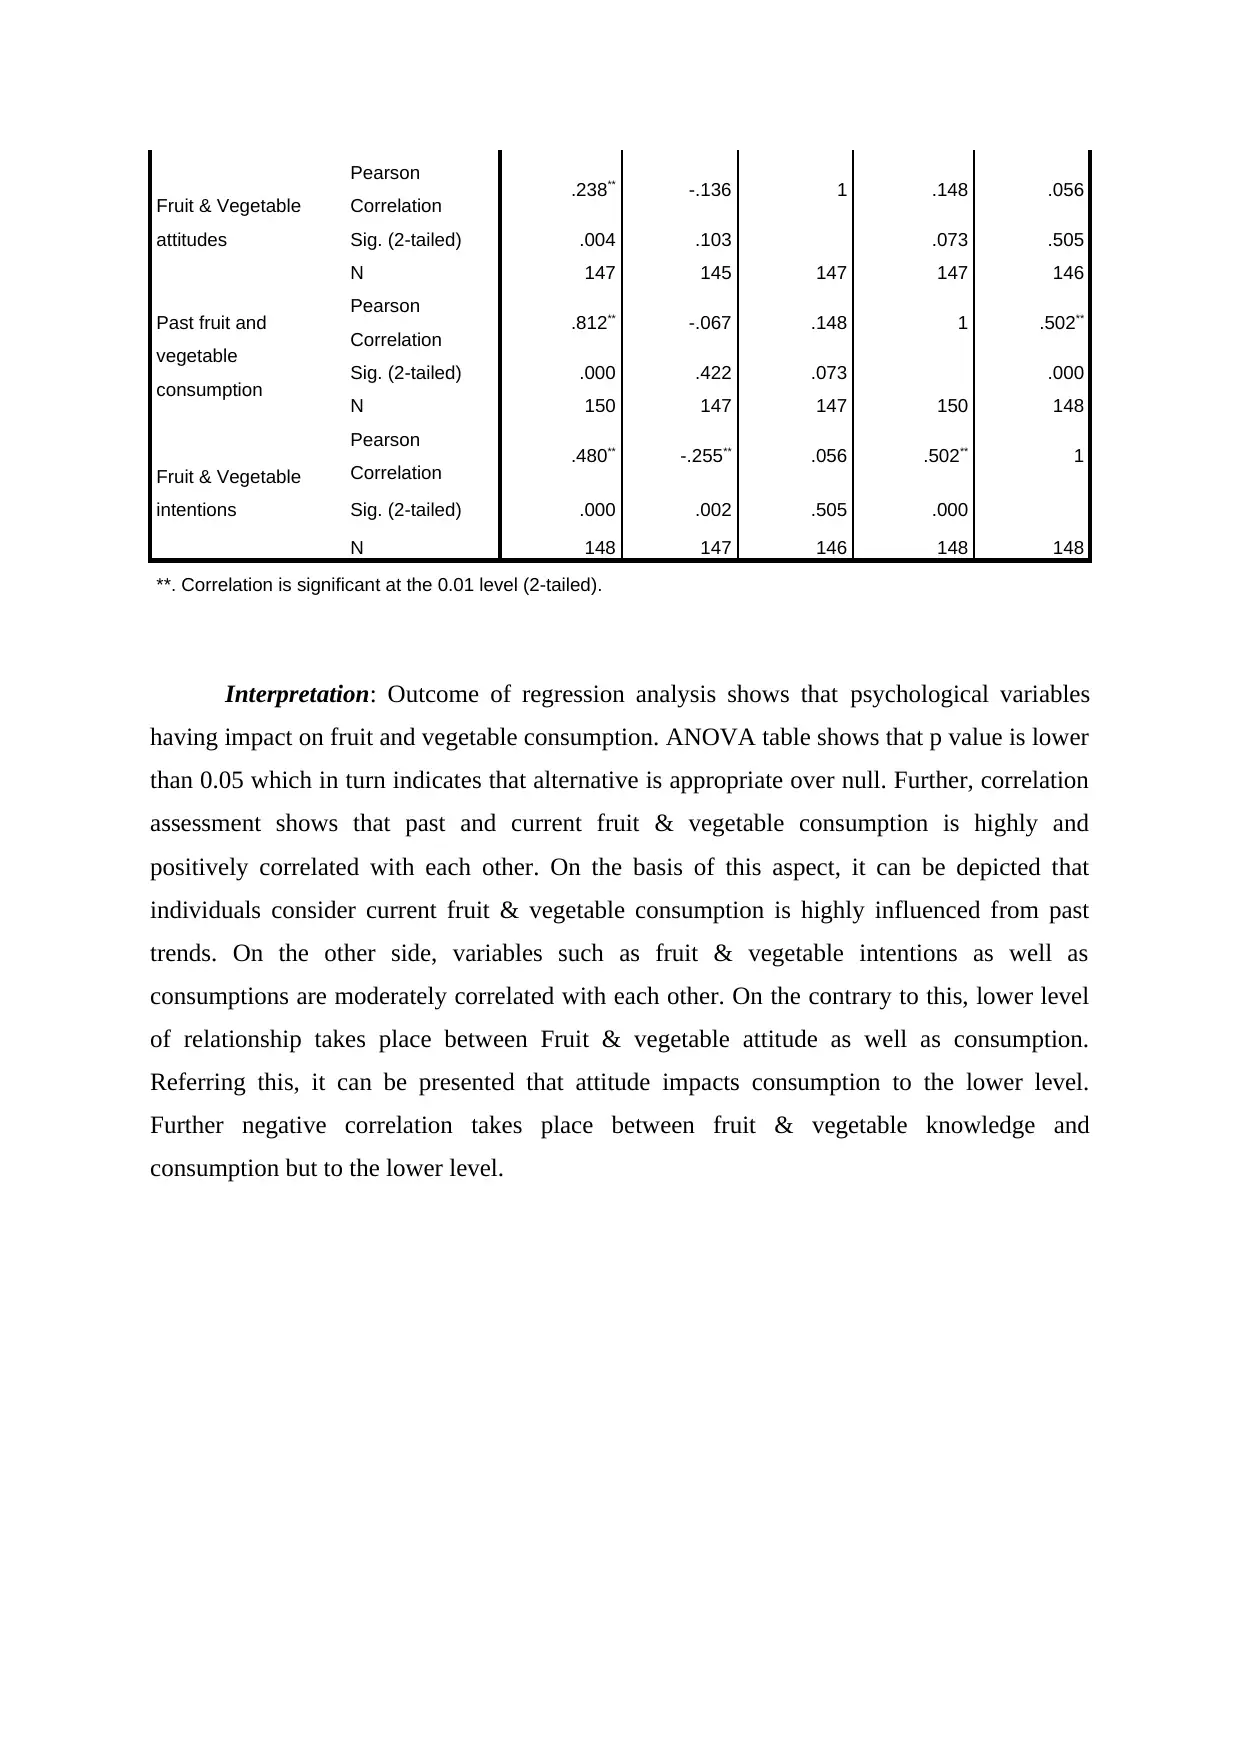
Fruit & Vegetable
attitudes
Pearson
Correlation .238** -.136 1 .148 .056
Sig. (2-tailed) .004 .103 .073 .505
N 147 145 147 147 146
Past fruit and
vegetable
consumption
Pearson
Correlation .812** -.067 .148 1 .502**
Sig. (2-tailed) .000 .422 .073 .000
N 150 147 147 150 148
Fruit & Vegetable
intentions
Pearson
Correlation .480** -.255** .056 .502** 1
Sig. (2-tailed) .000 .002 .505 .000
N 148 147 146 148 148
**. Correlation is significant at the 0.01 level (2-tailed).
Interpretation: Outcome of regression analysis shows that psychological variables
having impact on fruit and vegetable consumption. ANOVA table shows that p value is lower
than 0.05 which in turn indicates that alternative is appropriate over null. Further, correlation
assessment shows that past and current fruit & vegetable consumption is highly and
positively correlated with each other. On the basis of this aspect, it can be depicted that
individuals consider current fruit & vegetable consumption is highly influenced from past
trends. On the other side, variables such as fruit & vegetable intentions as well as
consumptions are moderately correlated with each other. On the contrary to this, lower level
of relationship takes place between Fruit & vegetable attitude as well as consumption.
Referring this, it can be presented that attitude impacts consumption to the lower level.
Further negative correlation takes place between fruit & vegetable knowledge and
consumption but to the lower level.
1 out of 10

Your All-in-One AI-Powered Toolkit for Academic Success.
+13062052269
info@desklib.com
Available 24*7 on WhatsApp / Email
![[object Object]](/_next/static/media/star-bottom.7253800d.svg)
Unlock your academic potential
Copyright © 2020–2026 A2Z Services. All Rights Reserved. Developed and managed by ZUCOL.