Statistical Analysis of Football Data: Points/Game and Yards/Game
VerifiedAdded on 2022/12/14
|3
|452
|88
Homework Assignment
AI Summary
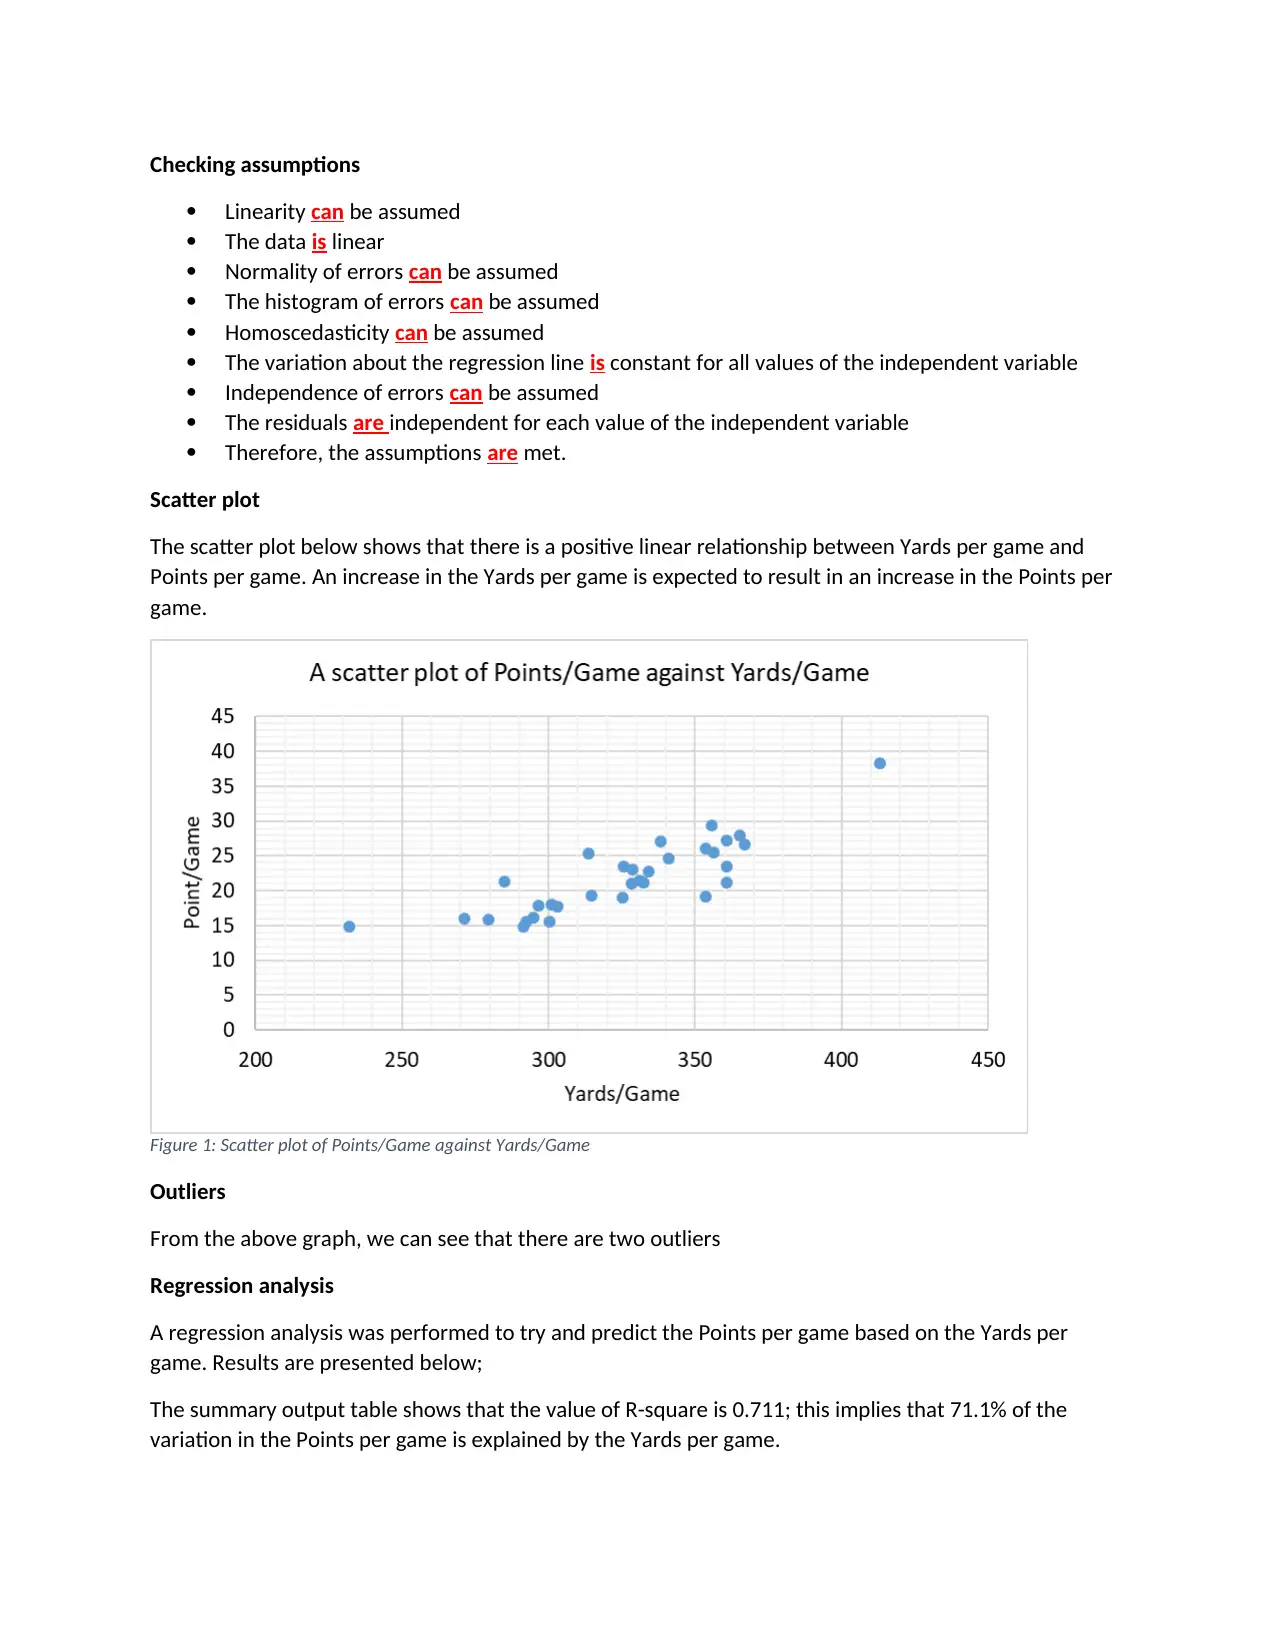
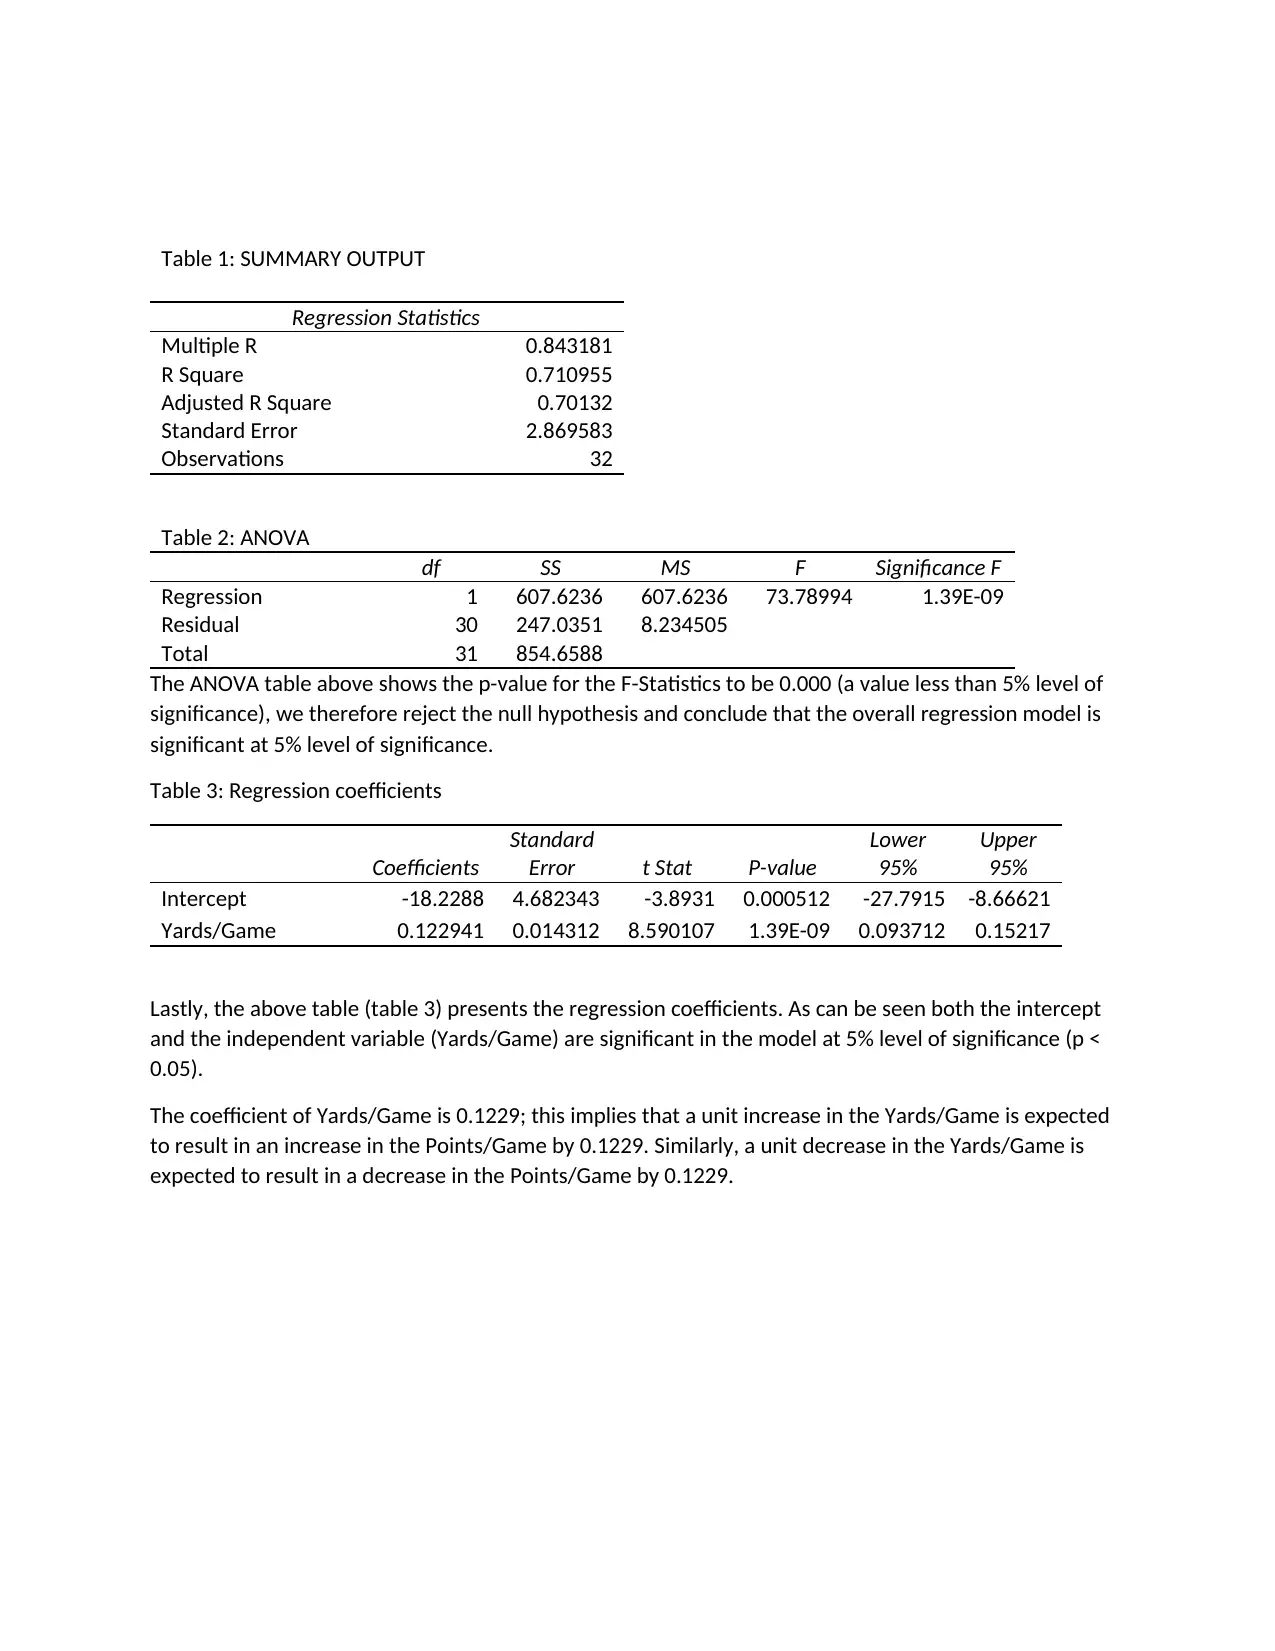
This assignment presents a statistical analysis of football data, specifically examining the relationship between points per game and yards per game. The analysis begins with a check of assumptions, confirming linearity, normality of errors, homoscedasticity, and independence of errors. A scatter plot reveals a positive linear relationship, followed by the identification of outliers. Regression analysis is performed to predict points per game based on yards per game, with an R-squared value of 0.711 indicating that 71.1% of the variation in points per game is explained by yards per game. The ANOVA table confirms the significance of the overall regression model. Finally, the regression coefficients are analyzed, showing that both the intercept and the independent variable (yards per game) are significant at the 5% level, with a unit increase in yards per game expected to increase points per game by 0.1229. The assignment includes tables summarizing the regression statistics, ANOVA results, and regression coefficients.
1 out of 3
Related Documents


Your All-in-One AI-Powered Toolkit for Academic Success.
+13062052269
info@desklib.com
Available 24*7 on WhatsApp / Email
![[object Object]](/_next/static/media/star-bottom.7253800d.svg)
Copyright © 2020–2026 A2Z Services. All Rights Reserved. Developed and managed by ZUCOL.