Statistical Tools and Their Application in Business Decisions - Report

Verified

Added on  2020/06/05

|7
|693
|105
Homework Assignment
AI Summary
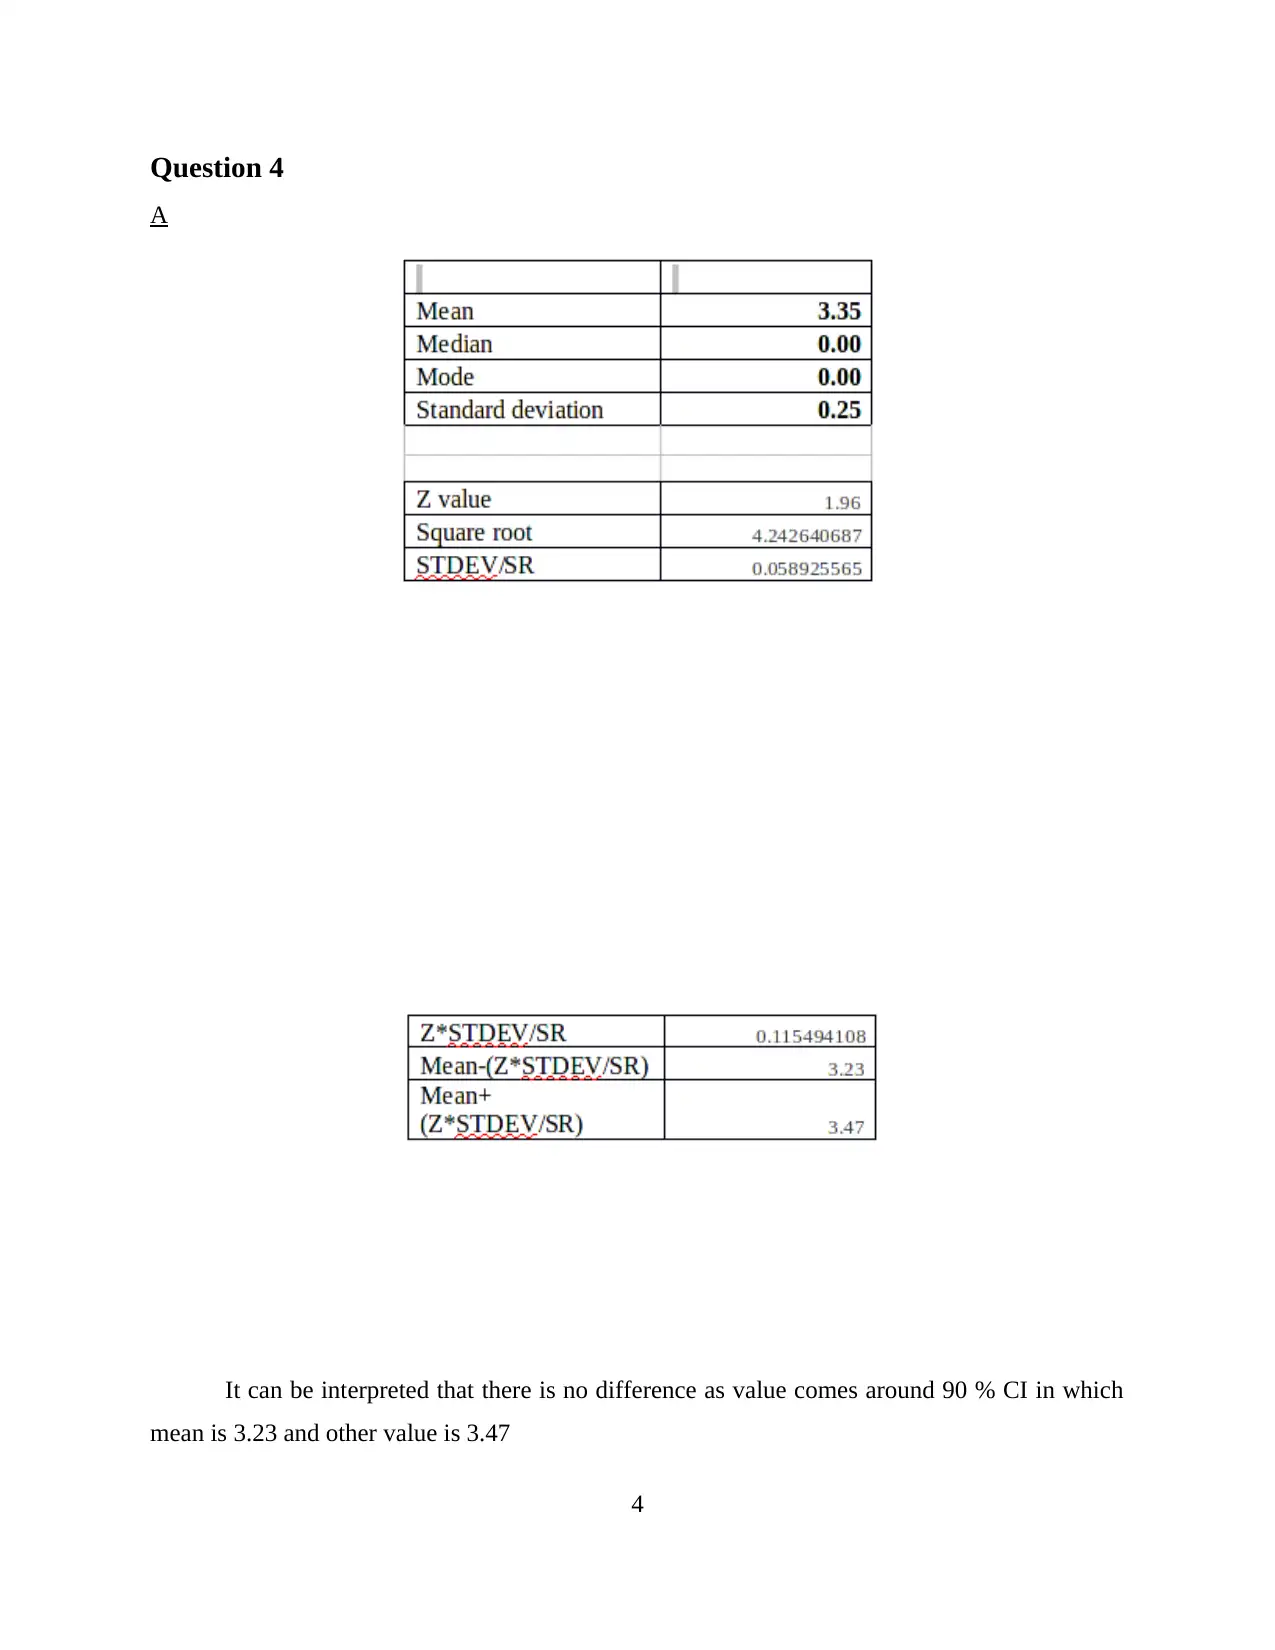
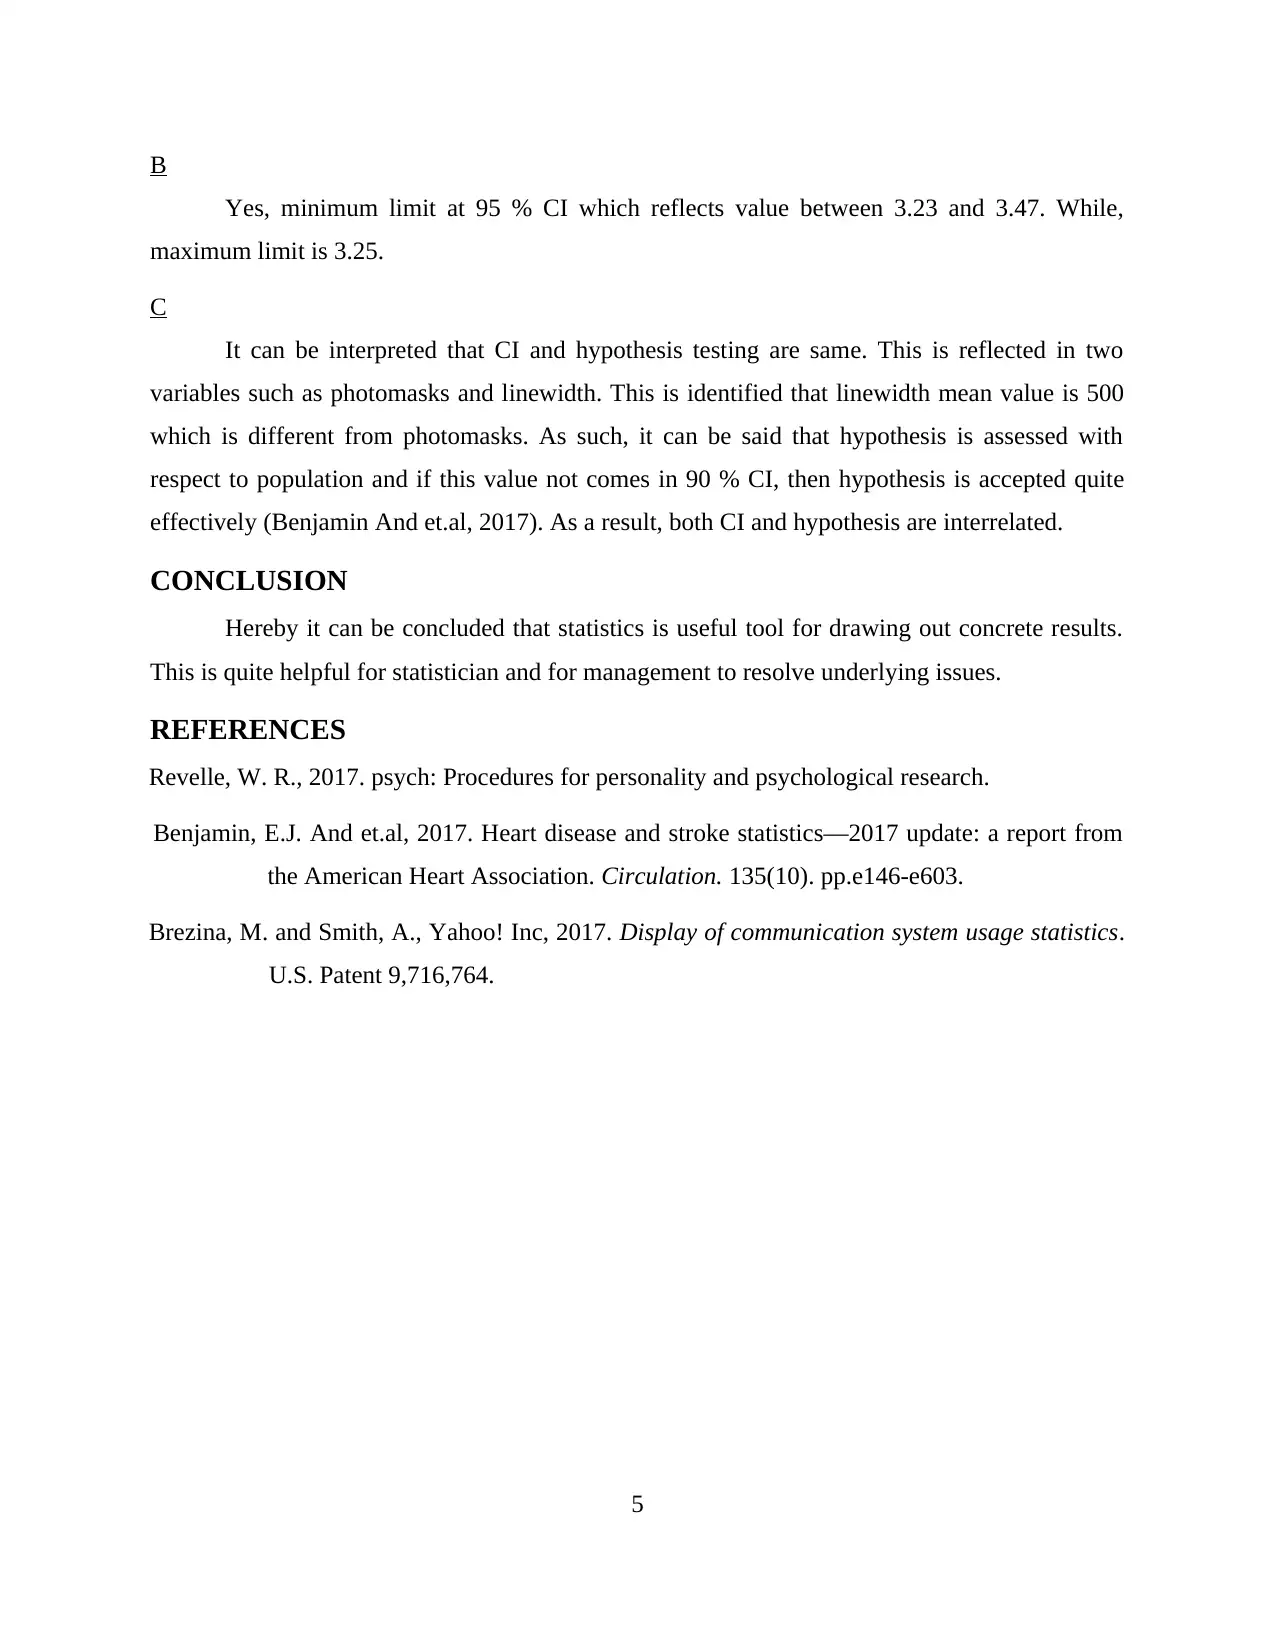
This report delves into the application of statistical tools in business decision-making. It begins with an introduction emphasizing the importance of statistics in management, followed by an analysis of four key questions. The first question examines mean, median, and mode, highlighting their strengths and weaknesses, and discusses data asymmetry. The second question explores normal distribution, standard error, and confidence intervals. The third question analyzes the significance of differences between variables, R-squared values, and the impact of quality changes on price. The fourth question compares confidence intervals with hypothesis testing. The conclusion summarizes the utility of statistics for drawing concrete results and aiding both statisticians and management in resolving underlying issues. The report references relevant sources to support its findings.
Document Page
4 questions
tabler-icon-diamond-filled.svg

Paraphrase This Document

Need a fresh take? Get an instant paraphrase of this document with our AI Paraphraser
Document Page
TABLE OF CONTENTS
INTRODUCTION...........................................................................................................................1
Question 1........................................................................................................................................1
A.............................................................................................................................................1
B.............................................................................................................................................1
C.............................................................................................................................................1
D.............................................................................................................................................1
Question 2........................................................................................................................................1
A.............................................................................................................................................1
..........................................................................................................................................................2
B.............................................................................................................................................2
C.............................................................................................................................................2
D.............................................................................................................................................3
Question 3........................................................................................................................................3
A.............................................................................................................................................3
B.............................................................................................................................................3
C.............................................................................................................................................3
Question 4 .......................................................................................................................................4
A.............................................................................................................................................4
B.............................................................................................................................................5
C.............................................................................................................................................5
CONCLUSION................................................................................................................................5
REFERENCES................................................................................................................................5
Document Page
INTRODUCTION
Statistical tools are important for management of the company as it has various tools that
help and assist managers to take vibrant decisions. The present report deals with statistical tools
for making strong decisions.
Question 1
A
B
All the mean value of 4 quizes meet each other. As such, mean value of quiz 1 and 2 is 72
and rest two have 76 each.
C
Strength of mean is that variables are highlighted. On the other hand, weakness is that it
does not clarify values apart from mean (Revelle, 2017). Median equally divides data set in two
parts. While weakness is that trends are not showed by it. Mode occurs most frequently in whole
data. On the other hand, weakness is that value must repeat in data else, mode will be zero.
D
Bell shape is not formed as data is asymmetric and not skewed.
Question 2
A
1
Document Page
B
Normally distribution can not be formed from the table as it covers only 19 % data.
C
2
tabler-icon-diamond-filled.svg

Paraphrase This Document

Need a fresh take? Get an instant paraphrase of this document with our AI Paraphraser
Document Page
It can be interpreted from the above calculation that standard error amounts to +/- 0.3.
Moreover, CI (Confidence Interval) is 90 % and sample size is 2.46. Small sample size is
reflected which is not high as deviation must be around 0.3 points.
D
Distribution of data is required to be understand by Planter. On such basis, it can be
assessed how to calculate probability of event that might occur. As such, Planter should use
normal distribution probability or other method for calculation (Brezina and Smith, 2017).
Question 3
A
It can be interpreted that there is significant difference between variables. This is
reflected as value of P is 0.00<0.05 and value of coefficient is 88.49.
B
Value of R square as computed is 0.01 that means dependent variables undergoes change,
other variable also change by 1 %.
C
It can be interpreted that value of level of significance is 0.00<0.05 which means that
with change in quality, price of goods also undergoes change.
3
Document Page
Question 4
A
It can be interpreted that there is no difference as value comes around 90 % CI in which
mean is 3.23 and other value is 3.47
4
Document Page
B
Yes, minimum limit at 95 % CI which reflects value between 3.23 and 3.47. While,
maximum limit is 3.25.
C
It can be interpreted that CI and hypothesis testing are same. This is reflected in two
variables such as photomasks and linewidth. This is identified that linewidth mean value is 500
which is different from photomasks. As such, it can be said that hypothesis is assessed with
respect to population and if this value not comes in 90 % CI, then hypothesis is accepted quite
effectively (Benjamin And et.al, 2017). As a result, both CI and hypothesis are interrelated.
CONCLUSION
Hereby it can be concluded that statistics is useful tool for drawing out concrete results.
This is quite helpful for statistician and for management to resolve underlying issues.
REFERENCES
Revelle, W. R., 2017. psych: Procedures for personality and psychological research.
Benjamin, E.J. And et.al, 2017. Heart disease and stroke statistics—2017 update: a report from
the American Heart Association. Circulation. 135(10). pp.e146-e603.
Brezina, M. and Smith, A., Yahoo! Inc, 2017. Display of communication system usage statistics.
U.S. Patent 9,716,764.
5
chevron_up_icon
1 out of 7
circle_padding
hide_on_mobile
zoom_out_icon
[object Object]