Statistics Assignment 1: Analysis of Data and Statistical Insights

Verified

Added on  2020/03/23

|12
|1106
|159
Homework Assignment
AI Summary
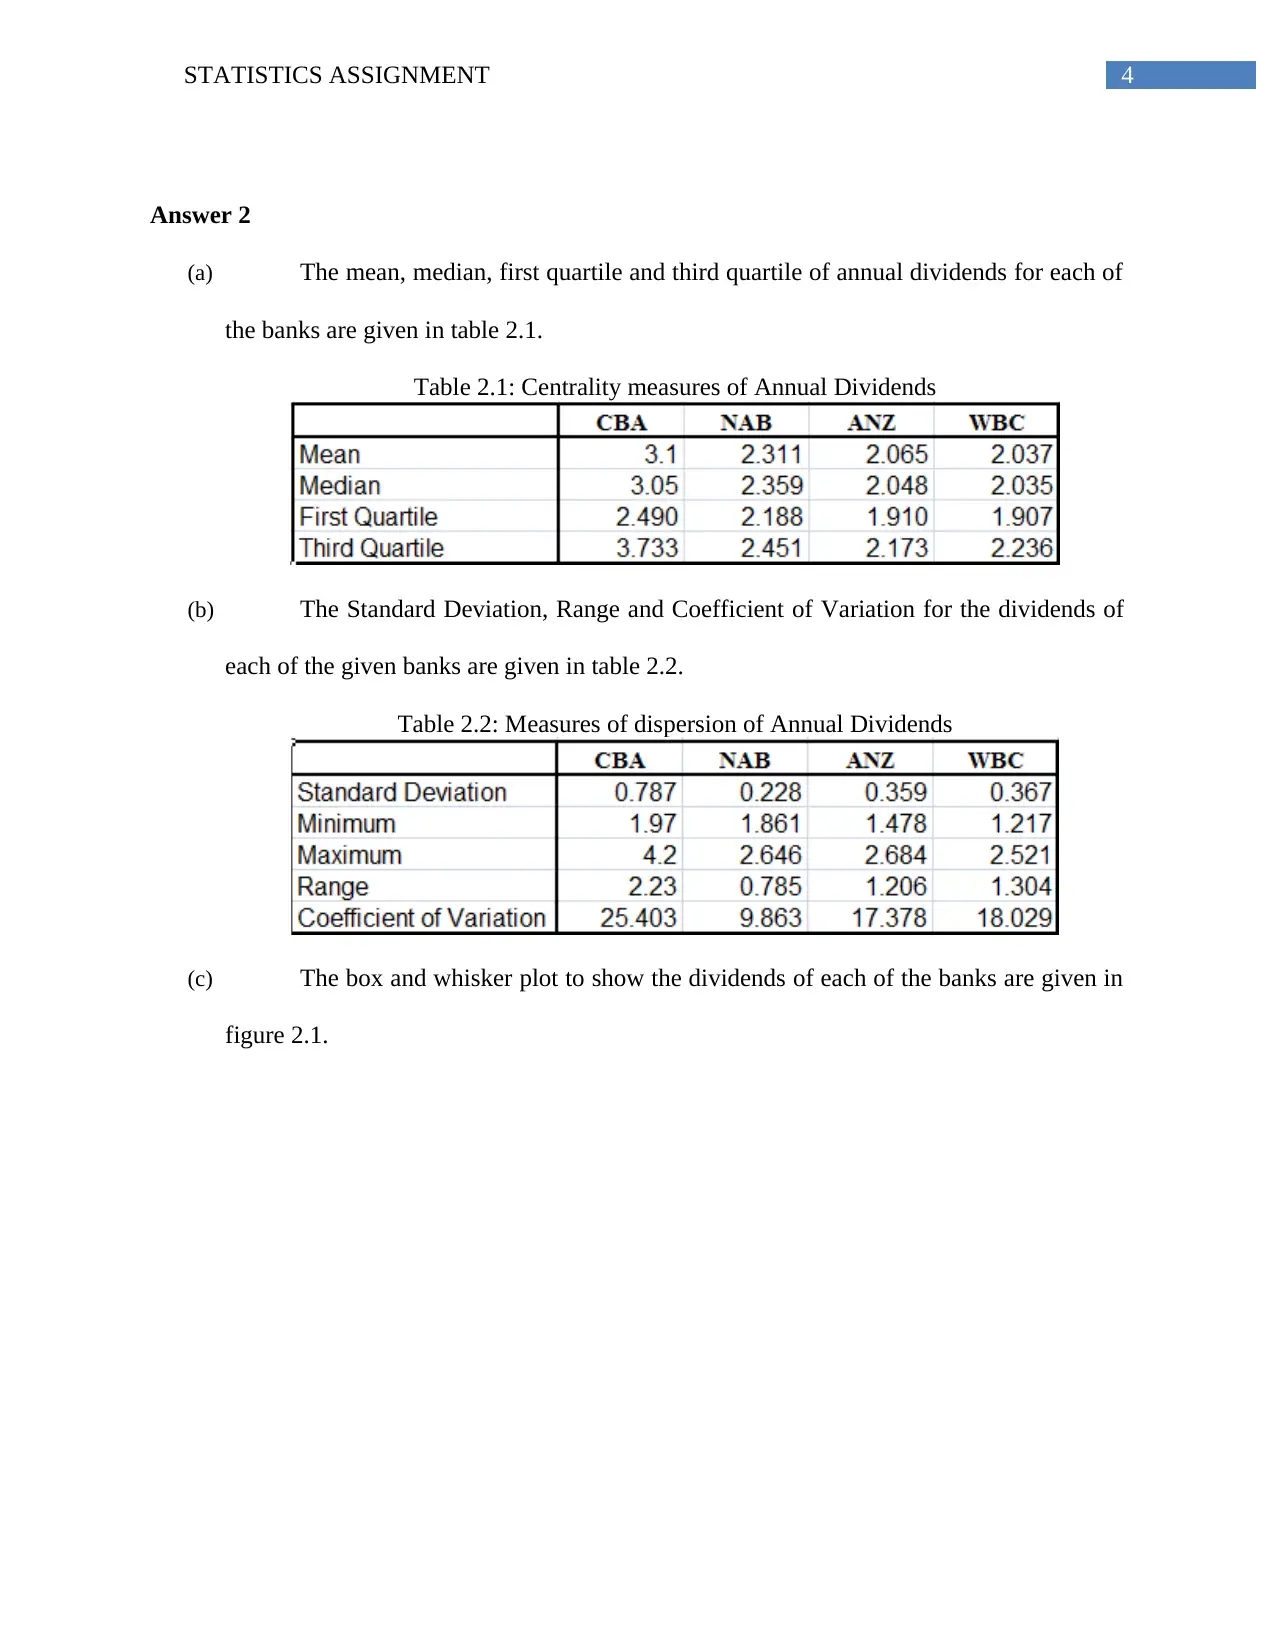
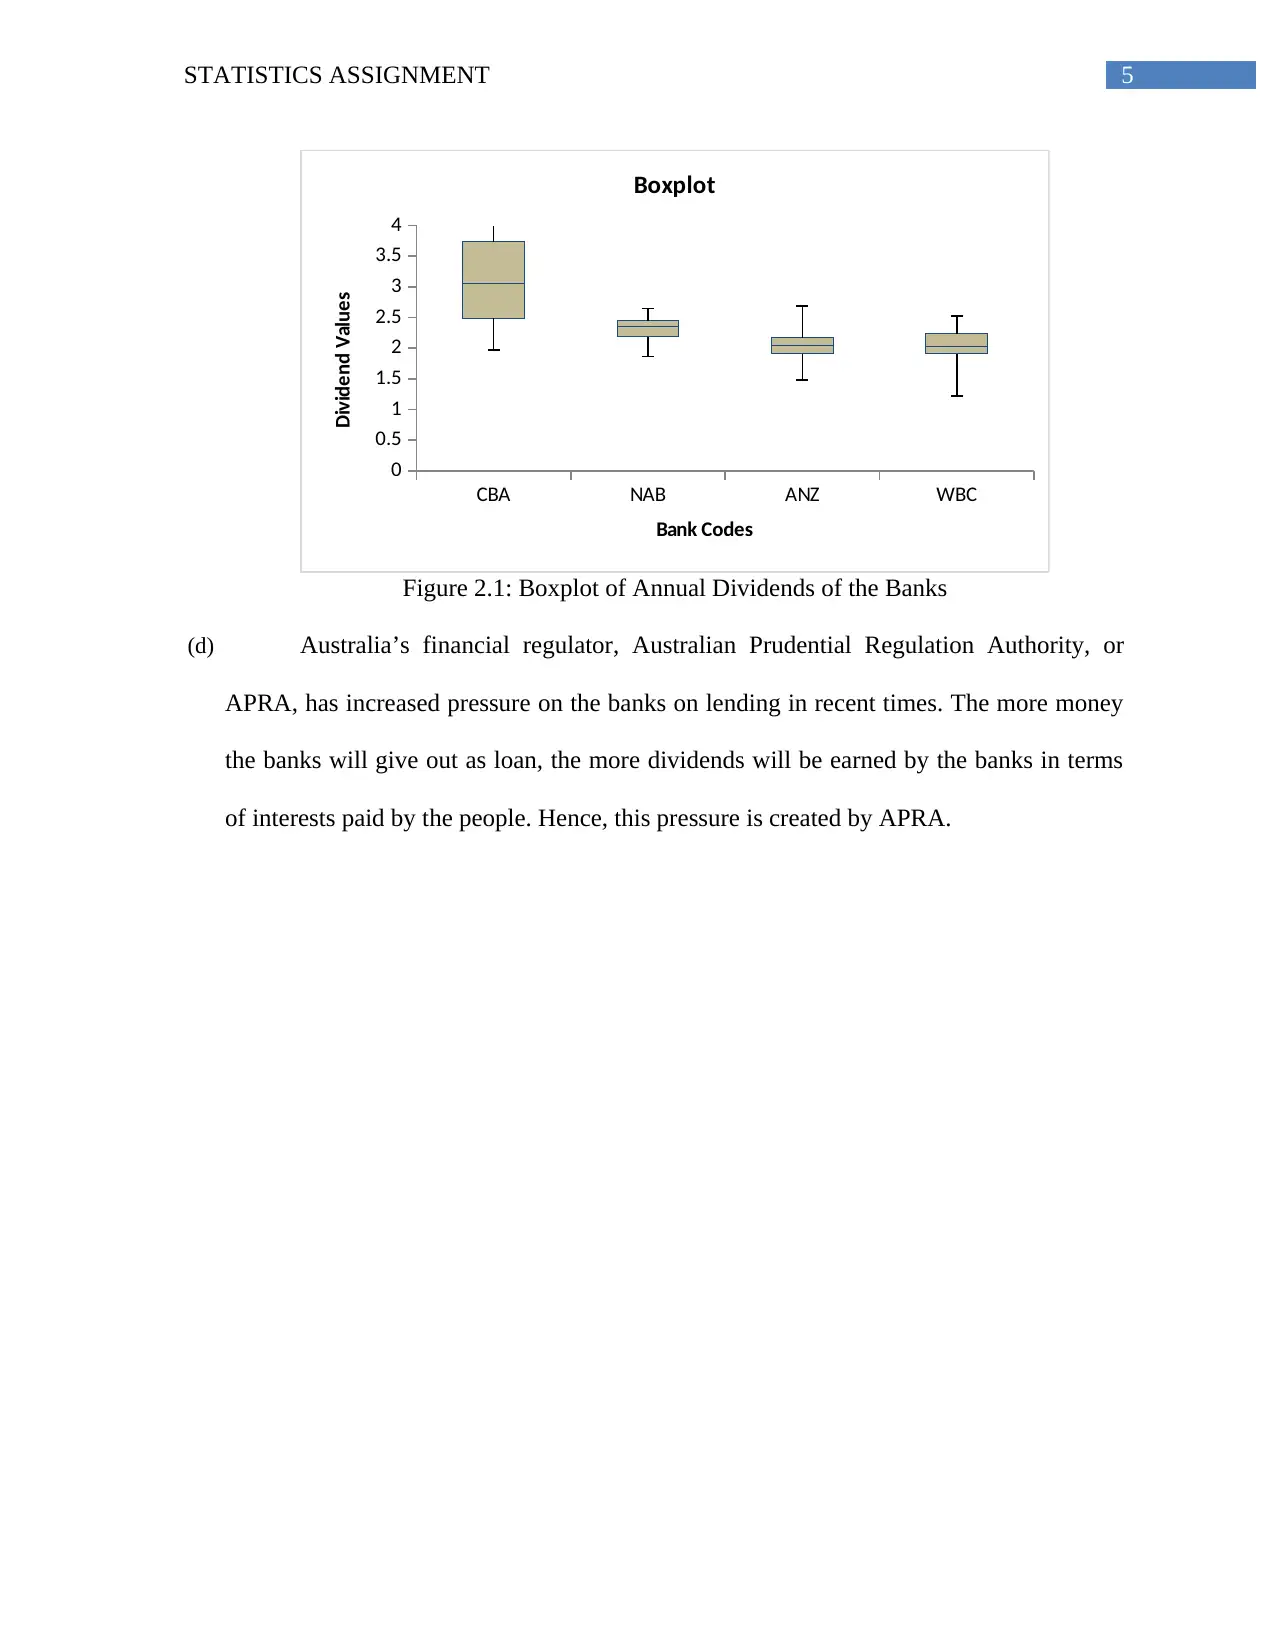
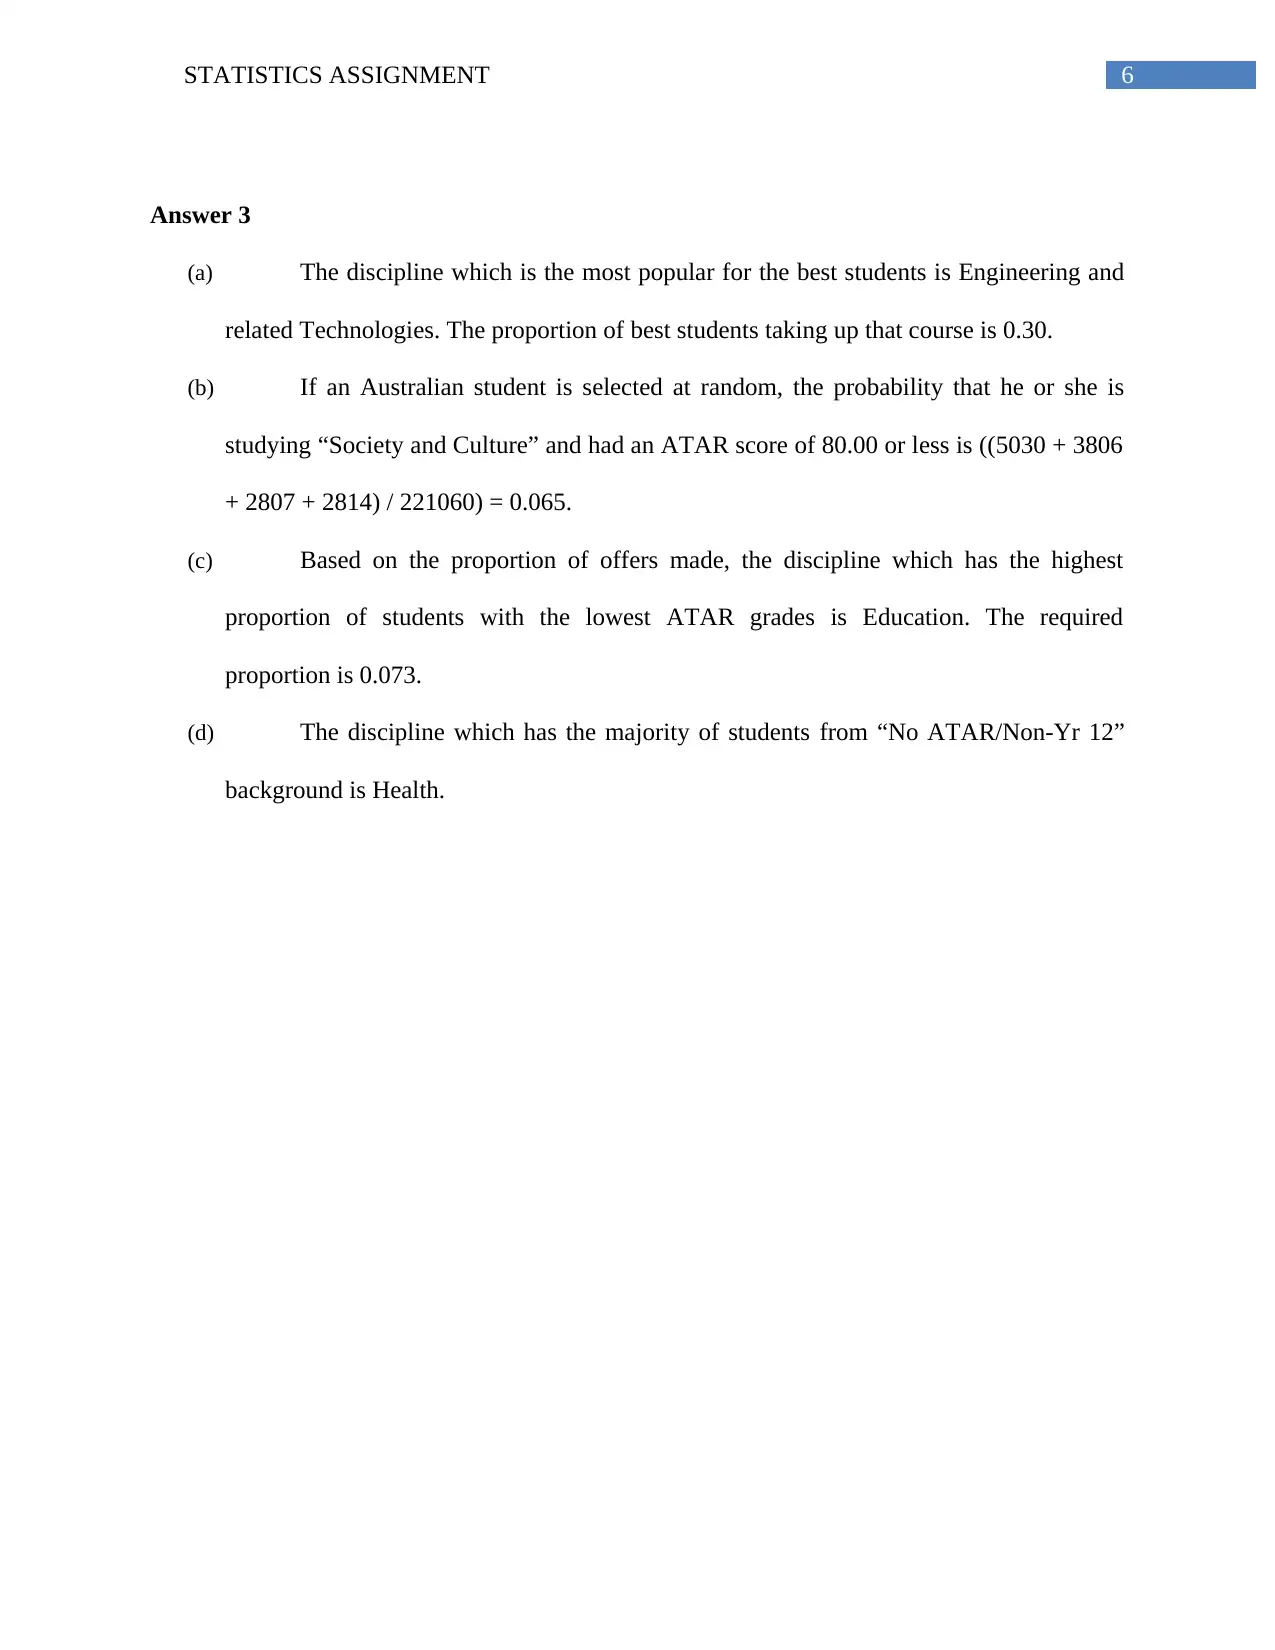
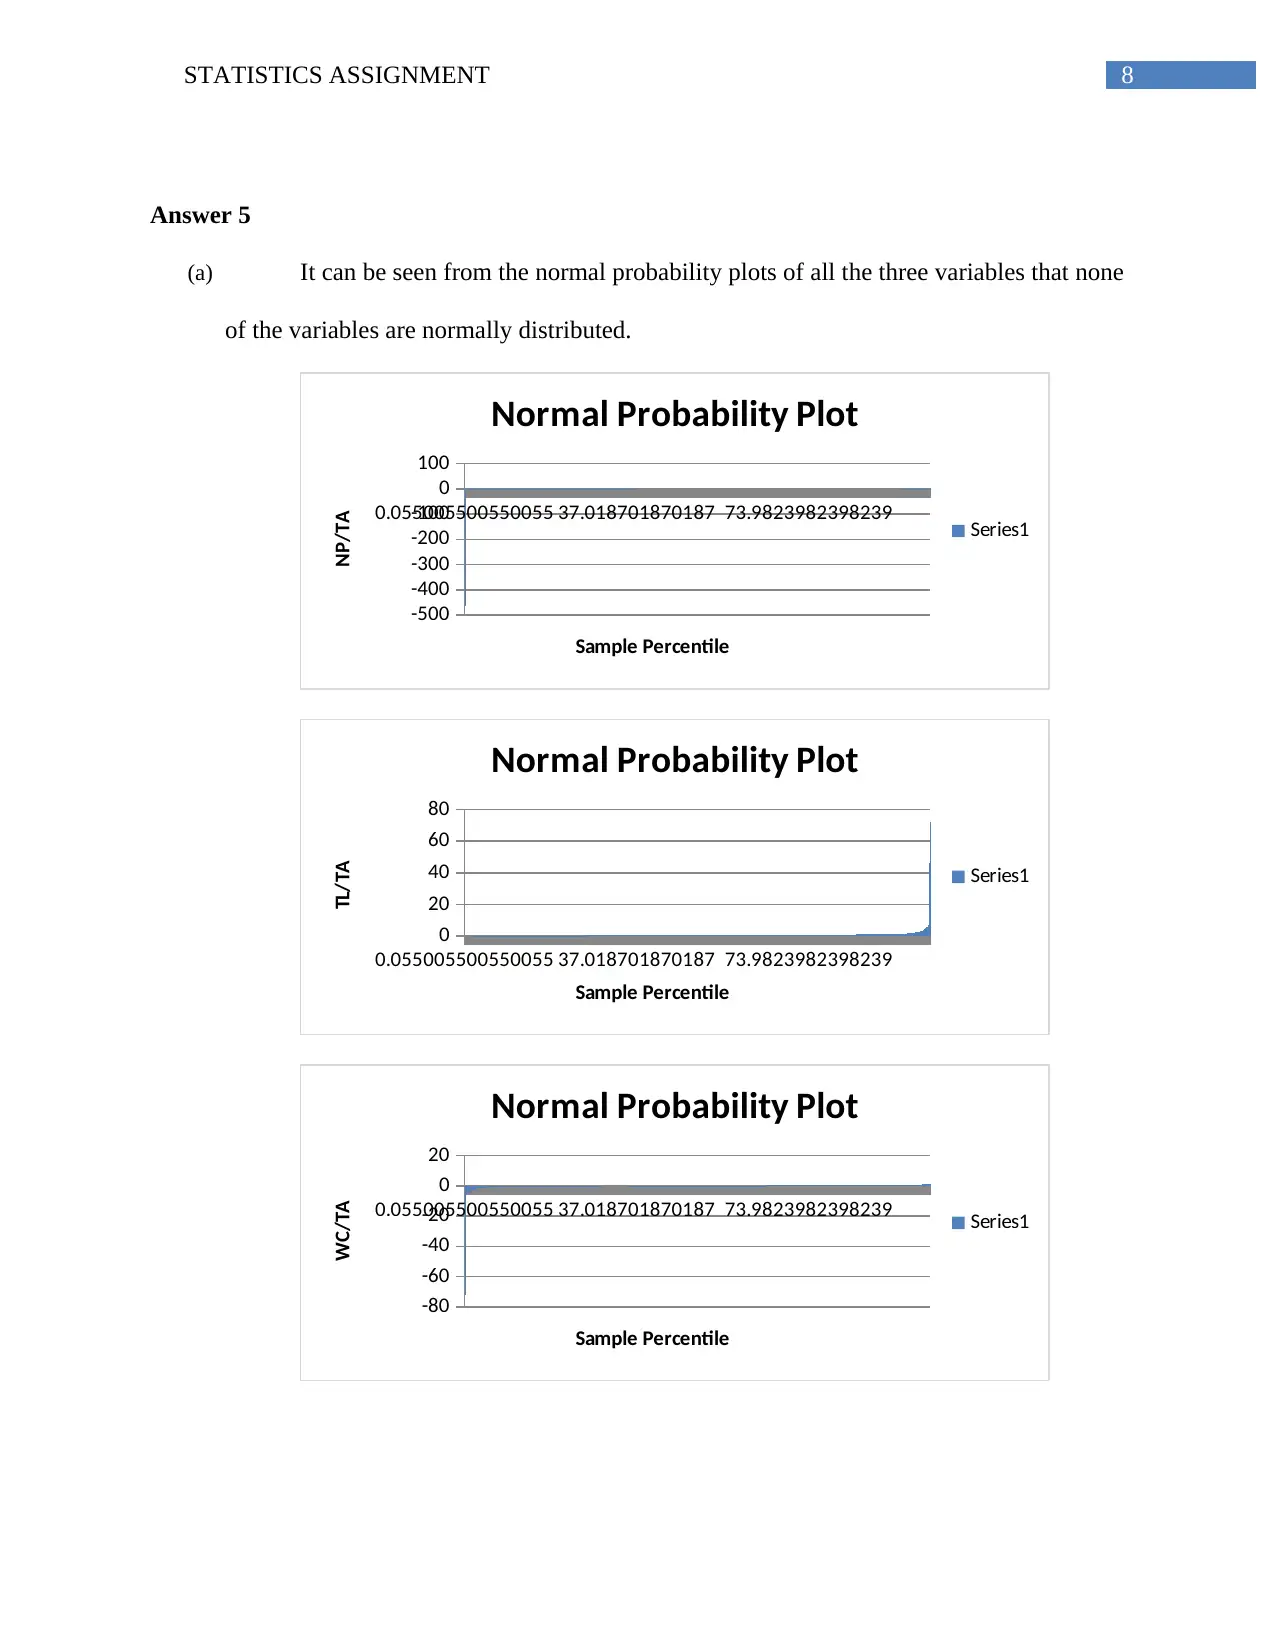
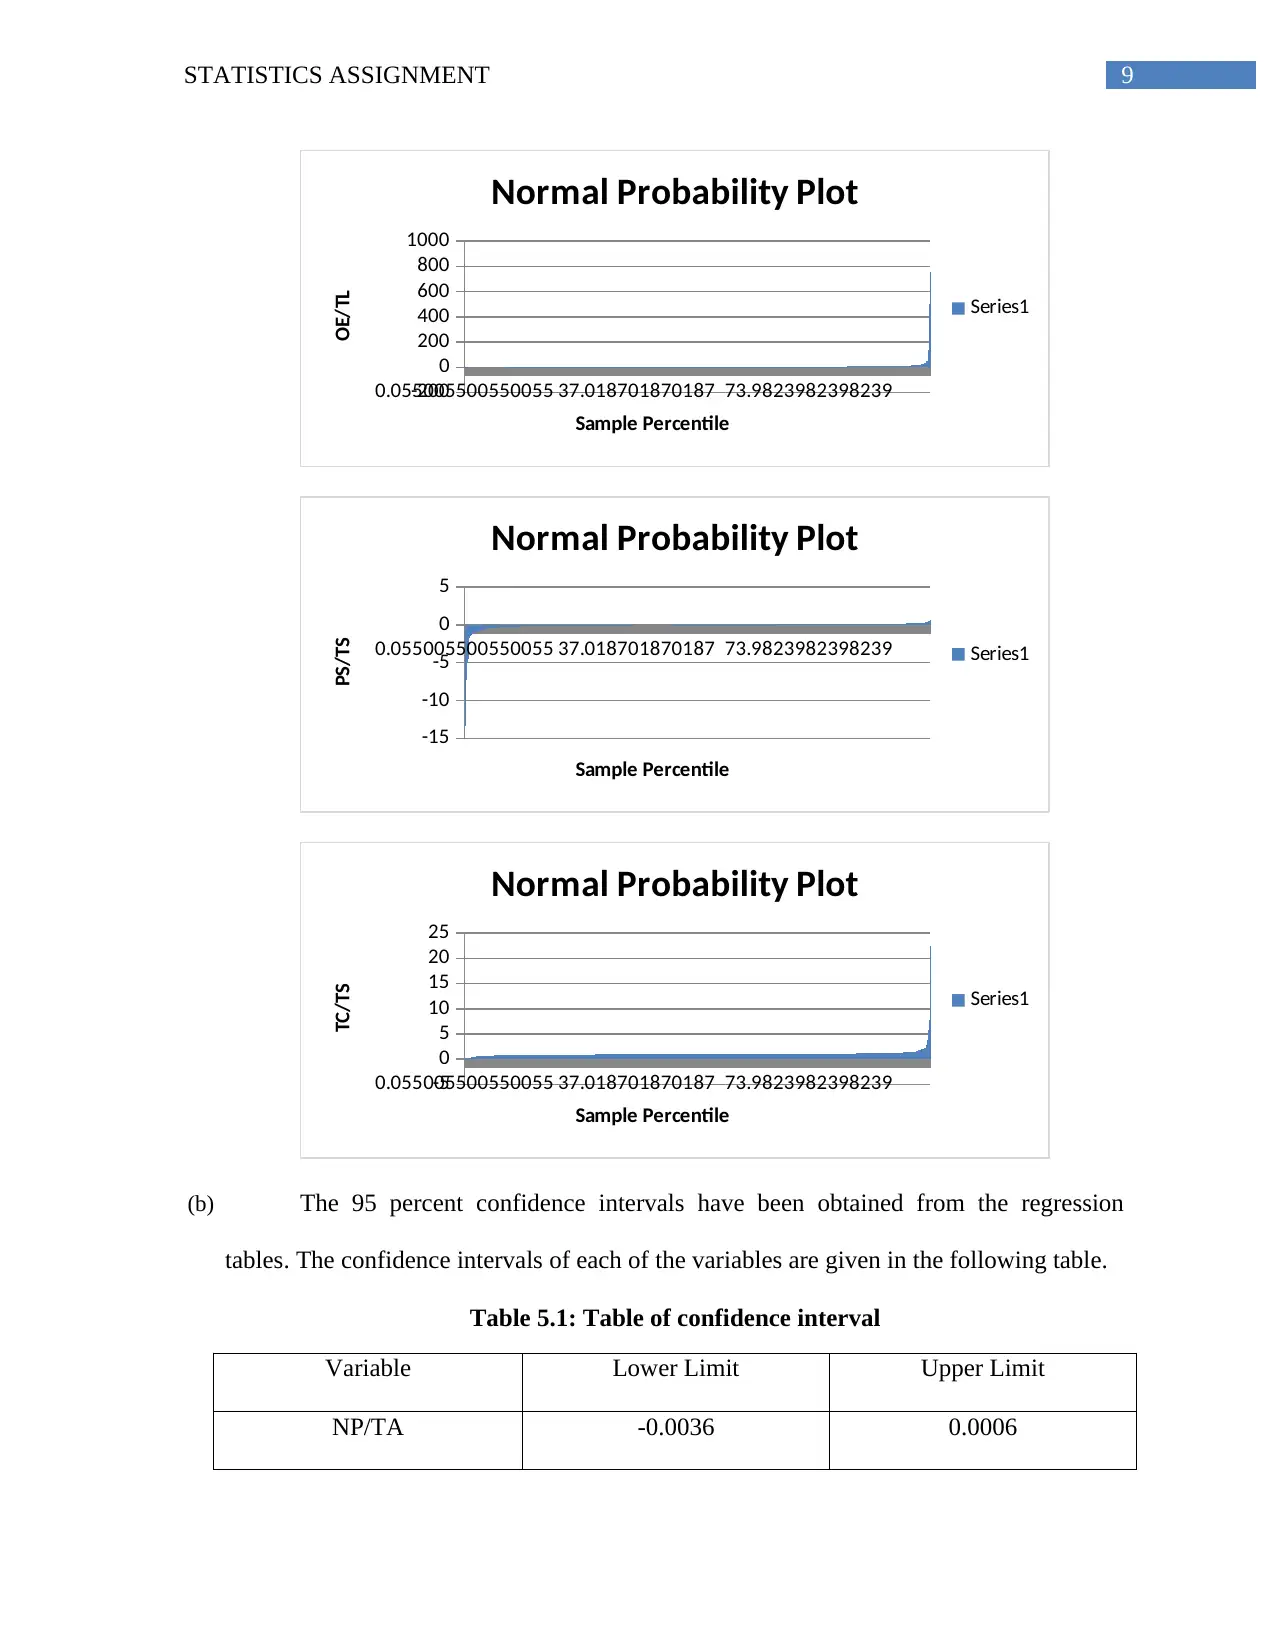
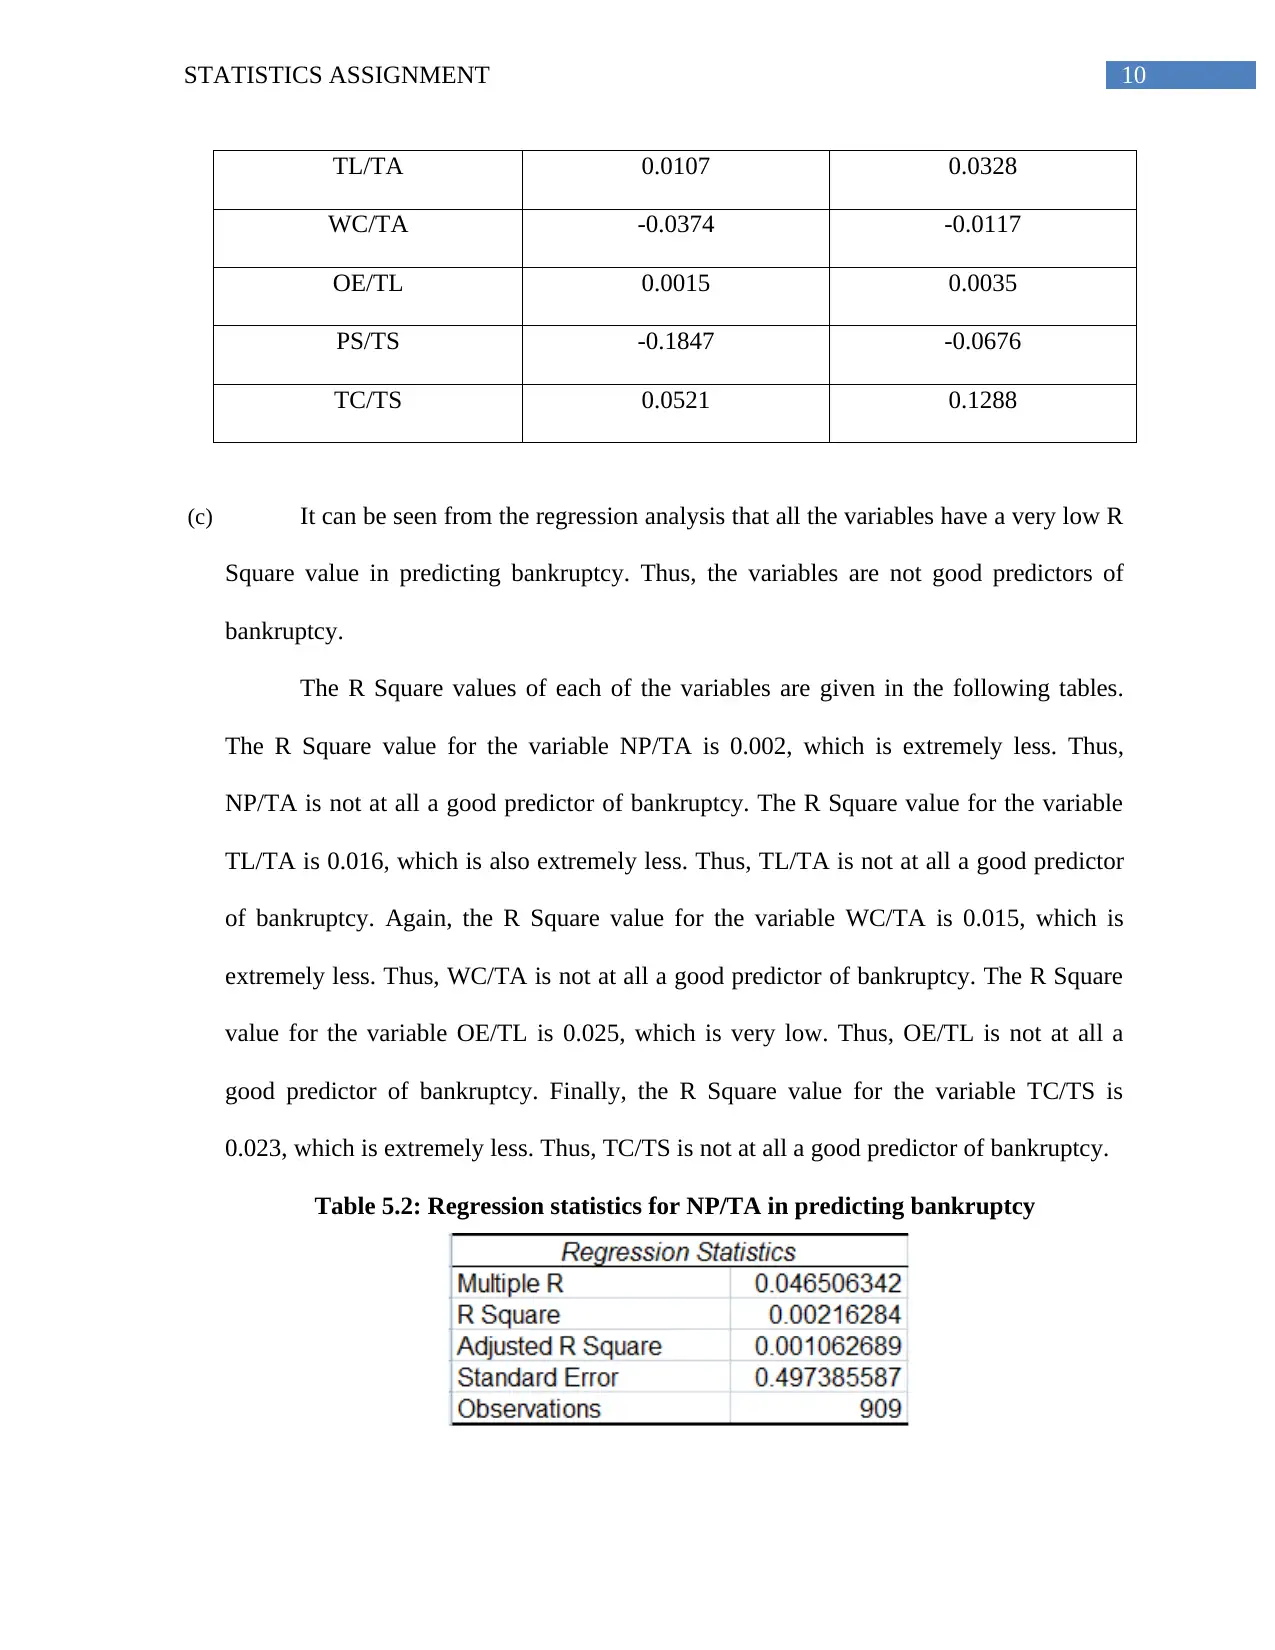
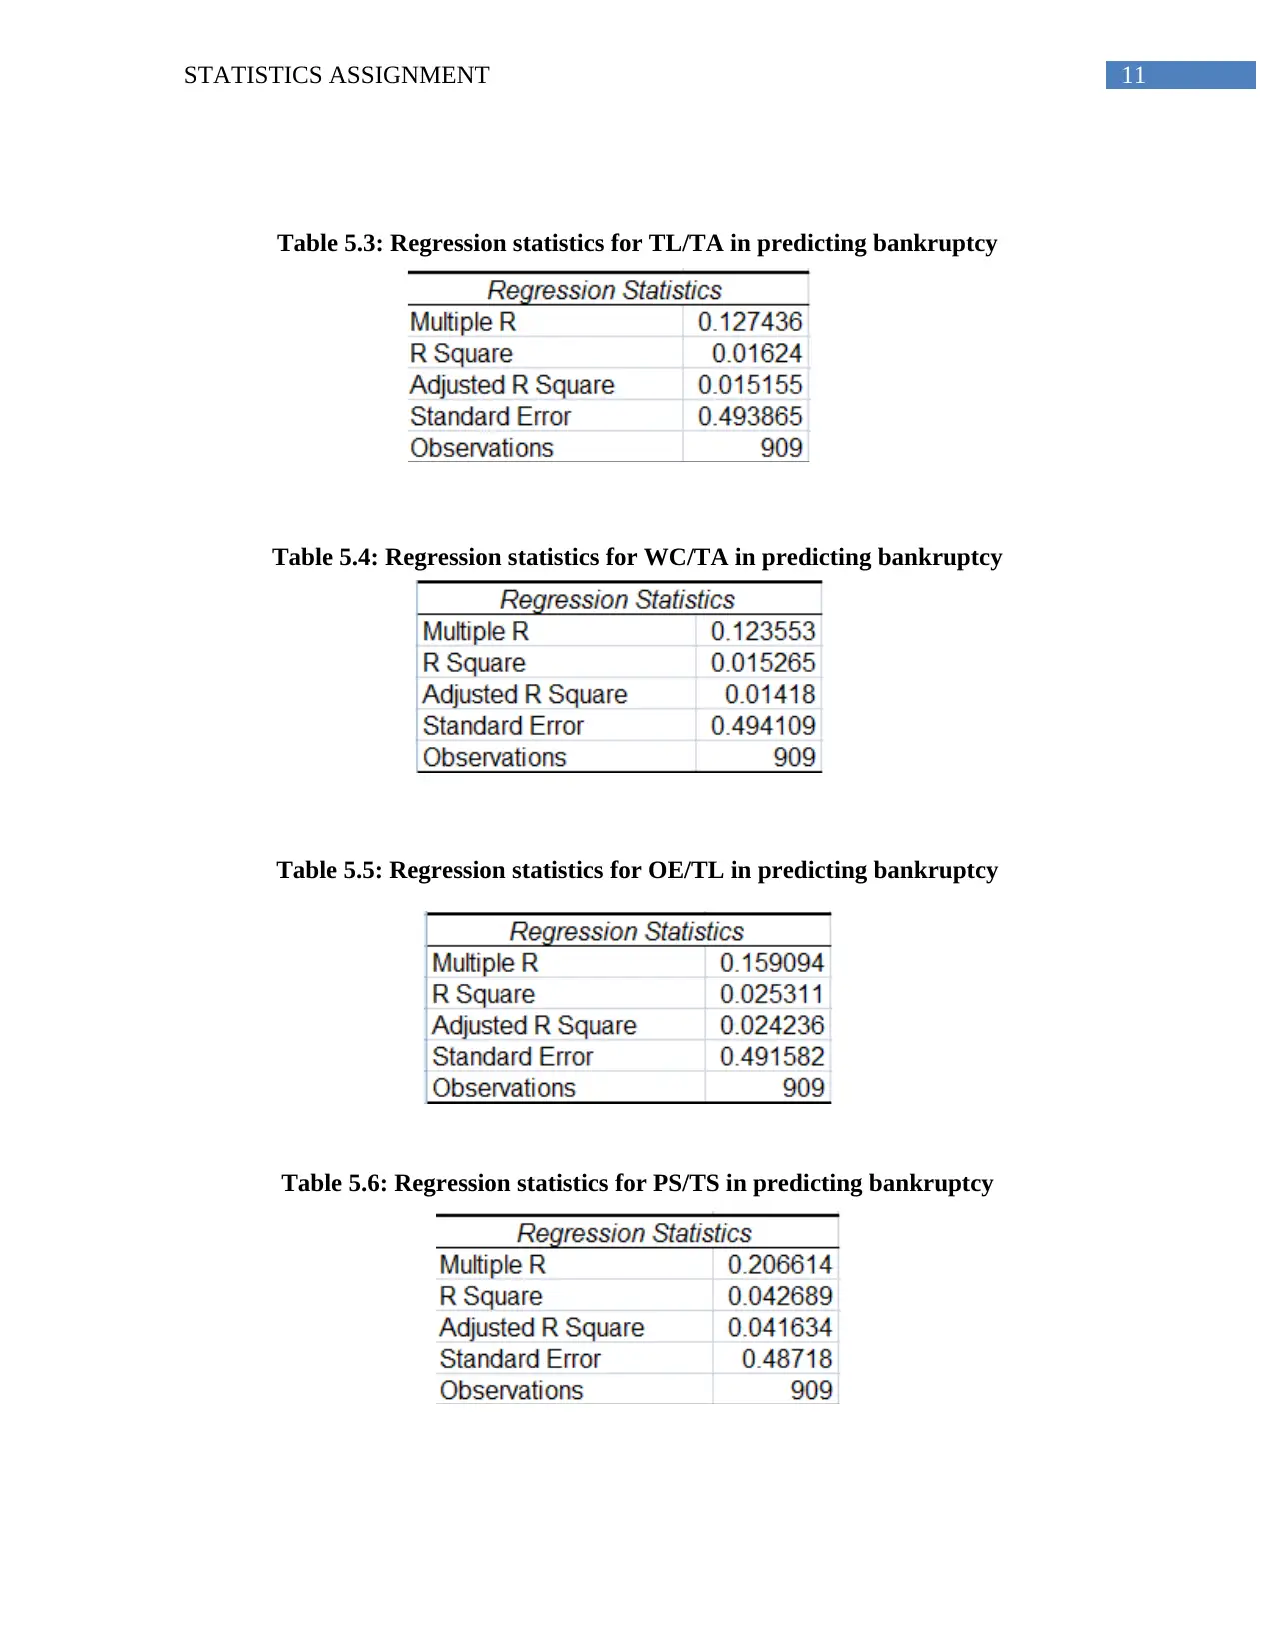
This statistics assignment comprises several analyses based on provided data. The first part involves interpreting stem-and-leaf displays and histograms to compare share prices of two companies, followed by an analysis of market capitalizations of Australian entertainment companies. The second part focuses on central tendency and dispersion measures of annual dividends for different banks, using tables and box plots. The third section explores the popularity of academic disciplines among top students and their ATAR scores. The fourth part analyzes rainfall data, calculating probabilities and using normal distribution concepts. Finally, the assignment examines regression analysis, R-squared values, and confidence intervals to predict bankruptcy using various financial variables.
tabler-icon-diamond-filled.svg

Contribute Materials

Your contribution can guide someone’s learning journey. Share your documents today.
Document Page
Running Head: STATISTICS ASSIGNMENT
Statistics Assignment
Name of the Student
Name of the University
Author Note
tabler-icon-diamond-filled.svg

Secure Best Marks with AI Grader

Need help grading? Try our AI Grader for instant feedback on your assignments.
Document Page
1STATISTICS ASSIGNMENT
Table of Contents
Answer 1..........................................................................................................................................2
Answer 2..........................................................................................................................................4
Answer 3..........................................................................................................................................6
Answer 4..........................................................................................................................................7
Answer 5..........................................................................................................................................8
Document Page
2STATISTICS ASSIGNMENT
Answer 1
(a) In the stem and leaf display in table 1.1, the quarterly opening price values for the
two companies CWN (Crown Resorts Limited) and TAH (Tabcorp Holdings Limited)
have been displayed with the stem values in the middle and the leaf values for CWN in
the right and TAH on the left side of the stem values.
(b) The relative frequency histogram for CWN and frequency polygon for TAH is
shown in figure 1.1.
0-
2.00 2.00-
4.00 4.00-
6.00 6.00-
8.00 8.00-
10.00 10.00
-
12.00
12.00
-
14.00
14.00
-
16.00
more
than
16.00
0
0.1
0.2
0.3
0.4
0.5
0.6
0.7
0.8
Relative Frequency of opening share
prices of CWN and TAH
CWN
TAH
Class Width
Share Prices
Figure 1.1: Opening share price values of CWN and TAH
Document Page
3STATISTICS ASSIGNMENT
(c) A bar chart showing the market capitals in 2016 of 5 companies listed in ASX
that deals with leisure and entertainment is given in figure 1.2. All the companies
considered here is over AUD500 million in market capital.
ALL CWN FLT REA TTS
0
2,000,000,000
4,000,000,000
6,000,000,000
8,000,000,000
10,000,000,000
12,000,000,000
14,000,000,000
16,000,000,000
Market Cap
Market Cap
Company Code
Market Capital Value
Figure 1.2: Market capital values of 5 Australian Entertainment Companies
(d) Based on the research of the two companies CWN and TAH, it can be said that
the share prices of CWN is a lot higher than that of TAH. It can also be seen that the
share prices of TAH has been decreasing continually. Thus, it would be better to invest in
CWN.
tabler-icon-diamond-filled.svg

Secure Best Marks with AI Grader

Need help grading? Try our AI Grader for instant feedback on your assignments.
Document Page
4STATISTICS ASSIGNMENT
Answer 2
(a) The mean, median, first quartile and third quartile of annual dividends for each of
the banks are given in table 2.1.
Table 2.1: Centrality measures of Annual Dividends
(b) The Standard Deviation, Range and Coefficient of Variation for the dividends of
each of the given banks are given in table 2.2.
Table 2.2: Measures of dispersion of Annual Dividends
(c) The box and whisker plot to show the dividends of each of the banks are given in
figure 2.1.
Document Page
5STATISTICS ASSIGNMENT
CBA NAB ANZ WBC
0
0.5
1
1.5
2
2.5
3
3.5
4
Boxplot
Bank Codes
Dividend Values
Figure 2.1: Boxplot of Annual Dividends of the Banks
(d) Australia’s financial regulator, Australian Prudential Regulation Authority, or
APRA, has increased pressure on the banks on lending in recent times. The more money
the banks will give out as loan, the more dividends will be earned by the banks in terms
of interests paid by the people. Hence, this pressure is created by APRA.
Document Page
6STATISTICS ASSIGNMENT
Answer 3
(a) The discipline which is the most popular for the best students is Engineering and
related Technologies. The proportion of best students taking up that course is 0.30.
(b) If an Australian student is selected at random, the probability that he or she is
studying “Society and Culture” and had an ATAR score of 80.00 or less is ((5030 + 3806
+ 2807 + 2814) / 221060) = 0.065.
(c) Based on the proportion of offers made, the discipline which has the highest
proportion of students with the lowest ATAR grades is Education. The required
proportion is 0.073.
(d) The discipline which has the majority of students from “No ATAR/Non-Yr 12”
background is Health.
tabler-icon-diamond-filled.svg

Paraphrase This Document

Need a fresh take? Get an instant paraphrase of this document with our AI Paraphraser
Document Page
7STATISTICS ASSIGNMENT
Answer 4
(a) (i) It can be seen from the given data that out of the 52 weeks of a year, there are 5
weeks which do not have any amount of rainfall. Thus, the probability that in a given
week there will be no rainfall is (5/52) = 0.096.
(ii) There were 33 weeks in 2016 in which two or more days of rainfall has taken
place. Thus, the probability that there will be two or more days of rainfall in a week is
(33/52) = 0.635.
(b) The mean of the weekly total amount of rainfall is 12.035 and the standard
deviation of the weekly total amount of rainfall is 14.73.
(i) The probability that there will be less than 8 mm rainfall is given by:
P (z) = P ((8 – 12.035) / 14.73) = 0.3921.
The probability that there will be less than 16 mm rainfall is given by:
P (z) = P ((16 – 12.035) / 14.73) = 0.6061.
The probability that there will be rainfall between 8 mm and 16 mm is given by (0.0601 –
0.3921) = 0.2140.
(ii) 12 percent of the weeks have 0.224 mm rainfall or higher.
Document Page
8STATISTICS ASSIGNMENT
Answer 5
(a) It can be seen from the normal probability plots of all the three variables that none
of the variables are normally distributed.
0.055005500550055 37.018701870187 73.9823982398239
-500
-400
-300
-200
-100
0
100
Normal Probability Plot
Series1
Sample Percentile
NP/TA
0.055005500550055 37.018701870187 73.9823982398239
0
20
40
60
80
Normal Probability Plot
Series1
Sample Percentile
TL/TA
0.055005500550055 37.018701870187 73.9823982398239
-80
-60
-40
-20
0
20
Normal Probability Plot
Series1
Sample Percentile
WC/TA
Document Page
9STATISTICS ASSIGNMENT
0.055005500550055 37.018701870187 73.9823982398239-200
0
200
400
600
800
1000
Normal Probability Plot
Series1
Sample Percentile
OE/TL
0.055005500550055 37.018701870187 73.9823982398239
-15
-10
-5
0
5
Normal Probability Plot
Series1
Sample Percentile
PS/TS
0.055005500550055 37.018701870187 73.9823982398239-5
0
5
10
15
20
25
Normal Probability Plot
Series1
Sample Percentile
TC/TS
(b) The 95 percent confidence intervals have been obtained from the regression
tables. The confidence intervals of each of the variables are given in the following table.
Table 5.1: Table of confidence interval
Variable Lower Limit Upper Limit
NP/TA -0.0036 0.0006
tabler-icon-diamond-filled.svg

Secure Best Marks with AI Grader

Need help grading? Try our AI Grader for instant feedback on your assignments.
Document Page
10STATISTICS ASSIGNMENT
TL/TA 0.0107 0.0328
WC/TA -0.0374 -0.0117
OE/TL 0.0015 0.0035
PS/TS -0.1847 -0.0676
TC/TS 0.0521 0.1288
(c) It can be seen from the regression analysis that all the variables have a very low R
Square value in predicting bankruptcy. Thus, the variables are not good predictors of
bankruptcy.
The R Square values of each of the variables are given in the following tables.
The R Square value for the variable NP/TA is 0.002, which is extremely less. Thus,
NP/TA is not at all a good predictor of bankruptcy. The R Square value for the variable
TL/TA is 0.016, which is also extremely less. Thus, TL/TA is not at all a good predictor
of bankruptcy. Again, the R Square value for the variable WC/TA is 0.015, which is
extremely less. Thus, WC/TA is not at all a good predictor of bankruptcy. The R Square
value for the variable OE/TL is 0.025, which is very low. Thus, OE/TL is not at all a
good predictor of bankruptcy. Finally, the R Square value for the variable TC/TS is
0.023, which is extremely less. Thus, TC/TS is not at all a good predictor of bankruptcy.
Table 5.2: Regression statistics for NP/TA in predicting bankruptcy
Document Page
11STATISTICS ASSIGNMENT
Table 5.3: Regression statistics for TL/TA in predicting bankruptcy
Table 5.4: Regression statistics for WC/TA in predicting bankruptcy
Table 5.5: Regression statistics for OE/TL in predicting bankruptcy
Table 5.6: Regression statistics for PS/TS in predicting bankruptcy
chevron_up_icon
1 out of 12
circle_padding
hide_on_mobile
zoom_out_icon
logo.png

Your All-in-One AI-Powered Toolkit for Academic Success.

Available 24*7 on WhatsApp / Email

[object Object]