Statistical Analysis Report: Cost and Sales Data (A69209)
VerifiedAdded on 2020/10/05
|14
|2316
|115
Report
AI Summary
This report presents a statistical analysis of sales and cost data, employing various statistical tools. The analysis includes descriptive statistics, confidence intervals, hypothesis testing (One-way ANOVA), and correlation and regression analysis. The report examines a sample size of 60, exploring relationships between variables such as order priority, sales, shipping costs, and order quantity. Key findings include the application of descriptive statistics to summarize the data, the use of confidence intervals to analyze true value of data, and hypothesis testing to determine the significance of the variables. The correlation and regression analysis further investigates the relationship between average sales and order quantity, and the report concludes with a summary of the findings and references to supporting literature. The analysis aims to provide insights for decision-making and understanding variations in the data.

Report For A69209
Paraphrase This Document
Need a fresh take? Get an instant paraphrase of this document with our AI Paraphraser
TABLE OF CONTENTS
EXECUTIVE SUMMARY.............................................................................................................1
INTRODUCTION...........................................................................................................................1
ANALYSIS......................................................................................................................................1
Descriptive Statistics..............................................................................................................1
Confidence Intervals...............................................................................................................2
Hypothesis Test......................................................................................................................3
Correlation and Regression....................................................................................................4
CONCLUSION................................................................................................................................5
REFERENCES................................................................................................................................6
APPENDIX......................................................................................................................................7
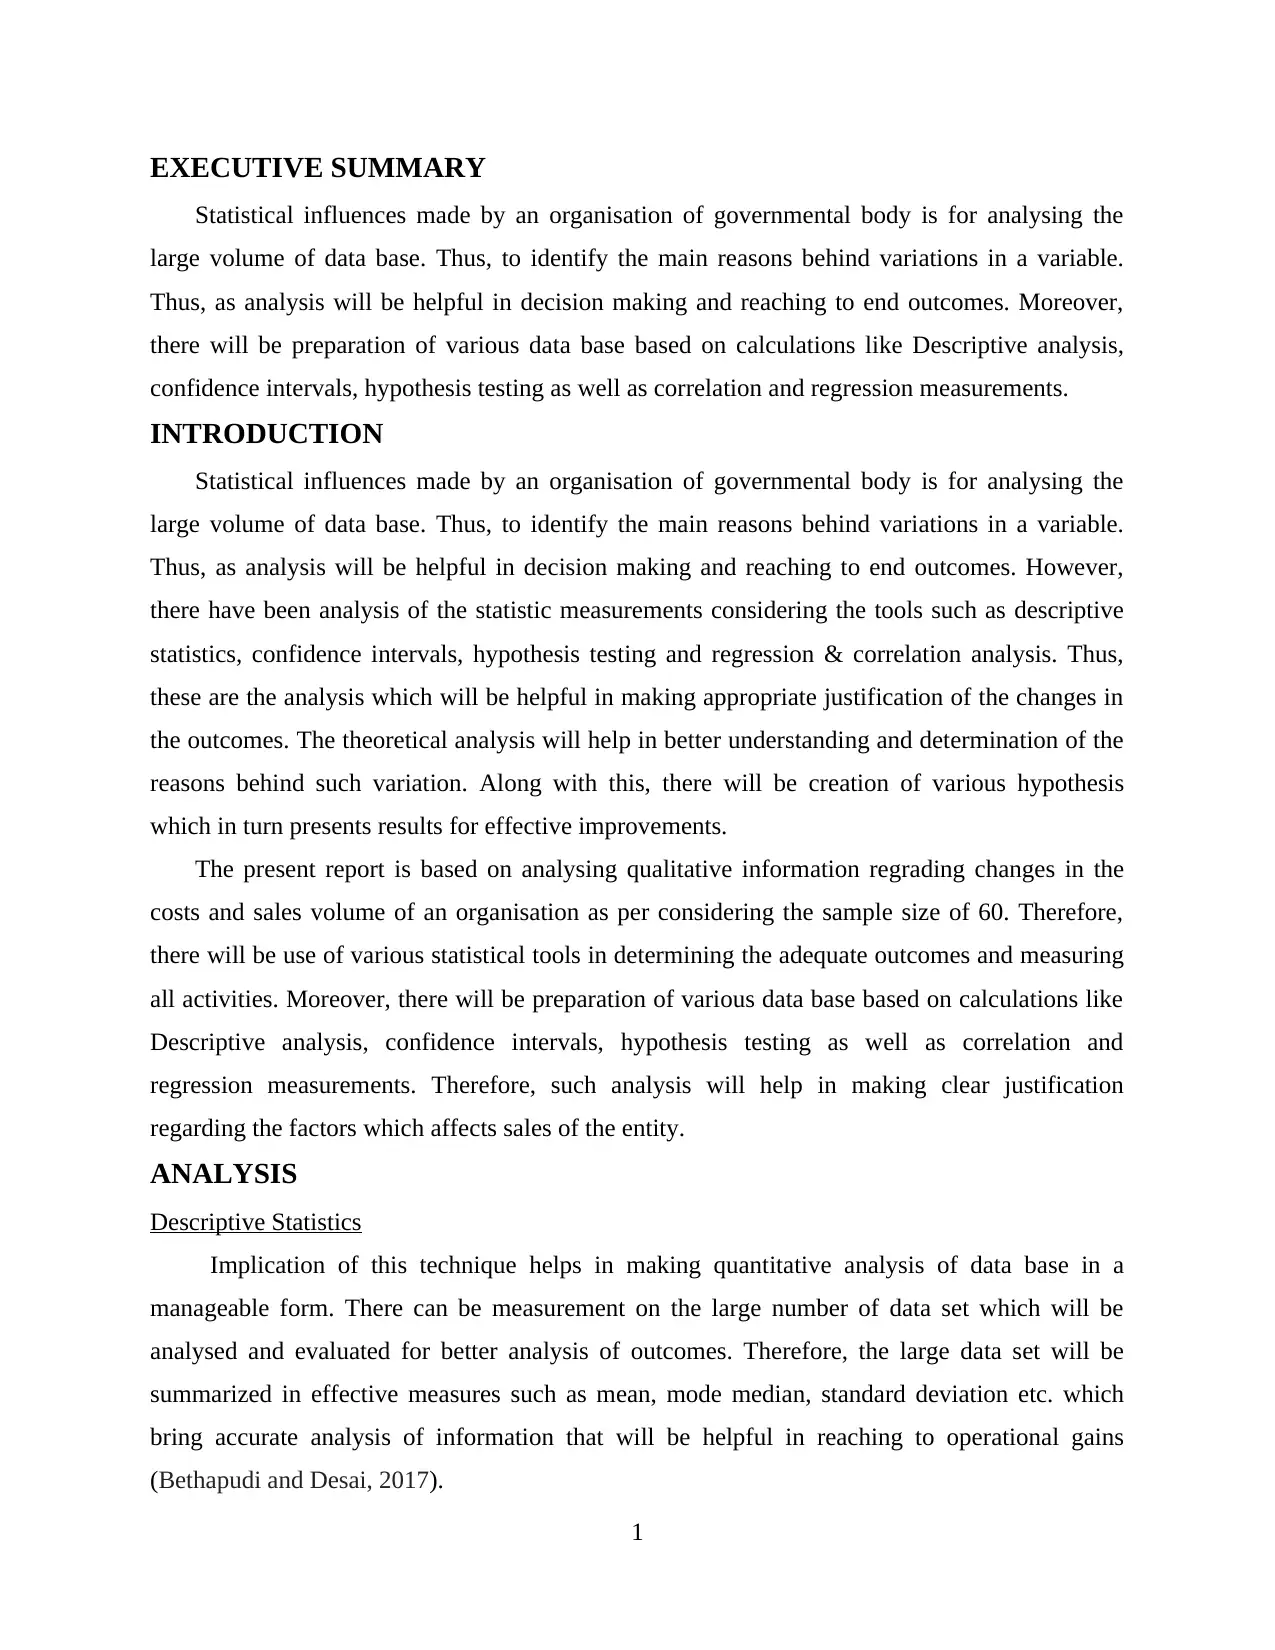
EXECUTIVE SUMMARY
Statistical influences made by an organisation of governmental body is for analysing the
large volume of data base. Thus, to identify the main reasons behind variations in a variable.
Thus, as analysis will be helpful in decision making and reaching to end outcomes. Moreover,
there will be preparation of various data base based on calculations like Descriptive analysis,
confidence intervals, hypothesis testing as well as correlation and regression measurements.
INTRODUCTION
Statistical influences made by an organisation of governmental body is for analysing the
large volume of data base. Thus, to identify the main reasons behind variations in a variable.
Thus, as analysis will be helpful in decision making and reaching to end outcomes. However,
there have been analysis of the statistic measurements considering the tools such as descriptive
statistics, confidence intervals, hypothesis testing and regression & correlation analysis. Thus,
these are the analysis which will be helpful in making appropriate justification of the changes in
the outcomes. The theoretical analysis will help in better understanding and determination of the
reasons behind such variation. Along with this, there will be creation of various hypothesis
which in turn presents results for effective improvements.
The present report is based on analysing qualitative information regrading changes in the
costs and sales volume of an organisation as per considering the sample size of 60. Therefore,
there will be use of various statistical tools in determining the adequate outcomes and measuring
all activities. Moreover, there will be preparation of various data base based on calculations like
Descriptive analysis, confidence intervals, hypothesis testing as well as correlation and
regression measurements. Therefore, such analysis will help in making clear justification
regarding the factors which affects sales of the entity.
ANALYSIS
Descriptive Statistics
Implication of this technique helps in making quantitative analysis of data base in a
manageable form. There can be measurement on the large number of data set which will be
analysed and evaluated for better analysis of outcomes. Therefore, the large data set will be
summarized in effective measures such as mean, mode median, standard deviation etc. which
bring accurate analysis of information that will be helpful in reaching to operational gains
(Bethapudi and Desai, 2017).
1
Statistical influences made by an organisation of governmental body is for analysing the
large volume of data base. Thus, to identify the main reasons behind variations in a variable.
Thus, as analysis will be helpful in decision making and reaching to end outcomes. Moreover,
there will be preparation of various data base based on calculations like Descriptive analysis,
confidence intervals, hypothesis testing as well as correlation and regression measurements.
INTRODUCTION
Statistical influences made by an organisation of governmental body is for analysing the
large volume of data base. Thus, to identify the main reasons behind variations in a variable.
Thus, as analysis will be helpful in decision making and reaching to end outcomes. However,
there have been analysis of the statistic measurements considering the tools such as descriptive
statistics, confidence intervals, hypothesis testing and regression & correlation analysis. Thus,
these are the analysis which will be helpful in making appropriate justification of the changes in
the outcomes. The theoretical analysis will help in better understanding and determination of the
reasons behind such variation. Along with this, there will be creation of various hypothesis
which in turn presents results for effective improvements.
The present report is based on analysing qualitative information regrading changes in the
costs and sales volume of an organisation as per considering the sample size of 60. Therefore,
there will be use of various statistical tools in determining the adequate outcomes and measuring
all activities. Moreover, there will be preparation of various data base based on calculations like
Descriptive analysis, confidence intervals, hypothesis testing as well as correlation and
regression measurements. Therefore, such analysis will help in making clear justification
regarding the factors which affects sales of the entity.
ANALYSIS
Descriptive Statistics
Implication of this technique helps in making quantitative analysis of data base in a
manageable form. There can be measurement on the large number of data set which will be
analysed and evaluated for better analysis of outcomes. Therefore, the large data set will be
summarized in effective measures such as mean, mode median, standard deviation etc. which
bring accurate analysis of information that will be helpful in reaching to operational gains
(Bethapudi and Desai, 2017).
1
⊘ This is a preview!⊘
Do you want full access?
Subscribe today to unlock all pages.
Trusted by 1+ million students worldwide
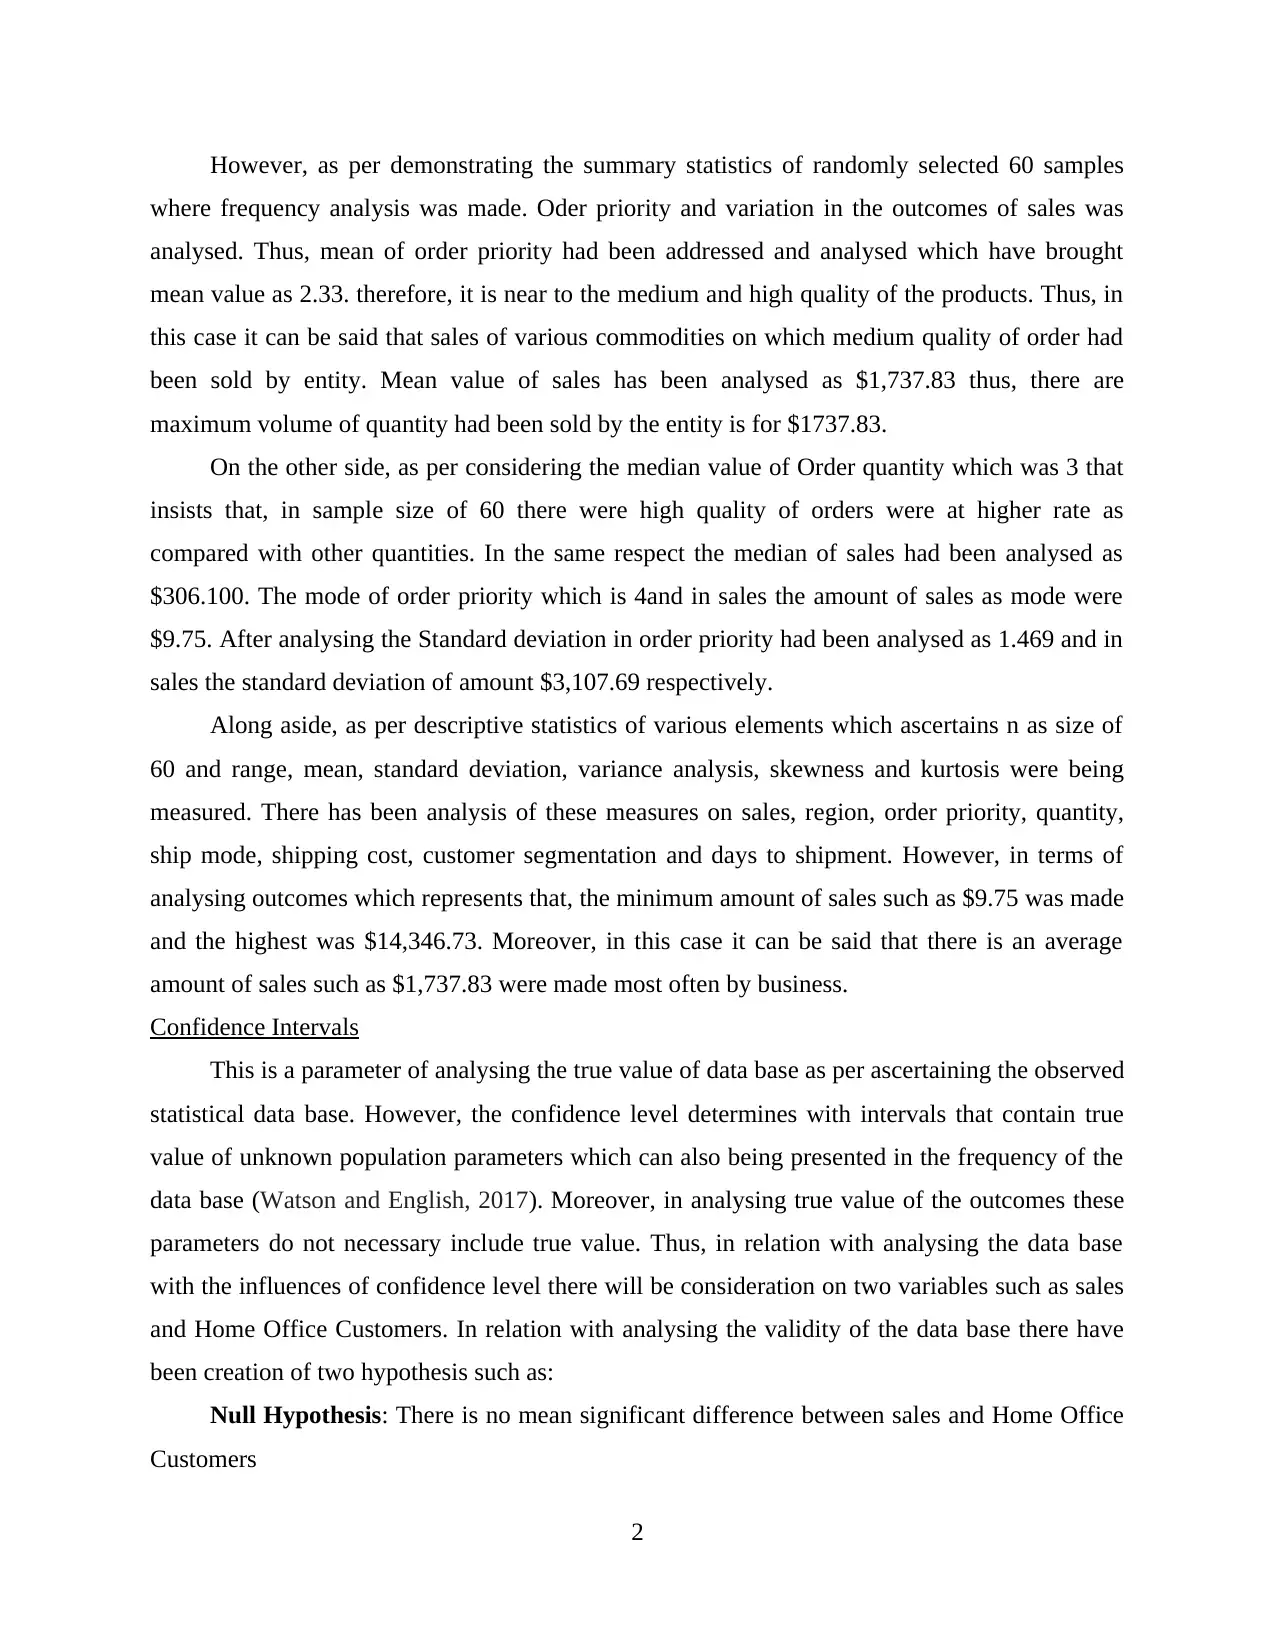
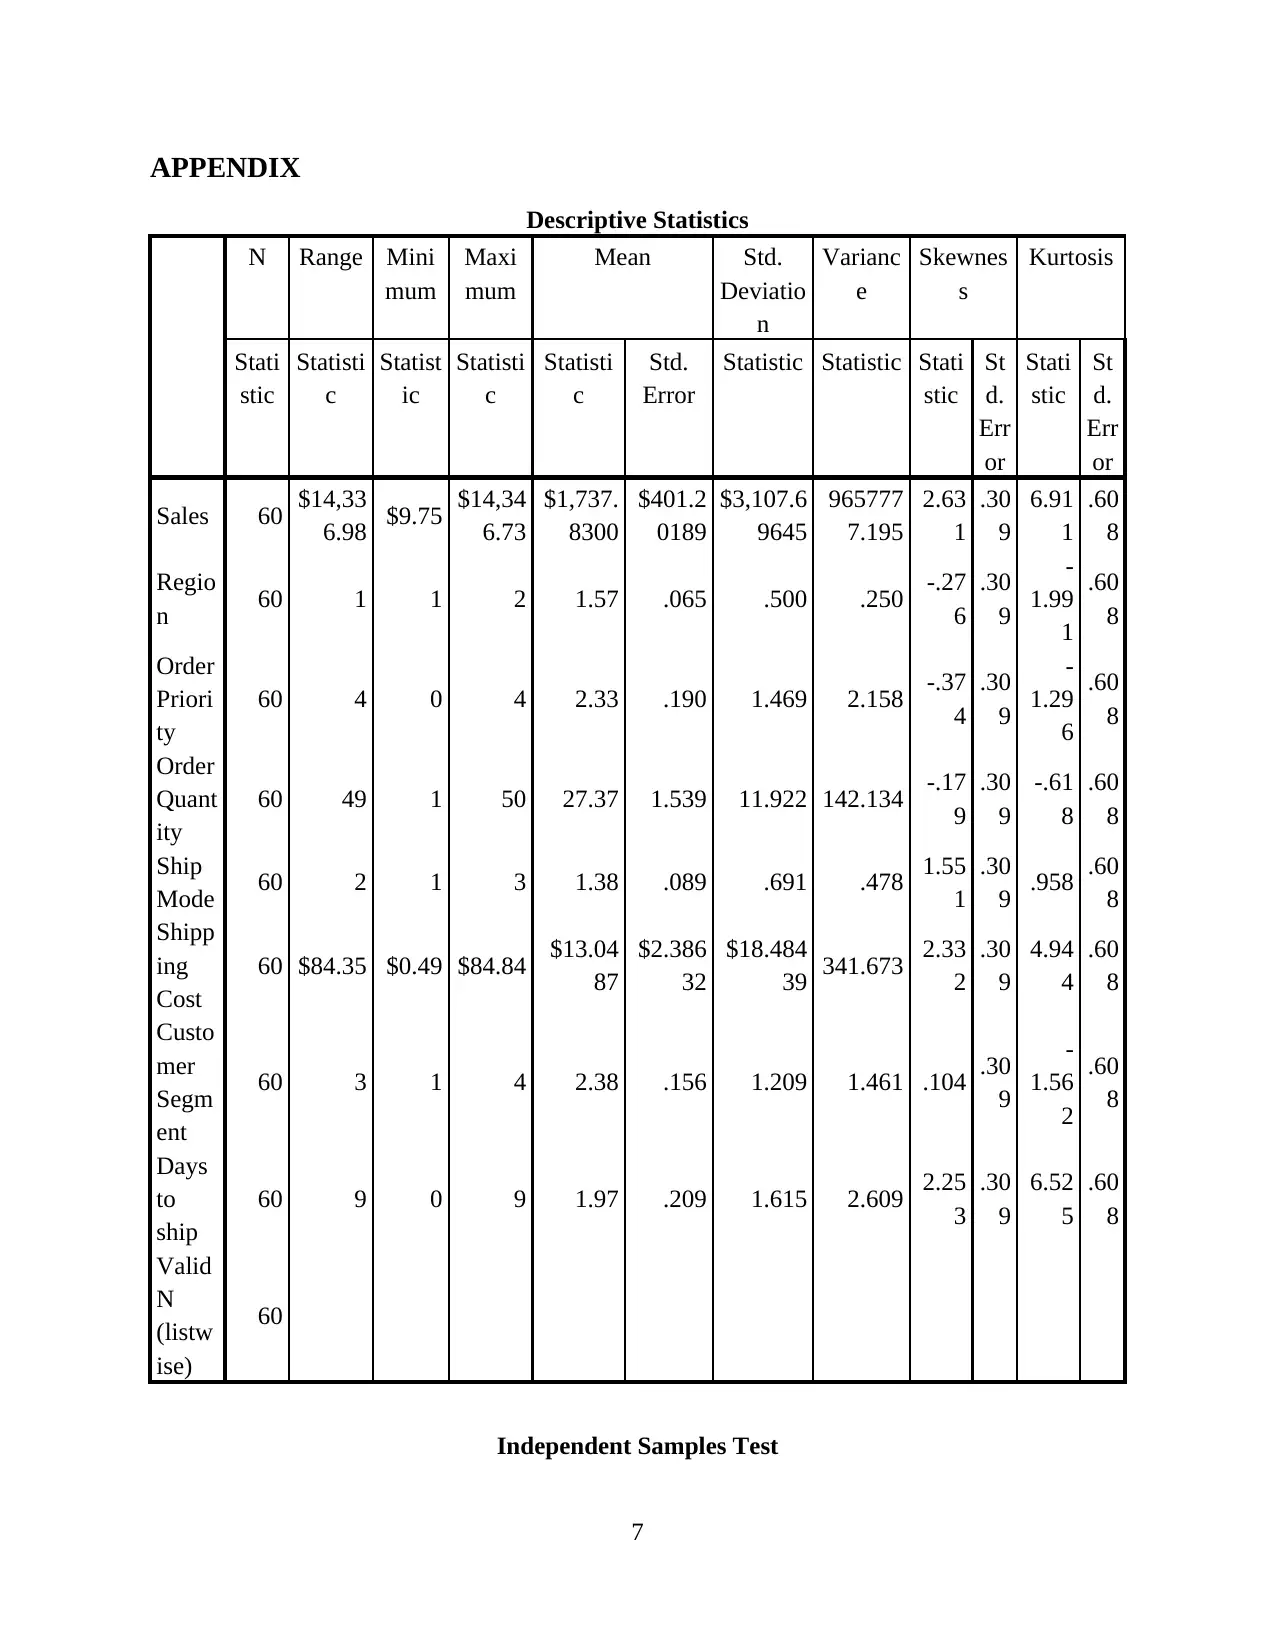
However, as per demonstrating the summary statistics of randomly selected 60 samples
where frequency analysis was made. Oder priority and variation in the outcomes of sales was
analysed. Thus, mean of order priority had been addressed and analysed which have brought
mean value as 2.33. therefore, it is near to the medium and high quality of the products. Thus, in
this case it can be said that sales of various commodities on which medium quality of order had
been sold by entity. Mean value of sales has been analysed as $1,737.83 thus, there are
maximum volume of quantity had been sold by the entity is for $1737.83.
On the other side, as per considering the median value of Order quantity which was 3 that
insists that, in sample size of 60 there were high quality of orders were at higher rate as
compared with other quantities. In the same respect the median of sales had been analysed as
$306.100. The mode of order priority which is 4and in sales the amount of sales as mode were
$9.75. After analysing the Standard deviation in order priority had been analysed as 1.469 and in
sales the standard deviation of amount $3,107.69 respectively.
Along aside, as per descriptive statistics of various elements which ascertains n as size of
60 and range, mean, standard deviation, variance analysis, skewness and kurtosis were being
measured. There has been analysis of these measures on sales, region, order priority, quantity,
ship mode, shipping cost, customer segmentation and days to shipment. However, in terms of
analysing outcomes which represents that, the minimum amount of sales such as $9.75 was made
and the highest was $14,346.73. Moreover, in this case it can be said that there is an average
amount of sales such as $1,737.83 were made most often by business.
Confidence Intervals
This is a parameter of analysing the true value of data base as per ascertaining the observed
statistical data base. However, the confidence level determines with intervals that contain true
value of unknown population parameters which can also being presented in the frequency of the
data base (Watson and English, 2017). Moreover, in analysing true value of the outcomes these
parameters do not necessary include true value. Thus, in relation with analysing the data base
with the influences of confidence level there will be consideration on two variables such as sales
and Home Office Customers. In relation with analysing the validity of the data base there have
been creation of two hypothesis such as:
Null Hypothesis: There is no mean significant difference between sales and Home Office
Customers
2
Paraphrase This Document
Need a fresh take? Get an instant paraphrase of this document with our AI Paraphraser
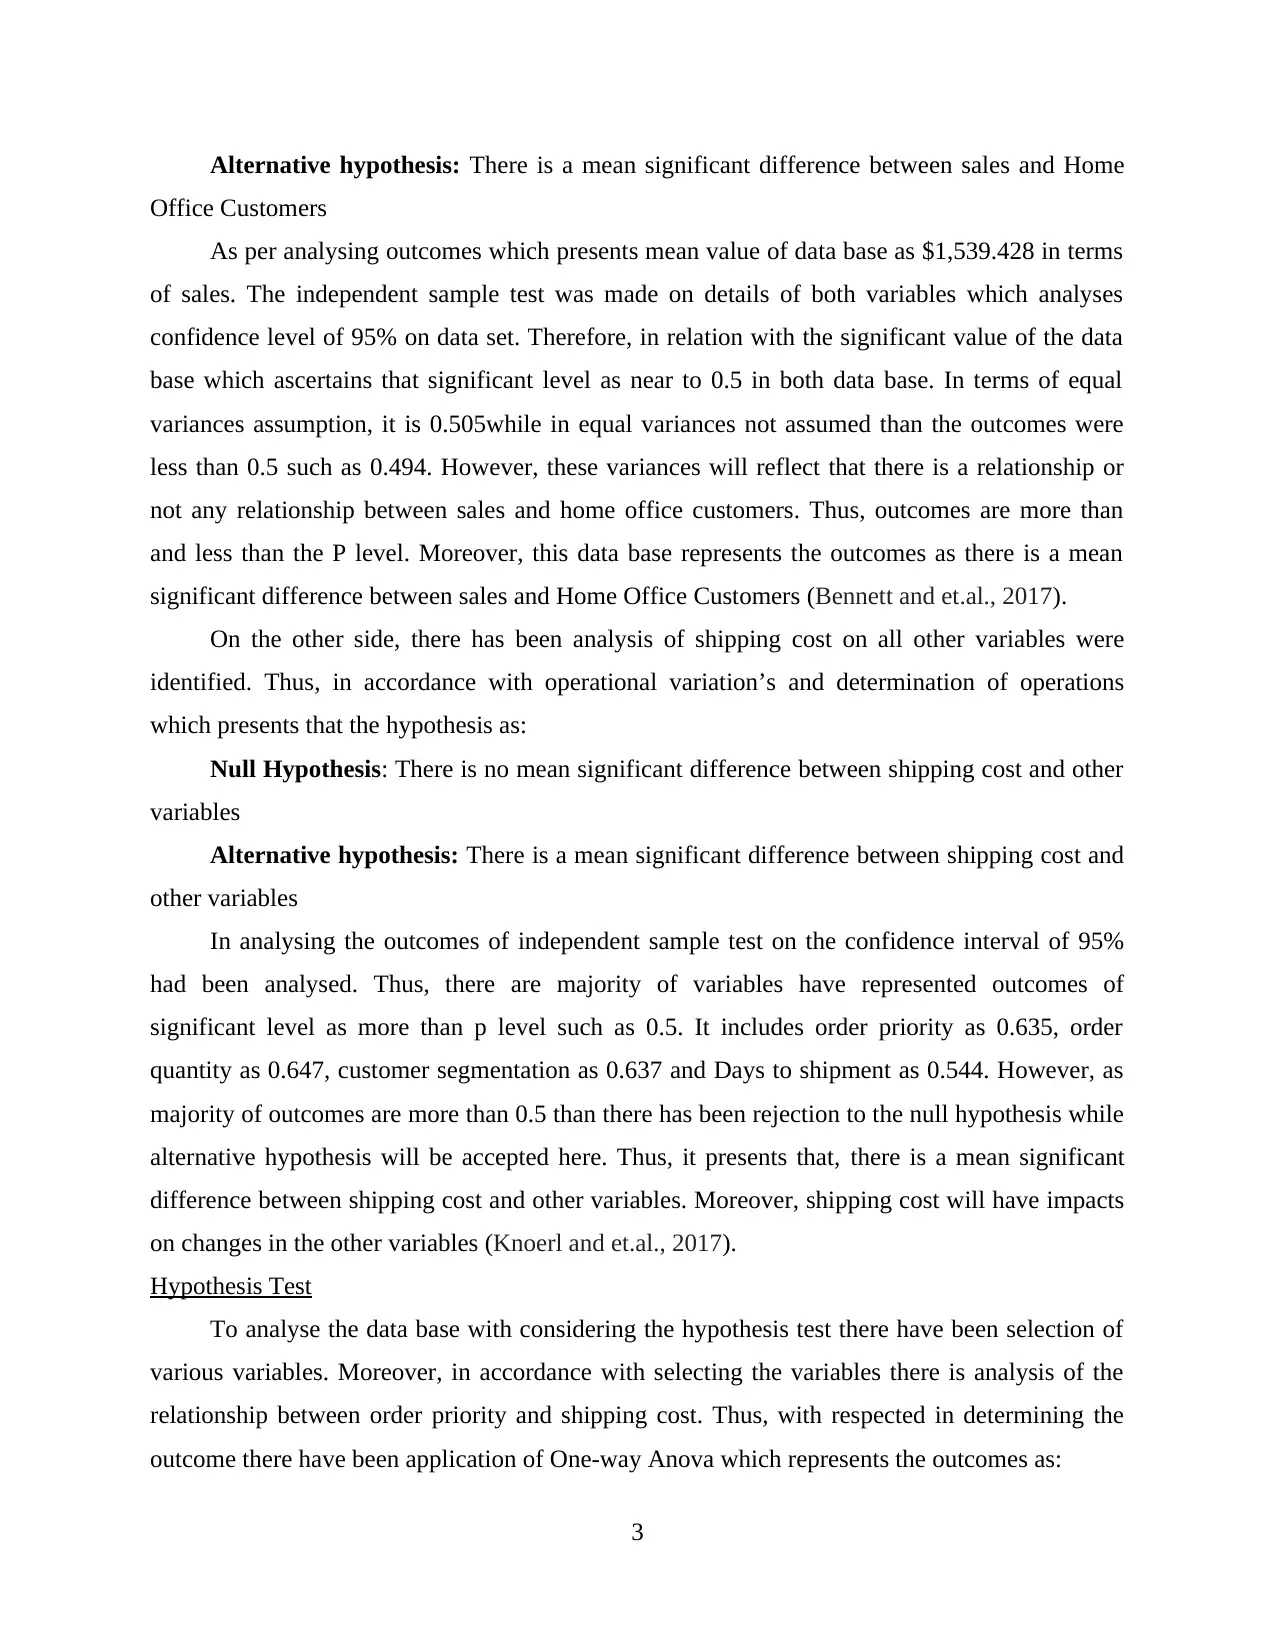
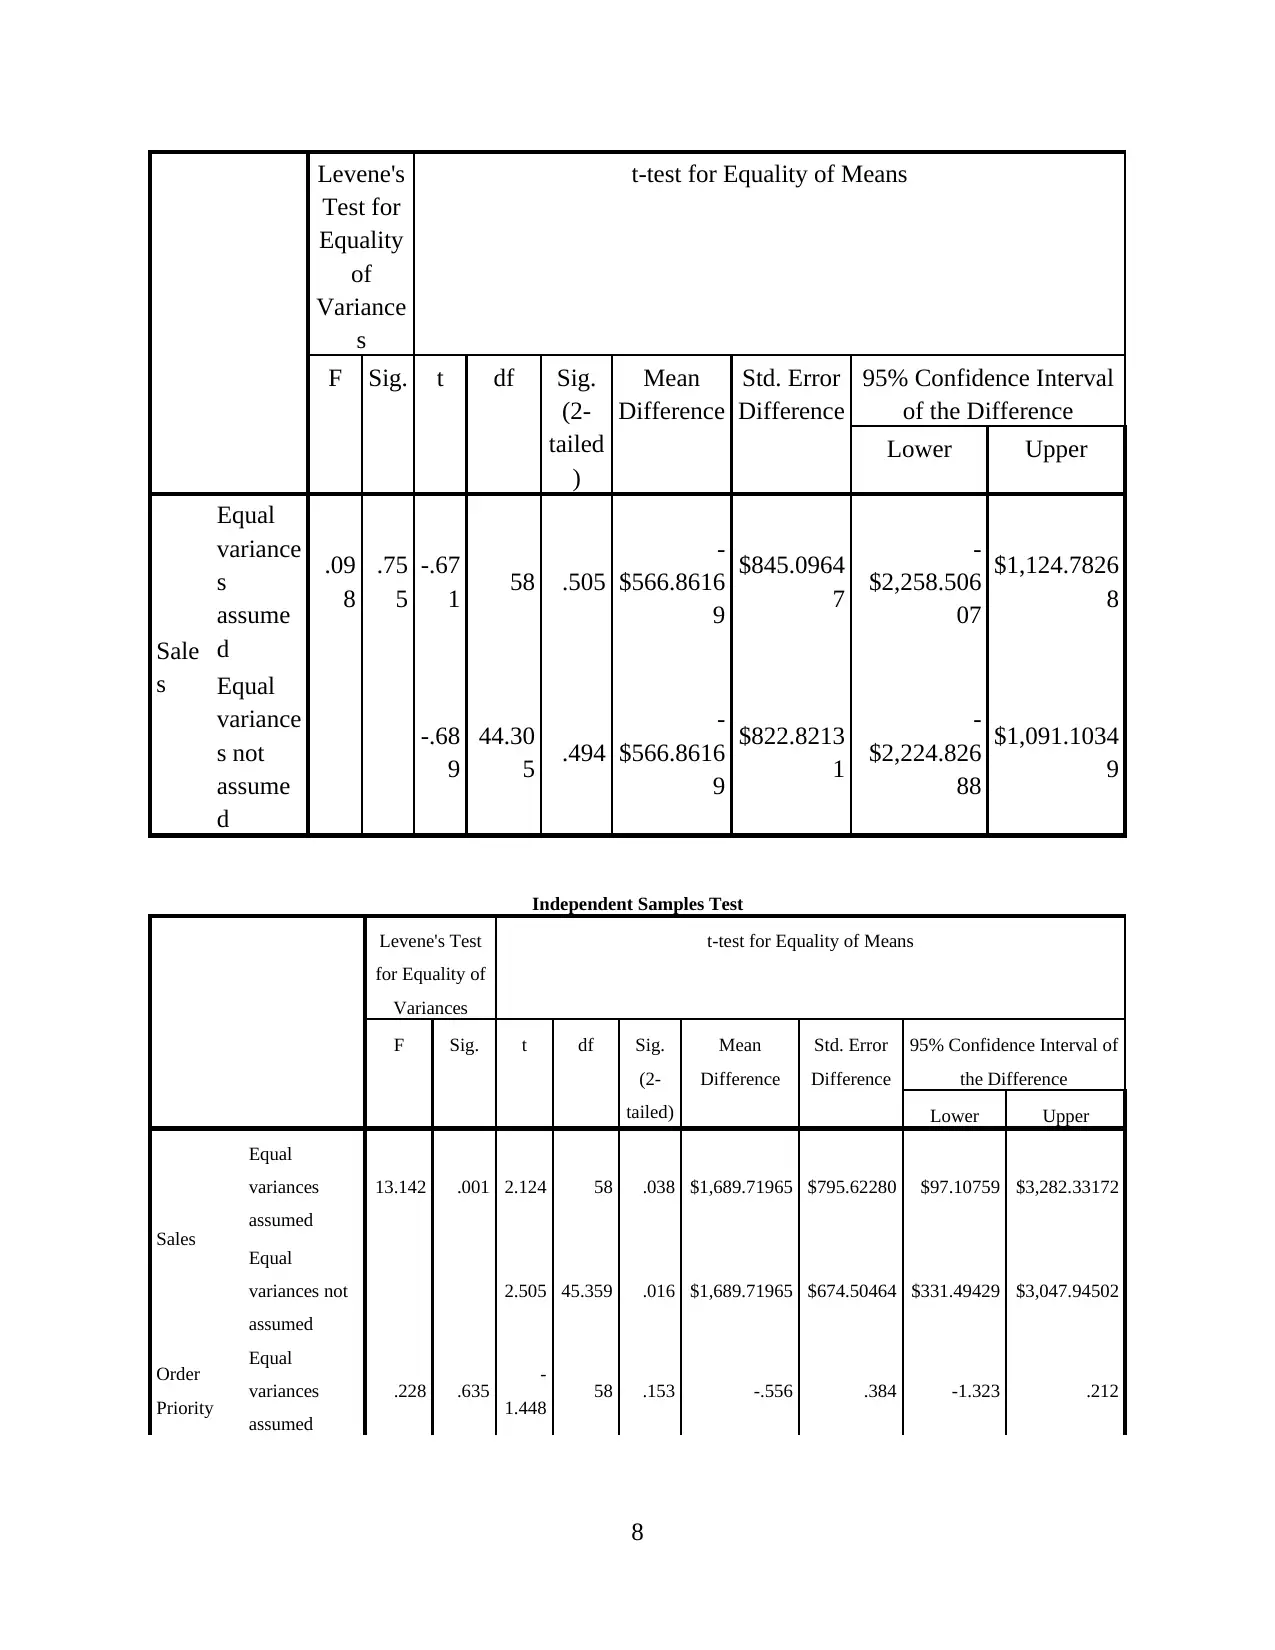
Alternative hypothesis: There is a mean significant difference between sales and Home
Office Customers
As per analysing outcomes which presents mean value of data base as $1,539.428 in terms
of sales. The independent sample test was made on details of both variables which analyses
confidence level of 95% on data set. Therefore, in relation with the significant value of the data
base which ascertains that significant level as near to 0.5 in both data base. In terms of equal
variances assumption, it is 0.505while in equal variances not assumed than the outcomes were
less than 0.5 such as 0.494. However, these variances will reflect that there is a relationship or
not any relationship between sales and home office customers. Thus, outcomes are more than
and less than the P level. Moreover, this data base represents the outcomes as there is a mean
significant difference between sales and Home Office Customers (Bennett and et.al., 2017).
On the other side, there has been analysis of shipping cost on all other variables were
identified. Thus, in accordance with operational variation’s and determination of operations
which presents that the hypothesis as:
Null Hypothesis: There is no mean significant difference between shipping cost and other
variables
Alternative hypothesis: There is a mean significant difference between shipping cost and
other variables
In analysing the outcomes of independent sample test on the confidence interval of 95%
had been analysed. Thus, there are majority of variables have represented outcomes of
significant level as more than p level such as 0.5. It includes order priority as 0.635, order
quantity as 0.647, customer segmentation as 0.637 and Days to shipment as 0.544. However, as
majority of outcomes are more than 0.5 than there has been rejection to the null hypothesis while
alternative hypothesis will be accepted here. Thus, it presents that, there is a mean significant
difference between shipping cost and other variables. Moreover, shipping cost will have impacts
on changes in the other variables (Knoerl and et.al., 2017).
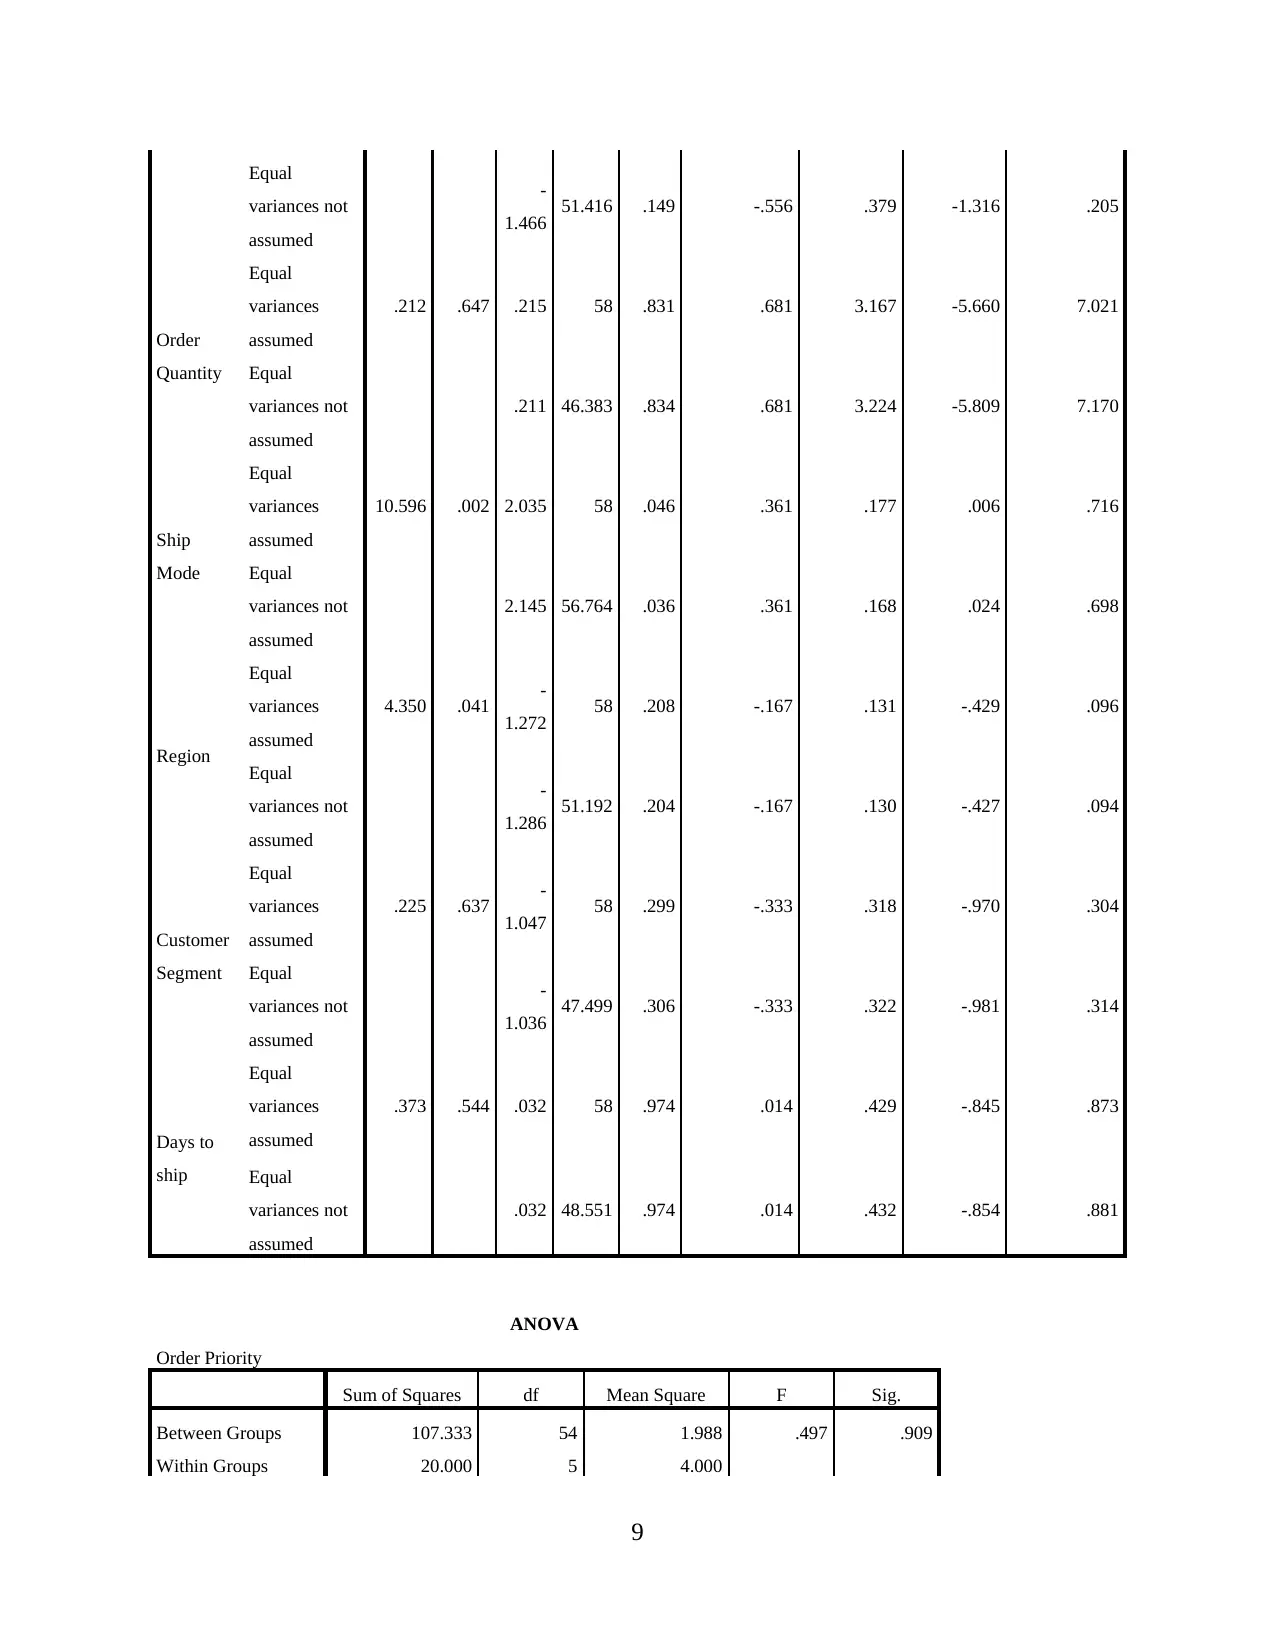
Hypothesis Test
To analyse the data base with considering the hypothesis test there have been selection of
various variables. Moreover, in accordance with selecting the variables there is analysis of the
relationship between order priority and shipping cost. Thus, with respected in determining the
outcome there have been application of One-way Anova which represents the outcomes as:
3
Office Customers
As per analysing outcomes which presents mean value of data base as $1,539.428 in terms
of sales. The independent sample test was made on details of both variables which analyses
confidence level of 95% on data set. Therefore, in relation with the significant value of the data
base which ascertains that significant level as near to 0.5 in both data base. In terms of equal
variances assumption, it is 0.505while in equal variances not assumed than the outcomes were
less than 0.5 such as 0.494. However, these variances will reflect that there is a relationship or
not any relationship between sales and home office customers. Thus, outcomes are more than
and less than the P level. Moreover, this data base represents the outcomes as there is a mean
significant difference between sales and Home Office Customers (Bennett and et.al., 2017).
On the other side, there has been analysis of shipping cost on all other variables were
identified. Thus, in accordance with operational variation’s and determination of operations
which presents that the hypothesis as:
Null Hypothesis: There is no mean significant difference between shipping cost and other
variables
Alternative hypothesis: There is a mean significant difference between shipping cost and
other variables
In analysing the outcomes of independent sample test on the confidence interval of 95%
had been analysed. Thus, there are majority of variables have represented outcomes of
significant level as more than p level such as 0.5. It includes order priority as 0.635, order
quantity as 0.647, customer segmentation as 0.637 and Days to shipment as 0.544. However, as
majority of outcomes are more than 0.5 than there has been rejection to the null hypothesis while
alternative hypothesis will be accepted here. Thus, it presents that, there is a mean significant
difference between shipping cost and other variables. Moreover, shipping cost will have impacts
on changes in the other variables (Knoerl and et.al., 2017).
Hypothesis Test
To analyse the data base with considering the hypothesis test there have been selection of
various variables. Moreover, in accordance with selecting the variables there is analysis of the
relationship between order priority and shipping cost. Thus, with respected in determining the
outcome there have been application of One-way Anova which represents the outcomes as:
3
Null Hypothesis: There is no mean significant difference between order priority and
shipping costs
Alternative Hypothesis: There is a mean significant difference between order priority and
shipping costs
As listed in appendix, the test represents outcomes by comparing both the variables. Thus,
the significant value is comparatively higher than the P level of analysis such as 0.909(>0.05). It
represents that, there is a mean significant difference between order priority and shipping costs
(Lozovatsky and et.al., 2017).
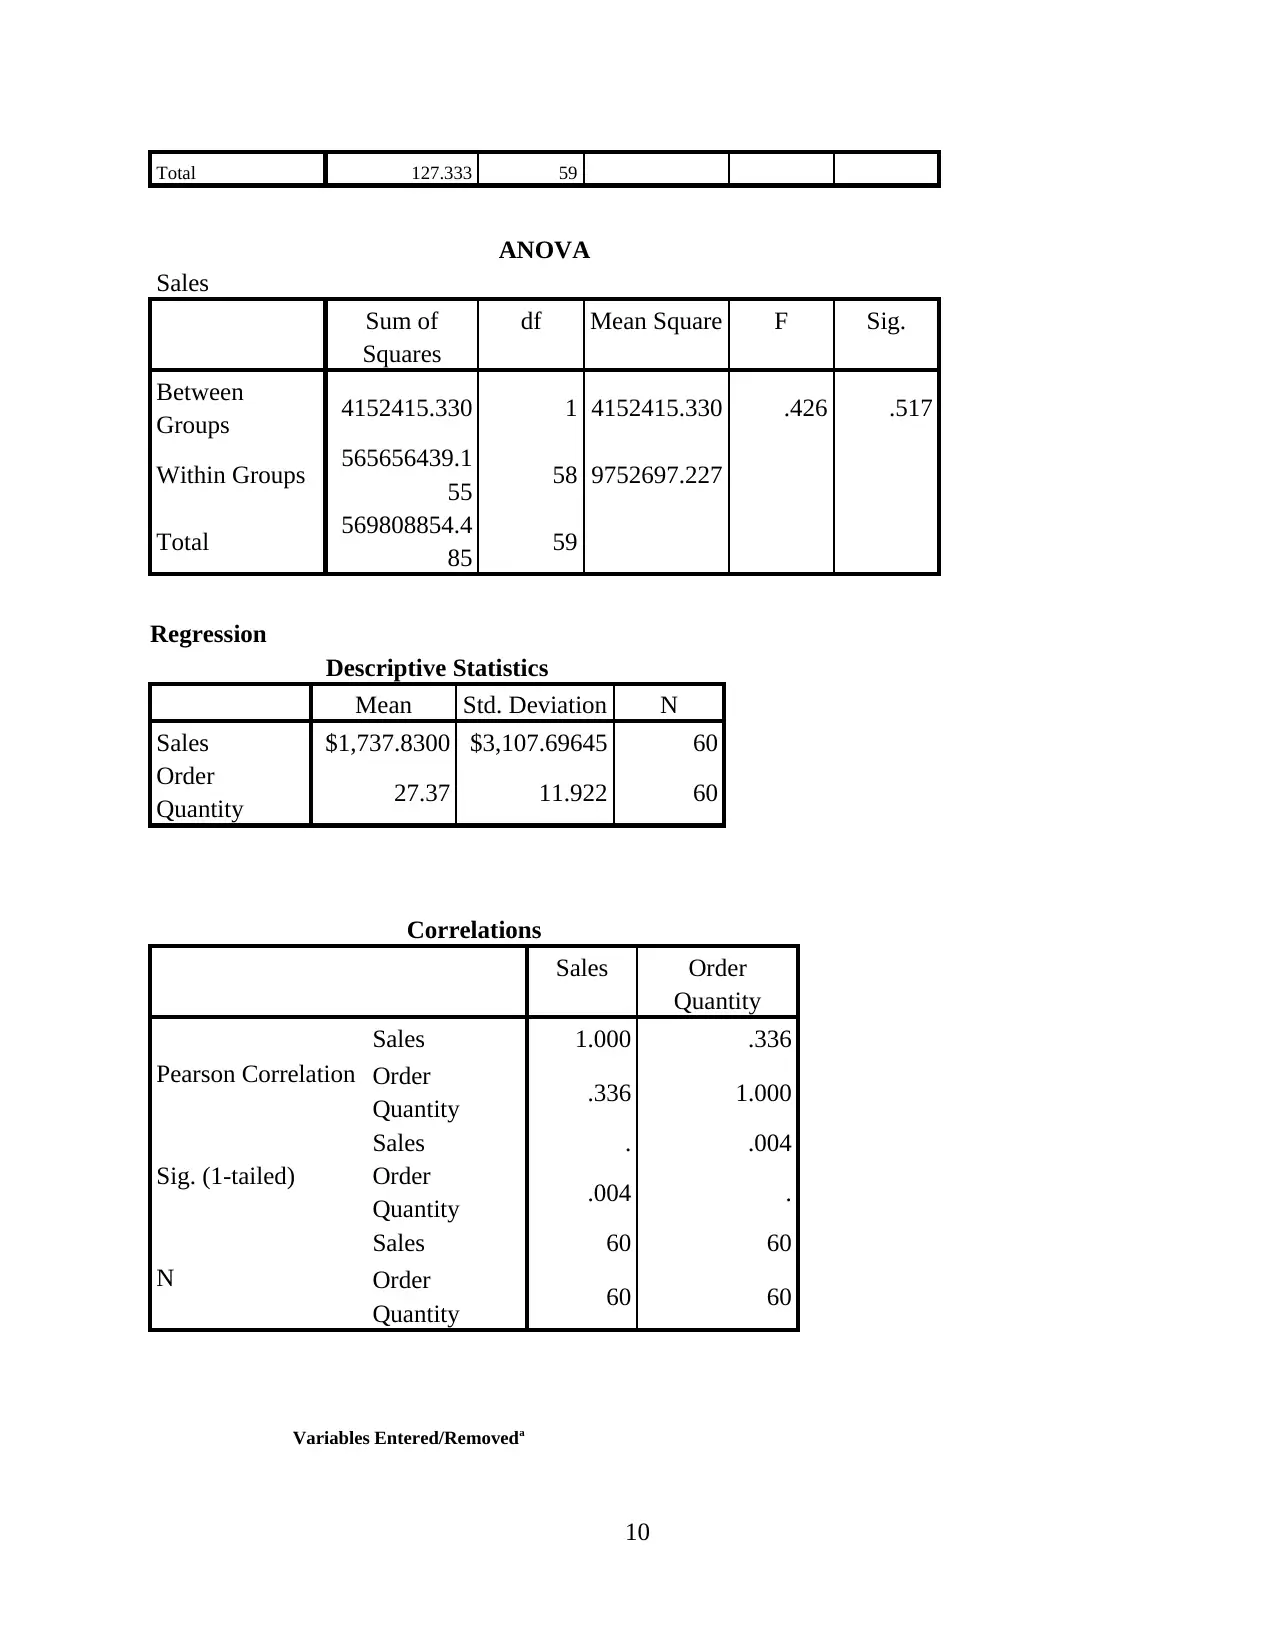
Similarly, in relation with analysing the relationship between average sales and region the
hypothesis had been created here are:
Null Hypothesis: There is no mean significant difference between Average sales and
Region.
Alternative Hypothesis: There is a mean significant difference between Average sales and
Region.
In consideration with the outcomes which were being derived after implication of the One-
way ANOVA test represents the significance value as 0.571. therefore, it is also higher than the
required P level of the data base such as 0.5. Similarly, it can be said that, there is a mean
significant difference between Average sales and Region.
Correlation and Regression
To analyse the correlation and regression of the variables such as average sales an order
quantity was being addressed on the hypothesis such as:
Null Hypothesis: There is no mean significant difference between average sales and order
quantity
Alternative Hypothesis: There is a mean significant difference between average sales and
order quantity
Regression:
In relation with analysing the regression outcome which represents p value is less than 0.5. thus,
here it can be said that, there is no mean significant difference between Average sales and Order
Quantity.
4
shipping costs
Alternative Hypothesis: There is a mean significant difference between order priority and
shipping costs
As listed in appendix, the test represents outcomes by comparing both the variables. Thus,
the significant value is comparatively higher than the P level of analysis such as 0.909(>0.05). It
represents that, there is a mean significant difference between order priority and shipping costs
(Lozovatsky and et.al., 2017).
Similarly, in relation with analysing the relationship between average sales and region the
hypothesis had been created here are:
Null Hypothesis: There is no mean significant difference between Average sales and
Region.
Alternative Hypothesis: There is a mean significant difference between Average sales and
Region.
In consideration with the outcomes which were being derived after implication of the One-
way ANOVA test represents the significance value as 0.571. therefore, it is also higher than the
required P level of the data base such as 0.5. Similarly, it can be said that, there is a mean
significant difference between Average sales and Region.
Correlation and Regression
To analyse the correlation and regression of the variables such as average sales an order
quantity was being addressed on the hypothesis such as:
Null Hypothesis: There is no mean significant difference between average sales and order
quantity
Alternative Hypothesis: There is a mean significant difference between average sales and
order quantity
Regression:
In relation with analysing the regression outcome which represents p value is less than 0.5. thus,
here it can be said that, there is no mean significant difference between Average sales and Order
Quantity.
4
⊘ This is a preview!⊘
Do you want full access?
Subscribe today to unlock all pages.
Trusted by 1+ million students worldwide
Correlation:
In relation with correlation analysis of the data base on which it represents the similar
outcomes as regression. Thus, p value is more than 0.5 it presents that, there is no mean
significant difference between Average sales and Order Quantity.
CONCLUSION
On the basis of above report, it can be said that there has been analysis of data base with
considering various statistical tools. It includes frequency tables analysis, descriptive analysis,
correlation, regression etc. that had been addressed to have appropriate determination of facts.
Along with this, there have been creation of various hypothesis on which application of
statistical tools brought valid outcomes.
5
Paraphrase This Document
Need a fresh take? Get an instant paraphrase of this document with our AI Paraphraser
REFERENCES
Books and Journals
Bennett, I. E. and et.al., 2017. Early perfusion MRI predicts survival outcome in patients with
recurrent glioblastoma treated with bevacizumab and carboplatin. Journal of neuro-
oncology. 131(2). pp.321-329.
Bethapudi, S. and Desai, S., 2017. Median statistics estimates of Hubble and Newton's
constants. The European Physical Journal Plus. 132(2). p.78.
Knoerl, R. and et.al., 2017. Electronic versus paper-pencil methods for assessing chemotherapy-
induced peripheral neuropathy. Supportive Care in Cancer. 25(11). pp.3437-3446.
Lozovatsky, I. and et.al., 2017. Probability distribution of turbulent kinetic energy dissipation
rate in ocean: Observations and approximations. Journal of Geophysical Research:
Oceans. 122(10). pp.8293-8308.
Watson, J. and English, L., 2017. Reaction time in Grade 5: Data collection within the Practice
of Statistics. Statistics Education Research Journal. 16(1).
6
APPENDIX
Descriptive Statistics
N Range Mini
mum
Maxi
mum
Mean Std.
Deviatio
n
Varianc
e
Skewnes
s
Kurtosis
Stati
stic
Statisti
c
Statist
ic
Statisti
c
Statisti
c
Std.
Error
Statistic Statistic Stati
stic
St
d.
Err
or
Stati
stic
St
d.
Err
or
Sales 60 $14,33
6.98 $9.75 $14,34
6.73
$1,737.
8300
$401.2
0189
$3,107.6
9645
965777
7.195
2.63
1
.30
9
6.91
1
.60
8
Regio
n 60 1 1 2 1.57 .065 .500 .250 -.27
6
.30
9
-
1.99
1
.60
8
Order
Priori
ty
60 4 0 4 2.33 .190 1.469 2.158 -.37
4
.30
9
-
1.29
6
.60
8
Order
Quant
ity
60 49 1 50 27.37 1.539 11.922 142.134 -.17
9
.30
9
-.61
8
.60
8
Ship
Mode 60 2 1 3 1.38 .089 .691 .478 1.55
1
.30
9 .958 .60
8
Shipp
ing
Cost
60 $84.35 $0.49 $84.84 $13.04
87
$2.386
32
$18.484
39 341.673 2.33
2
.30
9
4.94
4
.60
8
Custo
mer
Segm
ent
60 3 1 4 2.38 .156 1.209 1.461 .104 .30
9
-
1.56
2
.60
8
Days
to
ship
60 9 0 9 1.97 .209 1.615 2.609 2.25
3
.30
9
6.52
5
.60
8
Valid
N
(listw
ise)
60
Independent Samples Test
7
⊘ This is a preview!⊘
Do you want full access?
Subscribe today to unlock all pages.
Trusted by 1+ million students worldwide
Levene's
Test for
Equality
of
Variance
s
t-test for Equality of Means
F Sig. t df Sig.
(2-
tailed
)
Mean
Difference
Std. Error
Difference
95% Confidence Interval
of the Difference
Lower Upper
Sale
s
Equal
variance
s
assume
d
.09
8
.75
5
-.67
1 58 .505
-
$566.8616
9
$845.0964
7
-
$2,258.506
07
$1,124.7826
8
Equal
variance
s not
assume
d
-.68
9
44.30
5 .494
-
$566.8616
9
$822.8213
1
-
$2,224.826
88
$1,091.1034
9
Independent Samples Test
Levene's Test
for Equality of
Variances
t-test for Equality of Means
F Sig. t df Sig.
(2-
tailed)
Mean
Difference
Std. Error
Difference
95% Confidence Interval of
the Difference
Lower Upper
Sales
Equal
variances
assumed
13.142 .001 2.124 58 .038 $1,689.71965 $795.62280 $97.10759 $3,282.33172
Equal
variances not
assumed
2.505 45.359 .016 $1,689.71965 $674.50464 $331.49429 $3,047.94502
Order
Priority
Equal
variances
assumed
.228 .635 -
1.448 58 .153 -.556 .384 -1.323 .212
8
Paraphrase This Document
Need a fresh take? Get an instant paraphrase of this document with our AI Paraphraser
Equal
variances not
assumed
-
1.466 51.416 .149 -.556 .379 -1.316 .205
Order
Quantity
Equal
variances
assumed
.212 .647 .215 58 .831 .681 3.167 -5.660 7.021
Equal
variances not
assumed
.211 46.383 .834 .681 3.224 -5.809 7.170
Ship
Mode
Equal
variances
assumed
10.596 .002 2.035 58 .046 .361 .177 .006 .716
Equal
variances not
assumed
2.145 56.764 .036 .361 .168 .024 .698
Region
Equal
variances
assumed
4.350 .041 -
1.272 58 .208 -.167 .131 -.429 .096
Equal
variances not
assumed
-
1.286 51.192 .204 -.167 .130 -.427 .094
Customer
Segment
Equal
variances
assumed
.225 .637 -
1.047 58 .299 -.333 .318 -.970 .304
Equal
variances not
assumed
-
1.036 47.499 .306 -.333 .322 -.981 .314
Days to
ship
Equal
variances
assumed
.373 .544 .032 58 .974 .014 .429 -.845 .873
Equal
variances not
assumed
.032 48.551 .974 .014 .432 -.854 .881
ANOVA
Order Priority
Sum of Squares df Mean Square F Sig.
Between Groups 107.333 54 1.988 .497 .909
Within Groups 20.000 5 4.000
9
variances not
assumed
-
1.466 51.416 .149 -.556 .379 -1.316 .205
Order
Quantity
Equal
variances
assumed
.212 .647 .215 58 .831 .681 3.167 -5.660 7.021
Equal
variances not
assumed
.211 46.383 .834 .681 3.224 -5.809 7.170
Ship
Mode
Equal
variances
assumed
10.596 .002 2.035 58 .046 .361 .177 .006 .716
Equal
variances not
assumed
2.145 56.764 .036 .361 .168 .024 .698
Region
Equal
variances
assumed
4.350 .041 -
1.272 58 .208 -.167 .131 -.429 .096
Equal
variances not
assumed
-
1.286 51.192 .204 -.167 .130 -.427 .094
Customer
Segment
Equal
variances
assumed
.225 .637 -
1.047 58 .299 -.333 .318 -.970 .304
Equal
variances not
assumed
-
1.036 47.499 .306 -.333 .322 -.981 .314
Days to
ship
Equal
variances
assumed
.373 .544 .032 58 .974 .014 .429 -.845 .873
Equal
variances not
assumed
.032 48.551 .974 .014 .432 -.854 .881
ANOVA
Order Priority
Sum of Squares df Mean Square F Sig.
Between Groups 107.333 54 1.988 .497 .909
Within Groups 20.000 5 4.000
9
Total 127.333 59
ANOVA
Sales
Sum of
Squares
df Mean Square F Sig.
Between
Groups 4152415.330 1 4152415.330 .426 .517
Within Groups 565656439.1
55 58 9752697.227
Total 569808854.4
85 59
Regression
Descriptive Statistics
Mean Std. Deviation N
Sales $1,737.8300 $3,107.69645 60
Order
Quantity 27.37 11.922 60
Correlations
Sales Order
Quantity
Pearson Correlation
Sales 1.000 .336
Order
Quantity .336 1.000
Sig. (1-tailed)
Sales . .004
Order
Quantity .004 .
N
Sales 60 60
Order
Quantity 60 60
Variables Entered/Removeda
10
⊘ This is a preview!⊘
Do you want full access?
Subscribe today to unlock all pages.
Trusted by 1+ million students worldwide
1 out of 14
Related Documents


Your All-in-One AI-Powered Toolkit for Academic Success.
+13062052269
info@desklib.com
Available 24*7 on WhatsApp / Email
![[object Object]](/_next/static/media/star-bottom.7253800d.svg)
Unlock your academic potential
Copyright © 2020–2026 A2Z Services. All Rights Reserved. Developed and managed by ZUCOL.