Quantitative Analysis Report: Child Growth Survey Data Analysis

Verified

Added on  2022/12/30

|27
|3522
|60
Report
AI Summary
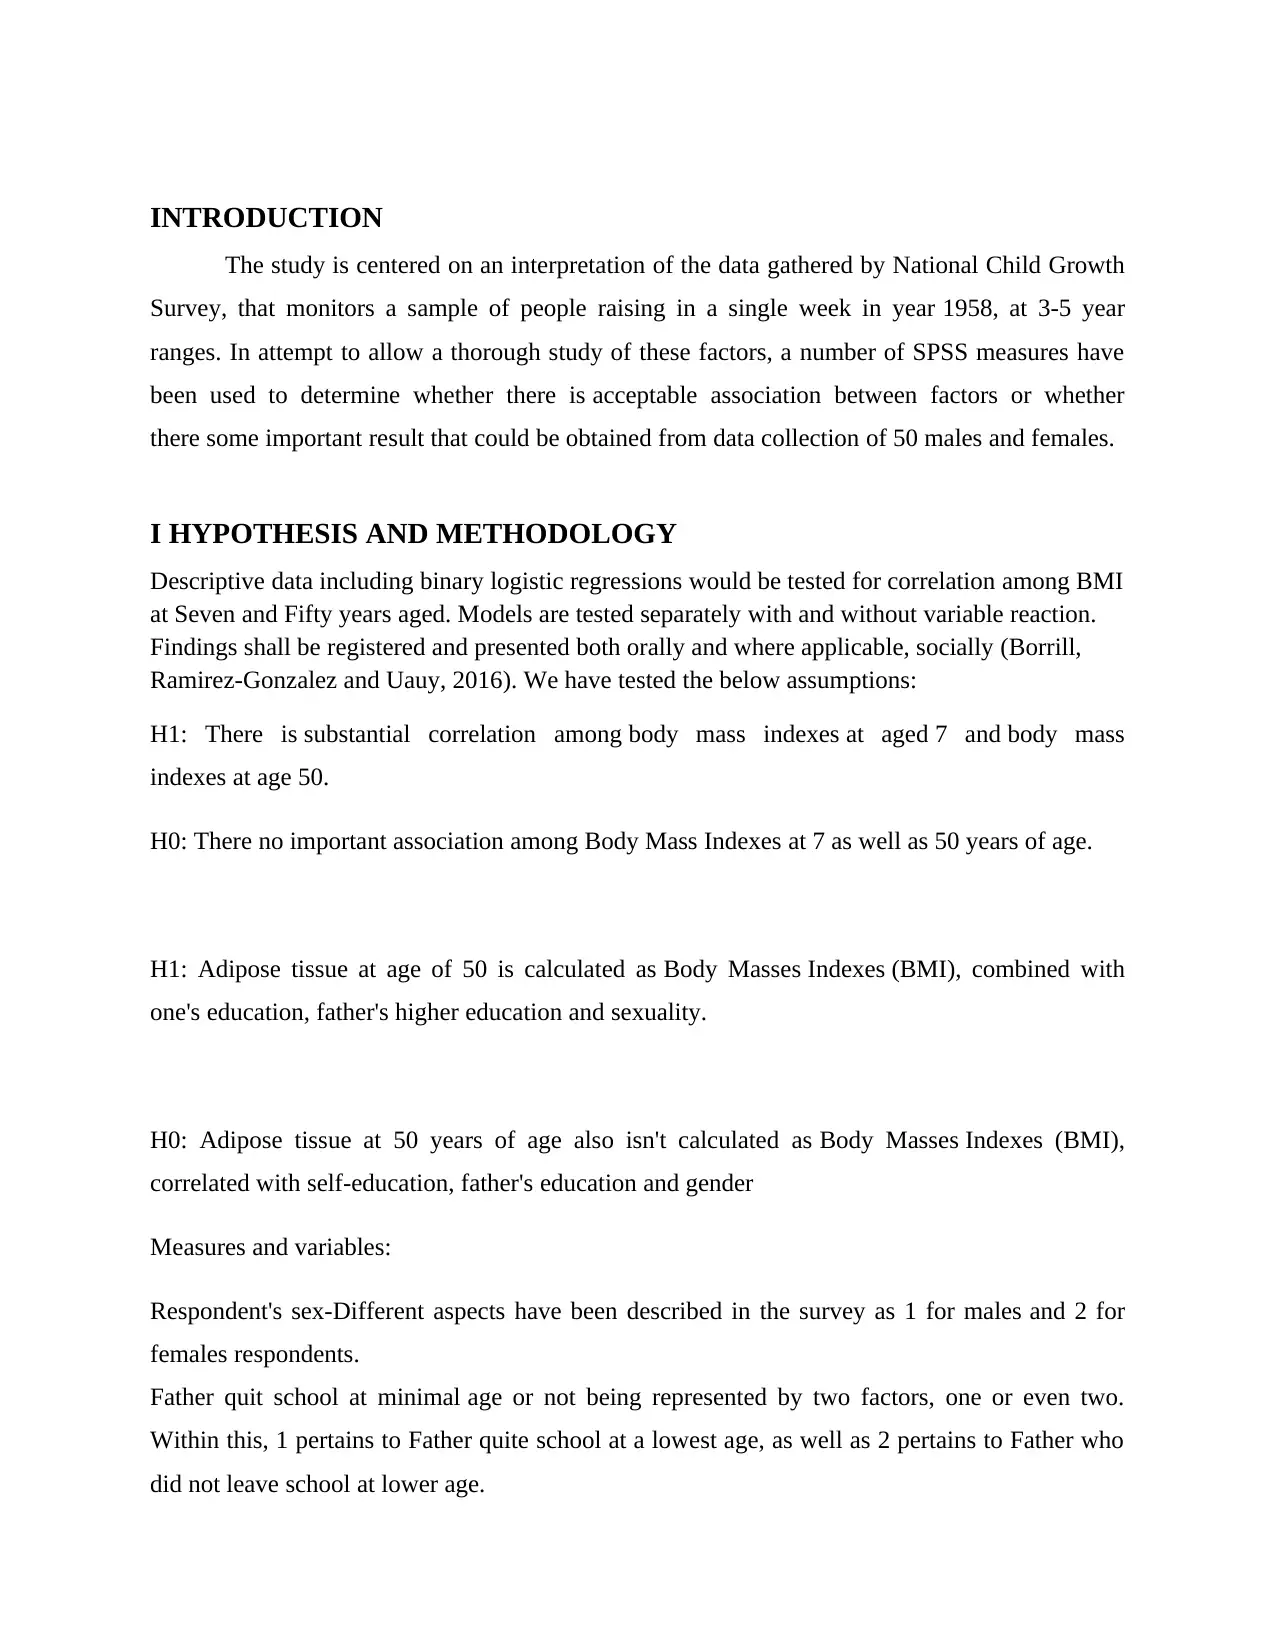
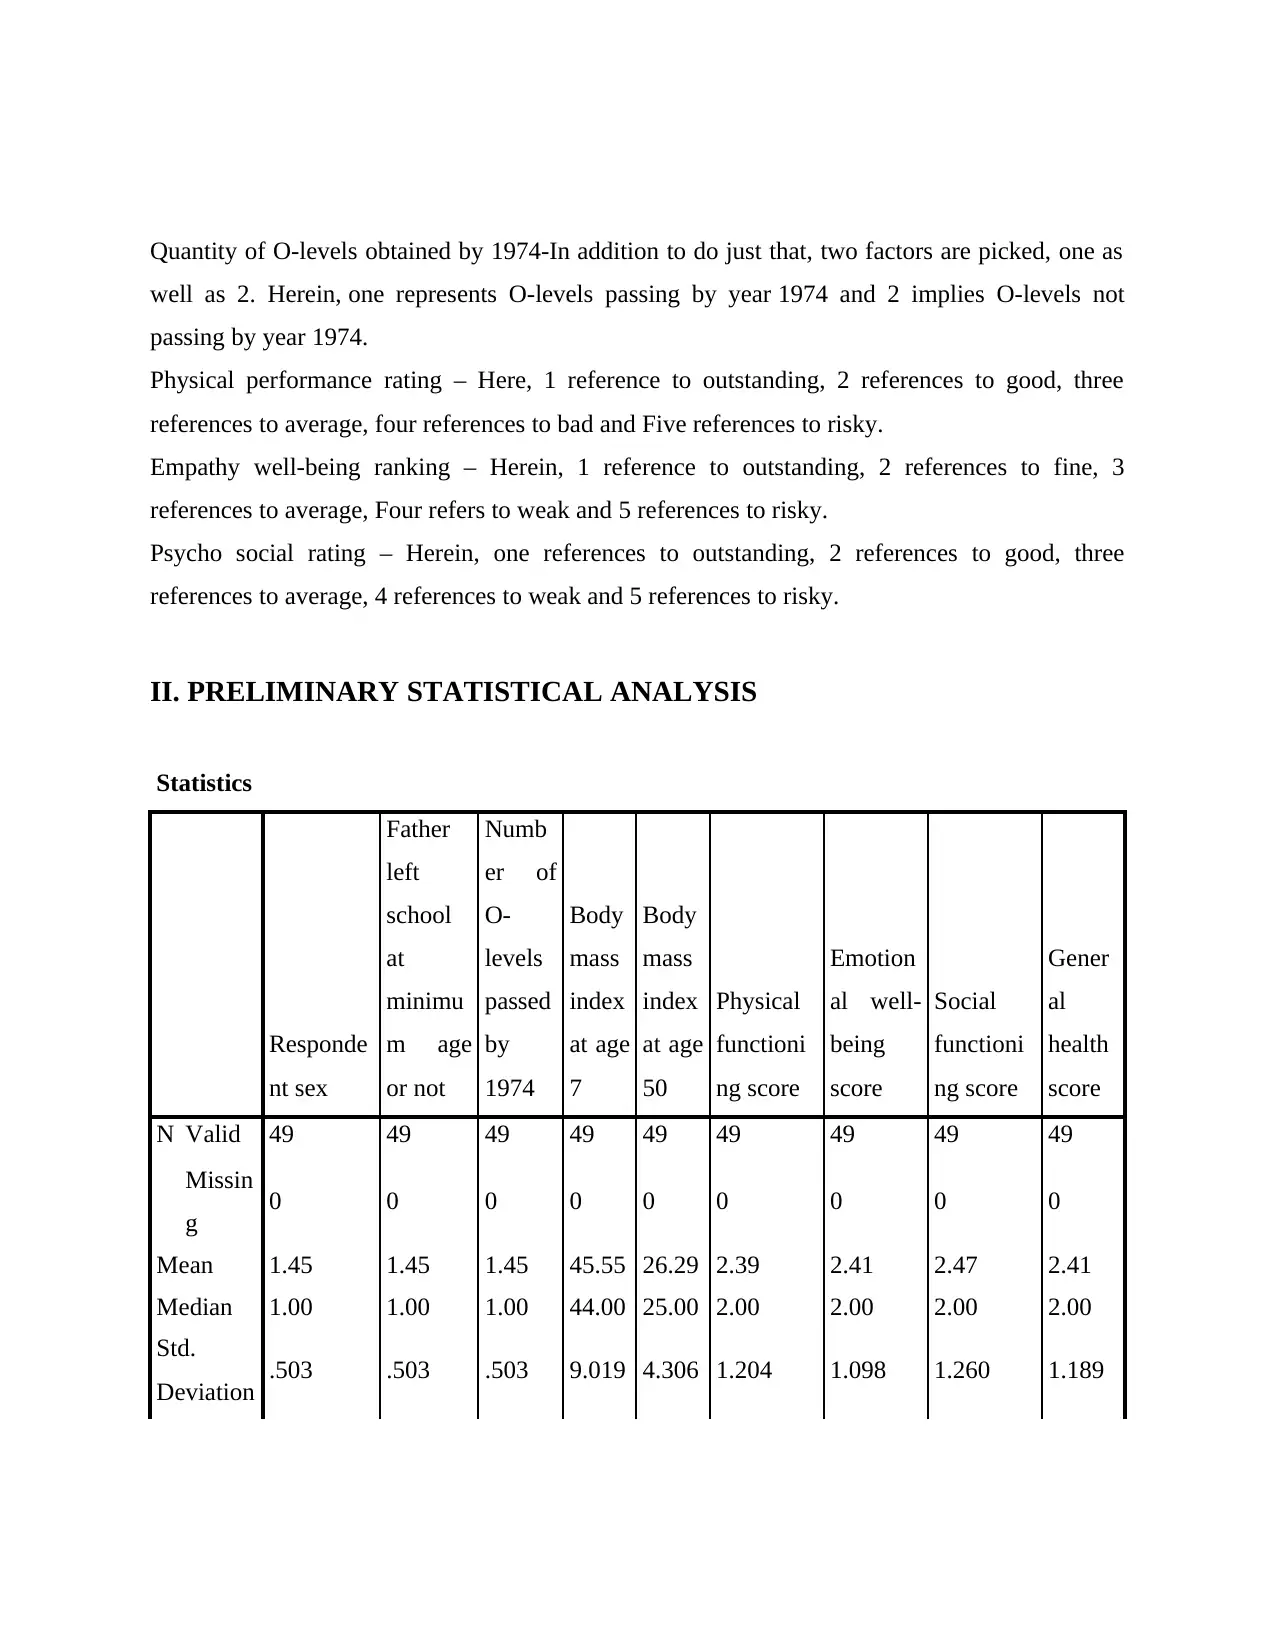
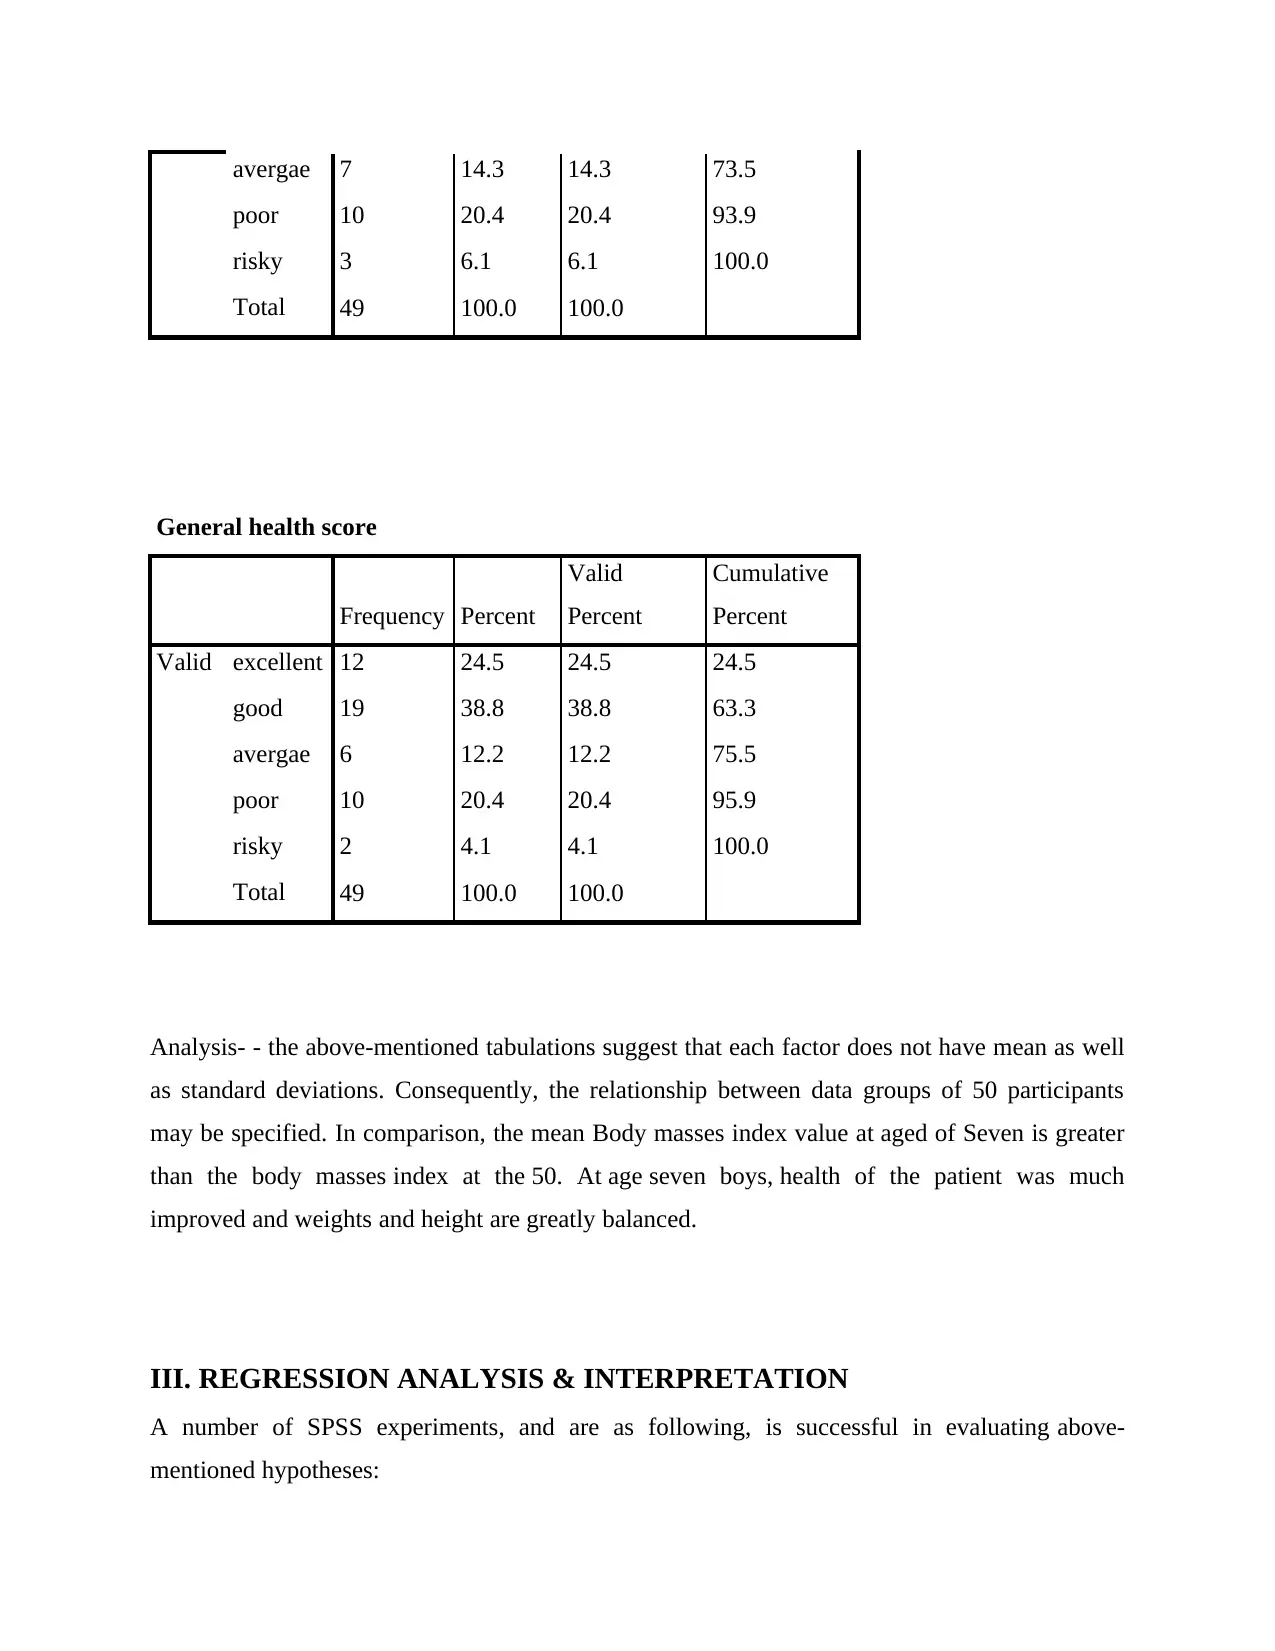
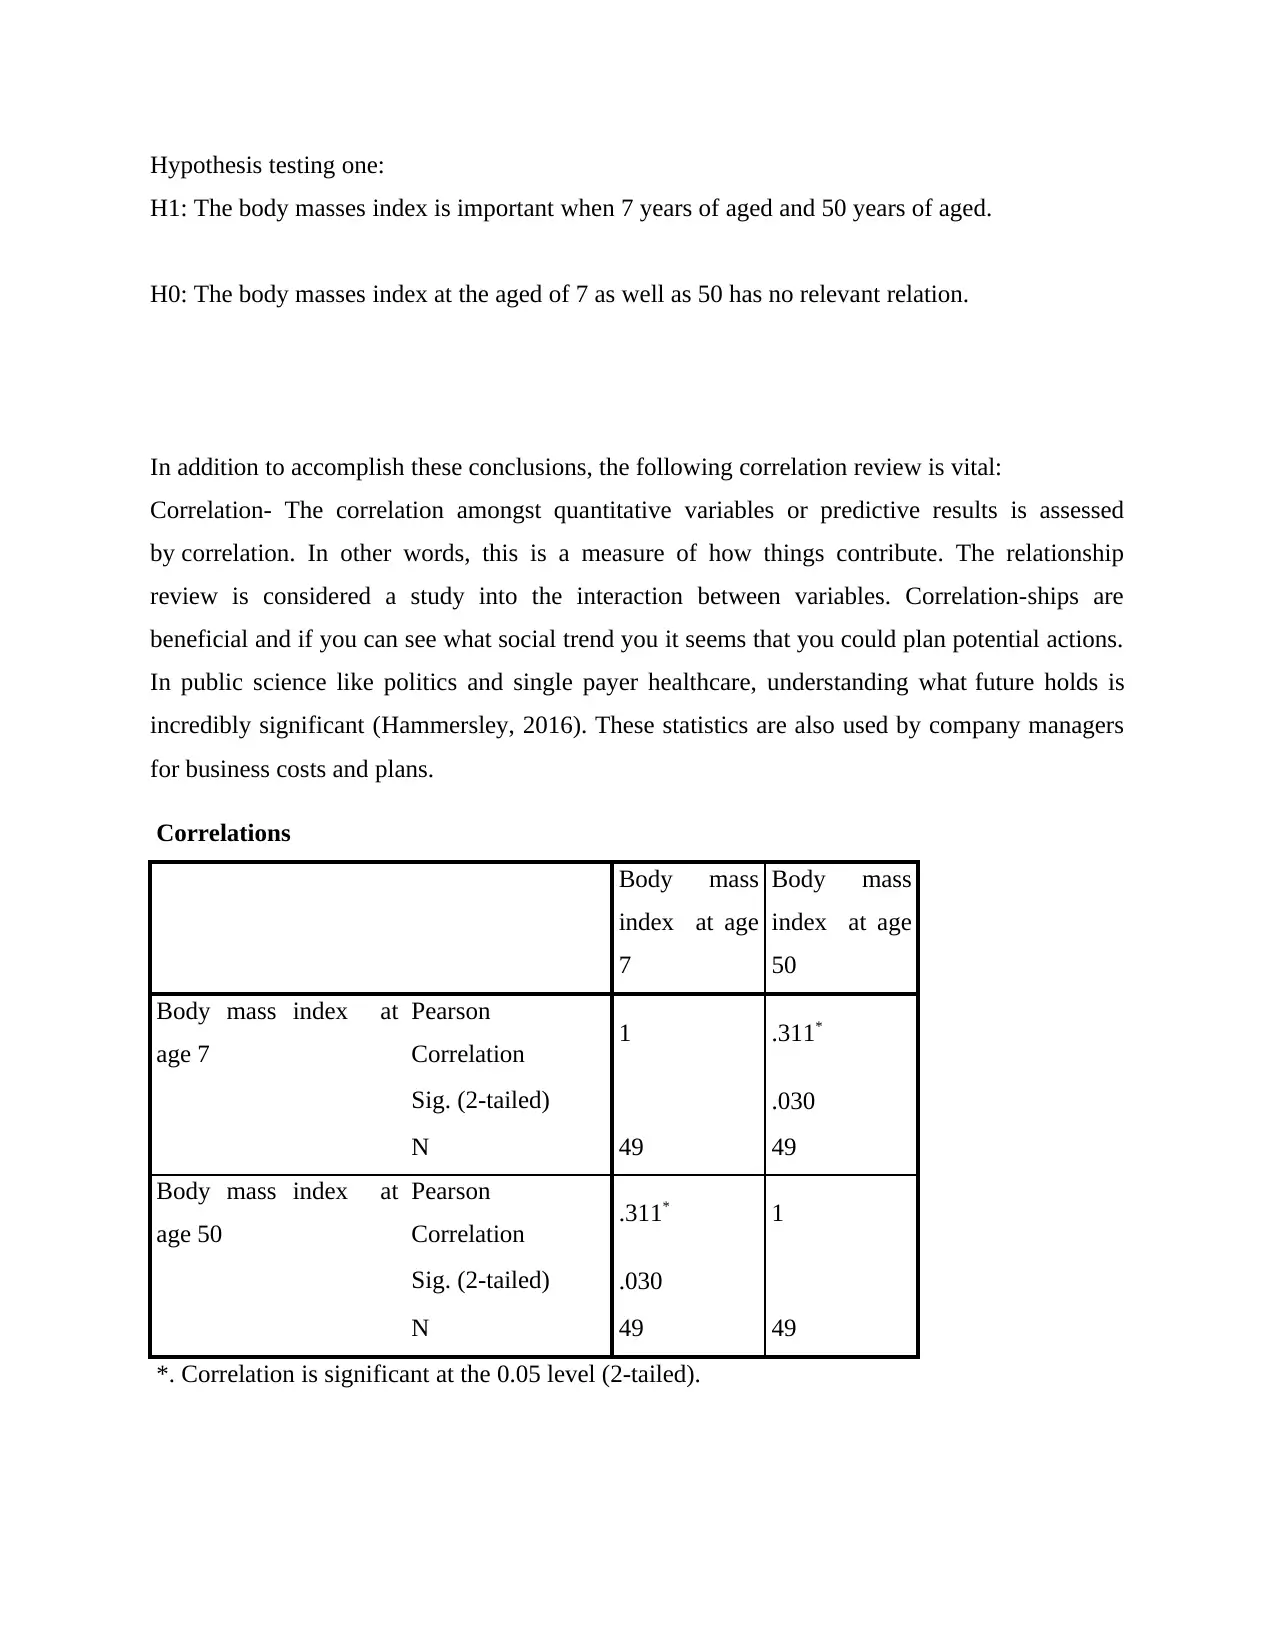
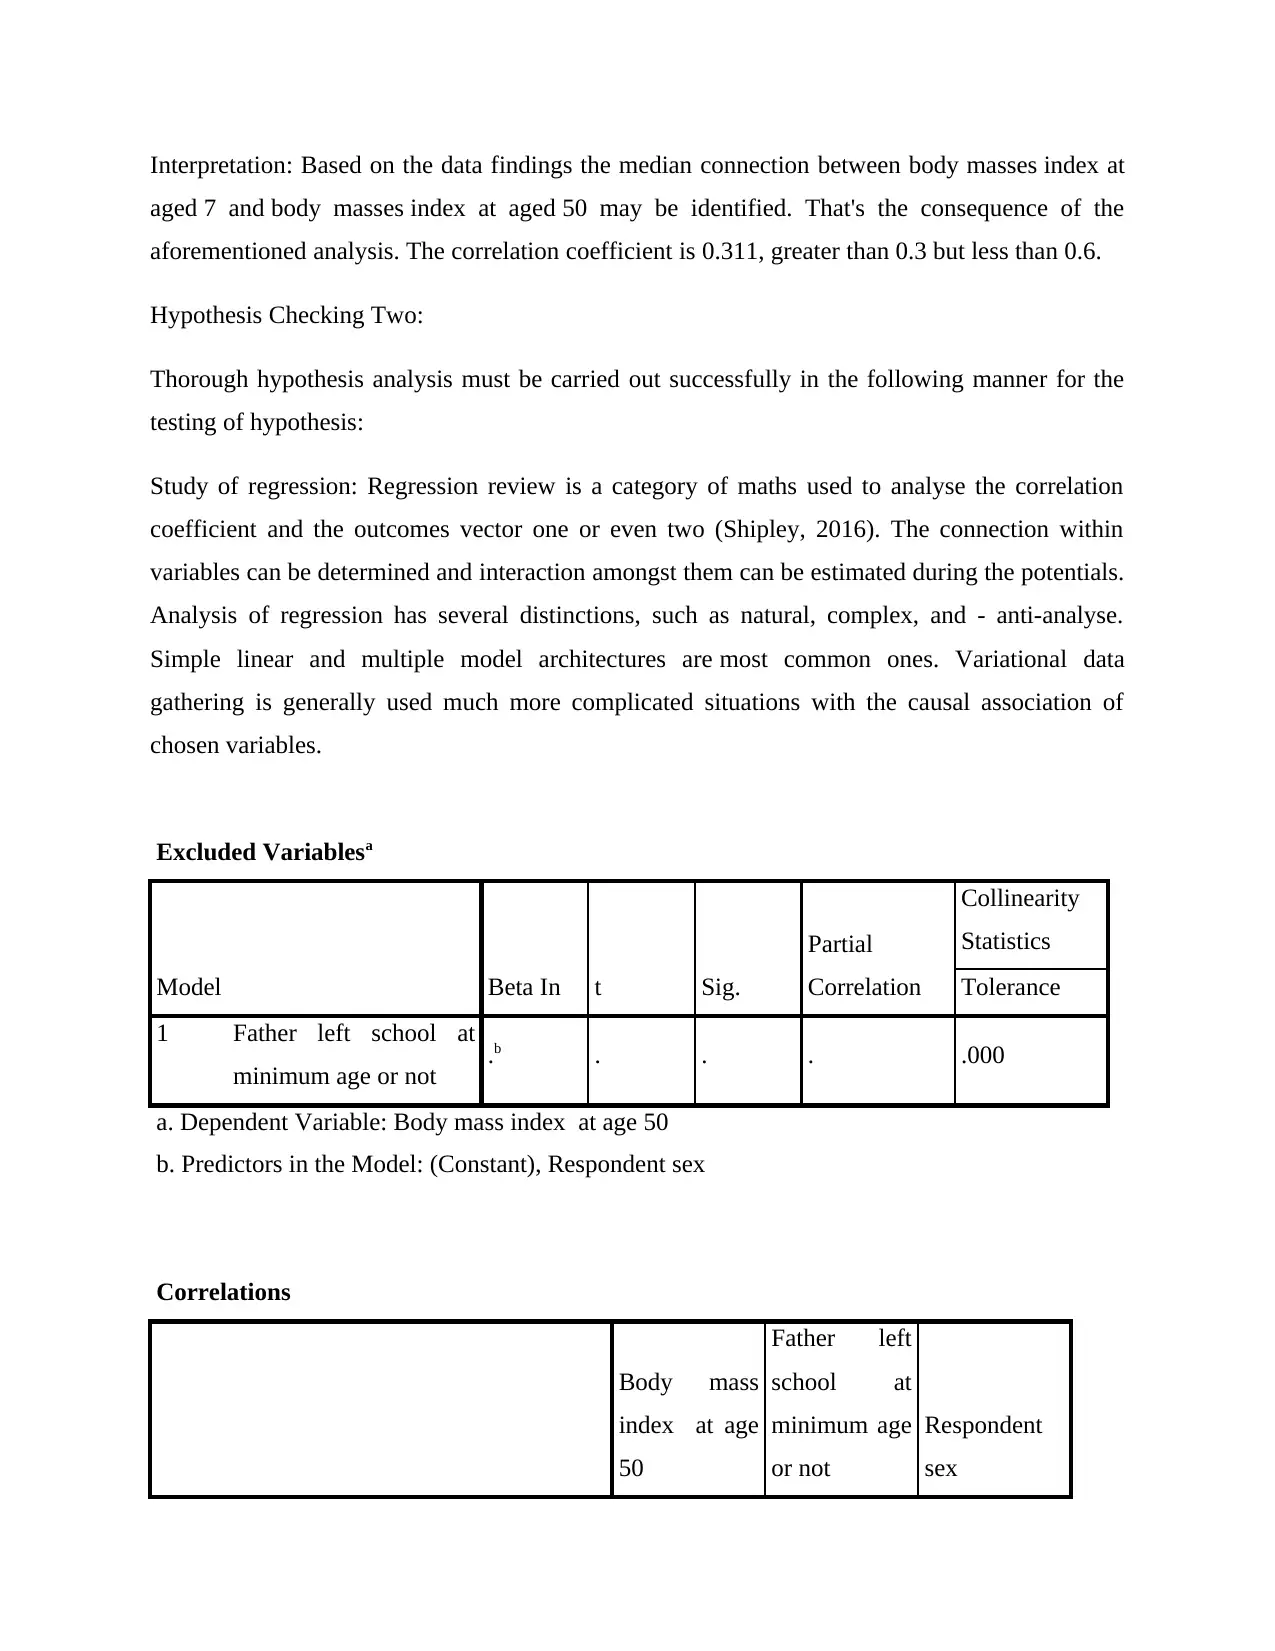
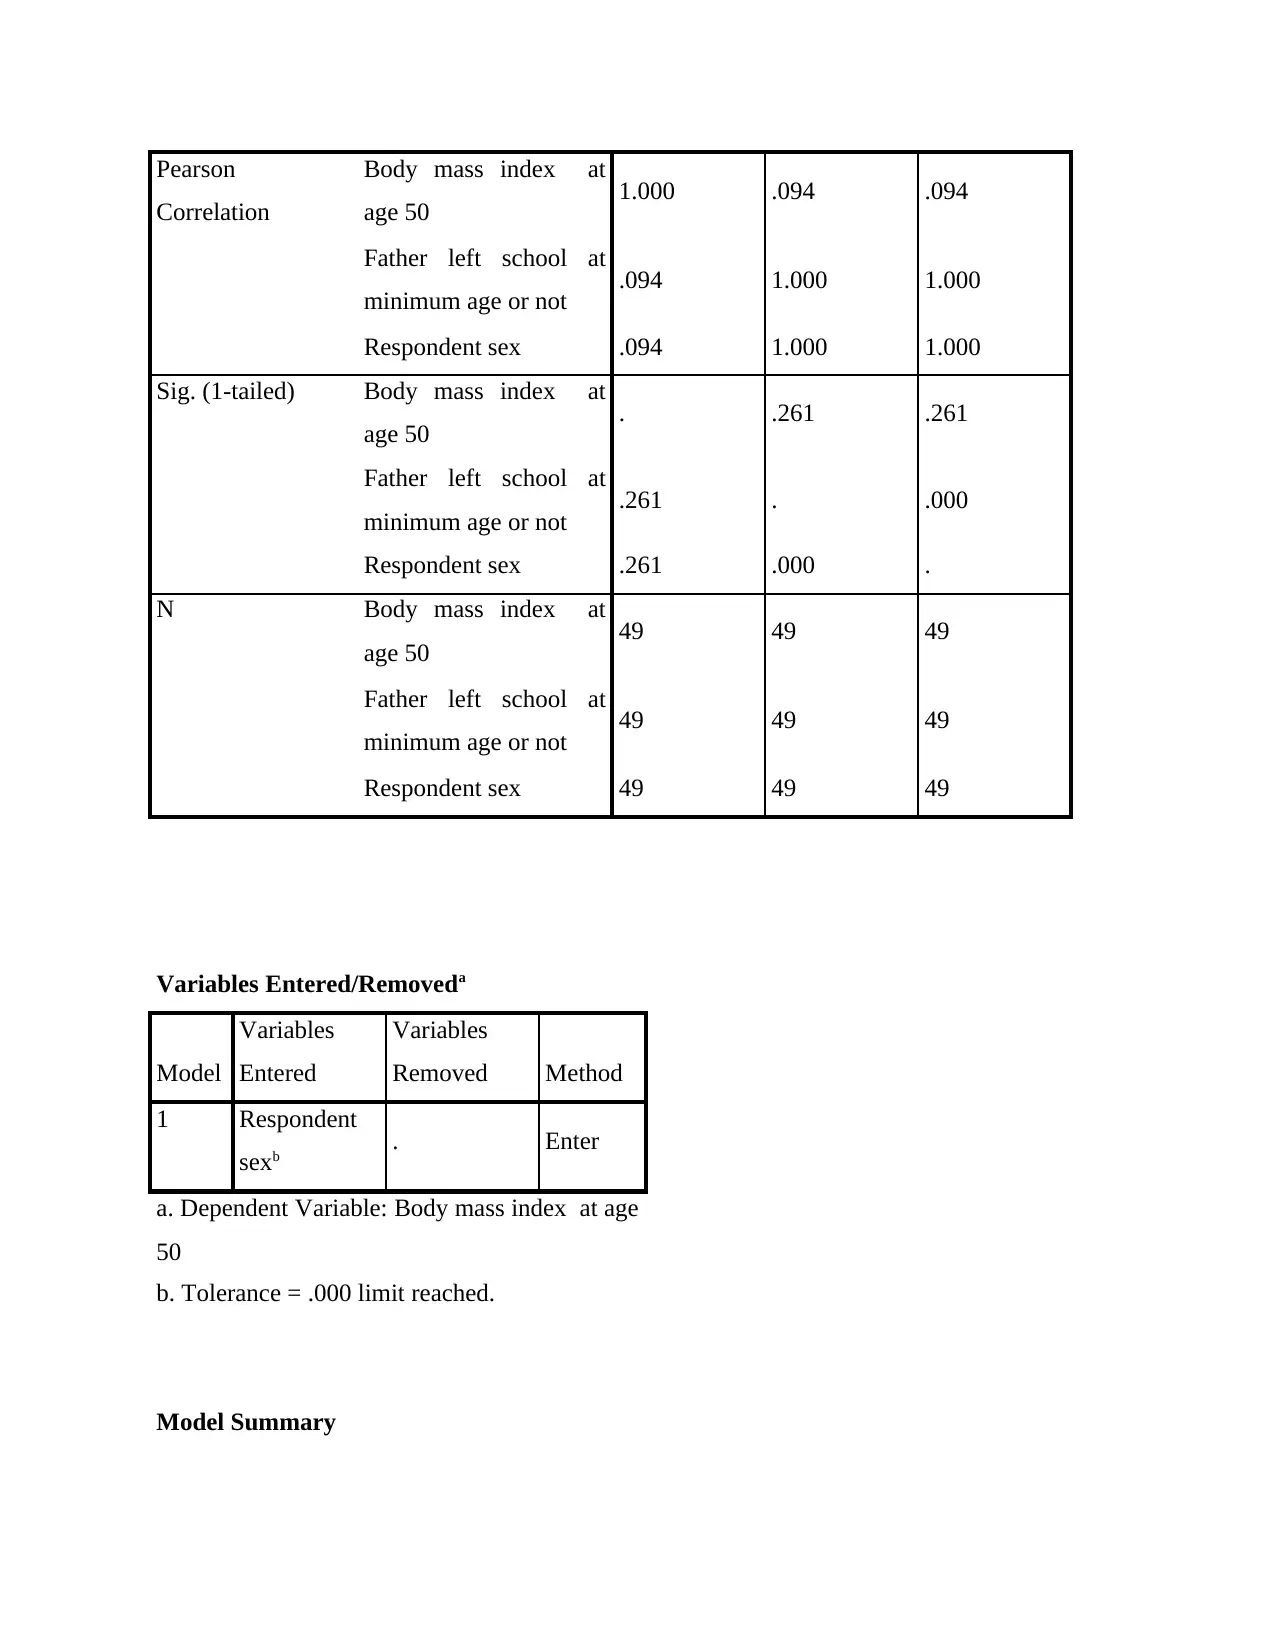
This report presents a quantitative analysis of data from the National Child Growth Survey, focusing on the interpretation of data collected from individuals over a period of time, with a particular focus on the correlation between BMI at ages 7 and 50. The study employs SPSS measures to determine associations between factors, considering data from 50 participants. The methodology includes hypothesis testing using descriptive data, binary logistic regressions, and correlation analysis. The report explores the relationships between BMI, education, and gender, along with variables like physical performance, and empathy. The analysis includes preliminary statistical analysis, correlation analysis, and regression analysis. The findings indicate a correlation between BMI at different ages and the lack of a significant link between body mass and gender or education, using statistical tools such as correlation and regression analysis. The report provides a comprehensive overview of the statistical methods used and their implications.
Document Page
Quantitative Data
Analysis Report
tabler-icon-diamond-filled.svg

Paraphrase This Document

Need a fresh take? Get an instant paraphrase of this document with our AI Paraphraser
Document Page
Contents
INTRODUCTION.......................................................................................................................................3
I HYPOTHESIS AND METHODOLOGY.................................................................................................3
II. PRELIMINARY STATISTICAL ANALYSIS.......................................................................................4
III. REGRESSION ANALYSIS & INTERPRETATION..........................................................................10
CONCLUSION.........................................................................................................................................24
REFERENCES..........................................................................................................................................26
APPENDIX...............................................................................................................................................27
Document Page
INTRODUCTION
The study is centered on an interpretation of the data gathered by National Child Growth
Survey, that monitors a sample of people raising in a single week in year 1958, at 3-5 year
ranges. In attempt to allow a thorough study of these factors, a number of SPSS measures have
been used to determine whether there is acceptable association between factors or whether
there some important result that could be obtained from data collection of 50 males and females.
I HYPOTHESIS AND METHODOLOGY
Descriptive data including binary logistic regressions would be tested for correlation among BMI
at Seven and Fifty years aged. Models are tested separately with and without variable reaction.
Findings shall be registered and presented both orally and where applicable, socially (Borrill,
Ramirez-Gonzalez and Uauy, 2016). We have tested the below assumptions:
H1: There is substantial correlation among body mass indexes at aged 7 and body mass
indexes at age 50.
H0: There no important association among Body Mass Indexes at 7 as well as 50 years of age.
H1: Adipose tissue at age of 50 is calculated as Body Masses Indexes (BMI), combined with
one's education, father's higher education and sexuality.
H0: Adipose tissue at 50 years of age also isn't calculated as Body Masses Indexes (BMI),
correlated with self-education, father's education and gender
Measures and variables:
Respondent's sex-Different aspects have been described in the survey as 1 for males and 2 for
females respondents.
Father quit school at minimal age or not being represented by two factors, one or even two.
Within this, 1 pertains to Father quite school at a lowest age, as well as 2 pertains to Father who
did not leave school at lower age.
Document Page
Quantity of O-levels obtained by 1974-In addition to do just that, two factors are picked, one as
well as 2. Herein, one represents O-levels passing by year 1974 and 2 implies O-levels not
passing by year 1974.
Physical performance rating – Here, 1 reference to outstanding, 2 references to good, three
references to average, four references to bad and Five references to risky.
Empathy well-being ranking – Herein, 1 reference to outstanding, 2 references to fine, 3
references to average, Four refers to weak and 5 references to risky.
Psycho social rating – Herein, one references to outstanding, 2 references to good, three
references to average, 4 references to weak and 5 references to risky.
II. PRELIMINARY STATISTICAL ANALYSIS
Statistics
Responde
nt sex
Father
left
school
at
minimu
m age
or not
Numb
er of
O-
levels
passed
by
1974
Body
mass
index
at age
7
Body
mass
index
at age
50
Physical
functioni
ng score
Emotion
al well-
being
score
Social
functioni
ng score
Gener
al
health
score
N Valid 49 49 49 49 49 49 49 49 49
Missin
g 0 0 0 0 0 0 0 0 0
Mean 1.45 1.45 1.45 45.55 26.29 2.39 2.41 2.47 2.41
Median 1.00 1.00 1.00 44.00 25.00 2.00 2.00 2.00 2.00
Std.
Deviation .503 .503 .503 9.019 4.306 1.204 1.098 1.260 1.189
tabler-icon-diamond-filled.svg

Paraphrase This Document

Need a fresh take? Get an instant paraphrase of this document with our AI Paraphraser
Document Page
Variance .253 .253 .253 81.33
6
18.54
2 1.451 1.205 1.588 1.413
Respondent sex
Frequency Percent
Valid
Percent
Cumulative
Percent
Valid Male 27 55.1 55.1 55.1
Female 22 44.9 44.9 100.0
Total 49 100.0 100.0
Father left school at minimum age or not
Frequency Percent
Valid
Percent
Cumulative
Percent
Valid yes 27 55.1 55.1 55.1
No 22 44.9 44.9 100.0
Total 49 100.0 100.0
Number of O-levels passed by 1974
Frequency Percent
Valid
Percent
Cumulative
Percent
Valid Yes 27 55.1 55.1 55.1
No 22 44.9 44.9 100.0
Total 49 100.0 100.0
Document Page
Body mass index at age 7
Frequency Percent
Valid
Percent
Cumulative
Percent
Valid 30 1 2.0 2.0 2.0
34 2 4.1 4.1 6.1
35 1 2.0 2.0 8.2
36 2 4.1 4.1 12.2
37 2 4.1 4.1 16.3
38 2 4.1 4.1 20.4
39 2 4.1 4.1 24.5
40 3 6.1 6.1 30.6
41 2 4.1 4.1 34.7
42 4 8.2 8.2 42.9
43 3 6.1 6.1 49.0
44 2 4.1 4.1 53.1
45 5 10.2 10.2 63.3
46 2 4.1 4.1 67.3
47 2 4.1 4.1 71.4
48 2 4.1 4.1 75.5
49 1 2.0 2.0 77.6
51 1 2.0 2.0 79.6
53 1 2.0 2.0 81.6
54 1 2.0 2.0 83.7
57 2 4.1 4.1 87.8
60 1 2.0 2.0 89.8
61 1 2.0 2.0 91.8
63 1 2.0 2.0 93.9
65 1 2.0 2.0 95.9
66 1 2.0 2.0 98.0
Document Page
69 1 2.0 2.0 100.0
Total 49 100.0 100.0
Body mass index at age 50
Frequency Percent
Valid
Percent
Cumulative
Percent
Valid 17 1 2.0 2.0 2.0
19 2 4.1 4.1 6.1
21 3 6.1 6.1 12.2
22 1 2.0 2.0 14.3
23 3 6.1 6.1 20.4
24 9 18.4 18.4 38.8
25 6 12.2 12.2 51.0
26 4 8.2 8.2 59.2
27 4 8.2 8.2 67.3
28 2 4.1 4.1 71.4
29 3 6.1 6.1 77.6
30 1 2.0 2.0 79.6
31 4 8.2 8.2 87.8
32 1 2.0 2.0 89.8
33 2 4.1 4.1 93.9
34 1 2.0 2.0 95.9
35 1 2.0 2.0 98.0
37 1 2.0 2.0 100.0
Total 49 100.0 100.0
tabler-icon-diamond-filled.svg

Paraphrase This Document

Need a fresh take? Get an instant paraphrase of this document with our AI Paraphraser
Document Page
Physical functioning score
Frequency Percent
Valid
Percent
Cumulative
Percent
Valid Excellent 14 28.6 28.6 28.6
Good 15 30.6 30.6 59.2
Average 9 18.4 18.4 77.6
Poor 9 18.4 18.4 95.9
Risky 2 4.1 4.1 100.0
Total 49 100.0 100.0
Emotional well-being score
Frequency Percent
Valid
Percent
Cumulative
Percent
Valid excellent 11 22.4 22.4 22.4
good 18 36.7 36.7 59.2
avergae 10 20.4 20.4 79.6
poor 9 18.4 18.4 98.0
risky 1 2.0 2.0 100.0
Total 49 100.0 100.0
Social functioning score
Frequency Percent
Valid
Percent
Cumulative
Percent
Valid excellent 13 26.5 26.5 26.5
good 16 32.7 32.7 59.2
Document Page
avergae 7 14.3 14.3 73.5
poor 10 20.4 20.4 93.9
risky 3 6.1 6.1 100.0
Total 49 100.0 100.0
General health score
Frequency Percent
Valid
Percent
Cumulative
Percent
Valid excellent 12 24.5 24.5 24.5
good 19 38.8 38.8 63.3
avergae 6 12.2 12.2 75.5
poor 10 20.4 20.4 95.9
risky 2 4.1 4.1 100.0
Total 49 100.0 100.0
Analysis- - the above-mentioned tabulations suggest that each factor does not have mean as well
as standard deviations. Consequently, the relationship between data groups of 50 participants
may be specified. In comparison, the mean Body masses index value at aged of Seven is greater
than the body masses index at the 50. At age seven boys, health of the patient was much
improved and weights and height are greatly balanced.
III. REGRESSION ANALYSIS & INTERPRETATION
A number of SPSS experiments, and are as following, is successful in evaluating above-
mentioned hypotheses:
Document Page
Hypothesis testing one:
H1: The body masses index is important when 7 years of aged and 50 years of aged.
H0: The body masses index at the aged of 7 as well as 50 has no relevant relation.
In addition to accomplish these conclusions, the following correlation review is vital:
Correlation- The correlation amongst quantitative variables or predictive results is assessed
by correlation. In other words, this is a measure of how things contribute. The relationship
review is considered a study into the interaction between variables. Correlation-ships are
beneficial and if you can see what social trend you it seems that you could plan potential actions.
In public science like politics and single payer healthcare, understanding what future holds is
incredibly significant (Hammersley, 2016). These statistics are also used by company managers
for business costs and plans.
Correlations
Body mass
index at age
7
Body mass
index at age
50
Body mass index at
age 7
Pearson
Correlation 1 .311*
Sig. (2-tailed) .030
N 49 49
Body mass index at
age 50
Pearson
Correlation .311* 1
Sig. (2-tailed) .030
N 49 49
*. Correlation is significant at the 0.05 level (2-tailed).
tabler-icon-diamond-filled.svg

Paraphrase This Document

Need a fresh take? Get an instant paraphrase of this document with our AI Paraphraser
Document Page
Interpretation: Based on the data findings the median connection between body masses index at
aged 7 and body masses index at aged 50 may be identified. That's the consequence of the
aforementioned analysis. The correlation coefficient is 0.311, greater than 0.3 but less than 0.6.
Hypothesis Checking Two:
Thorough hypothesis analysis must be carried out successfully in the following manner for the
testing of hypothesis:
Study of regression: Regression review is a category of maths used to analyse the correlation
coefficient and the outcomes vector one or even two (Shipley, 2016). The connection within
variables can be determined and interaction amongst them can be estimated during the potentials.
Analysis of regression has several distinctions, such as natural, complex, and - anti-analyse.
Simple linear and multiple model architectures are most common ones. Variational data
gathering is generally used much more complicated situations with the causal association of
chosen variables.
Excluded Variablesa
Model Beta In t Sig.
Partial
Correlation
Collinearity
Statistics
Tolerance
1 Father left school at
minimum age or not .b . . . .000
a. Dependent Variable: Body mass index at age 50
b. Predictors in the Model: (Constant), Respondent sex
Correlations
Body mass
index at age
50
Father left
school at
minimum age
or not
Respondent
sex
Document Page
Pearson
Correlation
Body mass index at
age 50 1.000 .094 .094
Father left school at
minimum age or not .094 1.000 1.000
Respondent sex .094 1.000 1.000
Sig. (1-tailed) Body mass index at
age 50 . .261 .261
Father left school at
minimum age or not .261 . .000
Respondent sex .261 .000 .
N Body mass index at
age 50 49 49 49
Father left school at
minimum age or not 49 49 49
Respondent sex 49 49 49
Variables Entered/Removeda
Model
Variables
Entered
Variables
Removed Method
1 Respondent
sexb . Enter
a. Dependent Variable: Body mass index at age
50
b. Tolerance = .000 limit reached.
Model Summary
chevron_up_icon
1 out of 27
circle_padding
hide_on_mobile
zoom_out_icon
[object Object]