NURS710: Statistical Analysis Assignment - University Name
VerifiedAdded on 2022/08/13
|12
|1506
|10
Homework Assignment
AI Summary
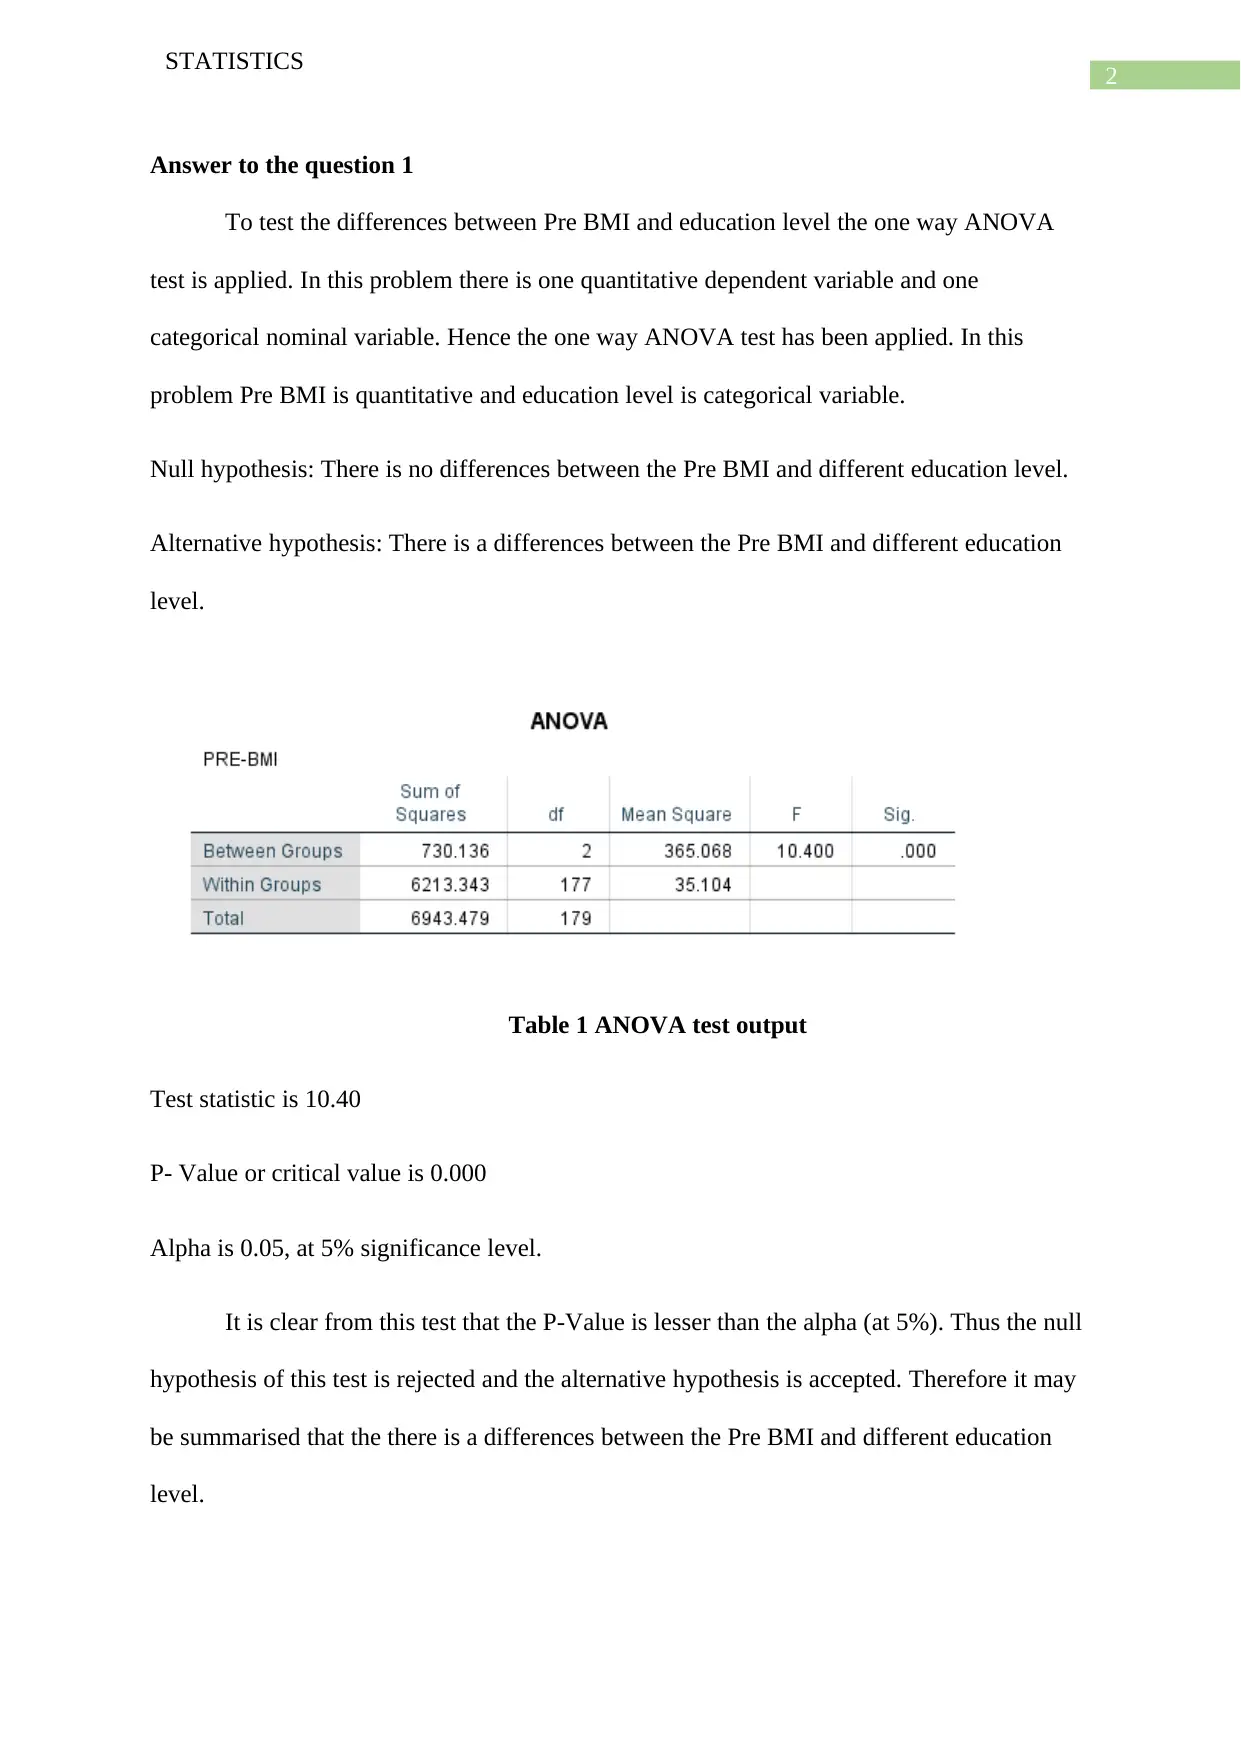
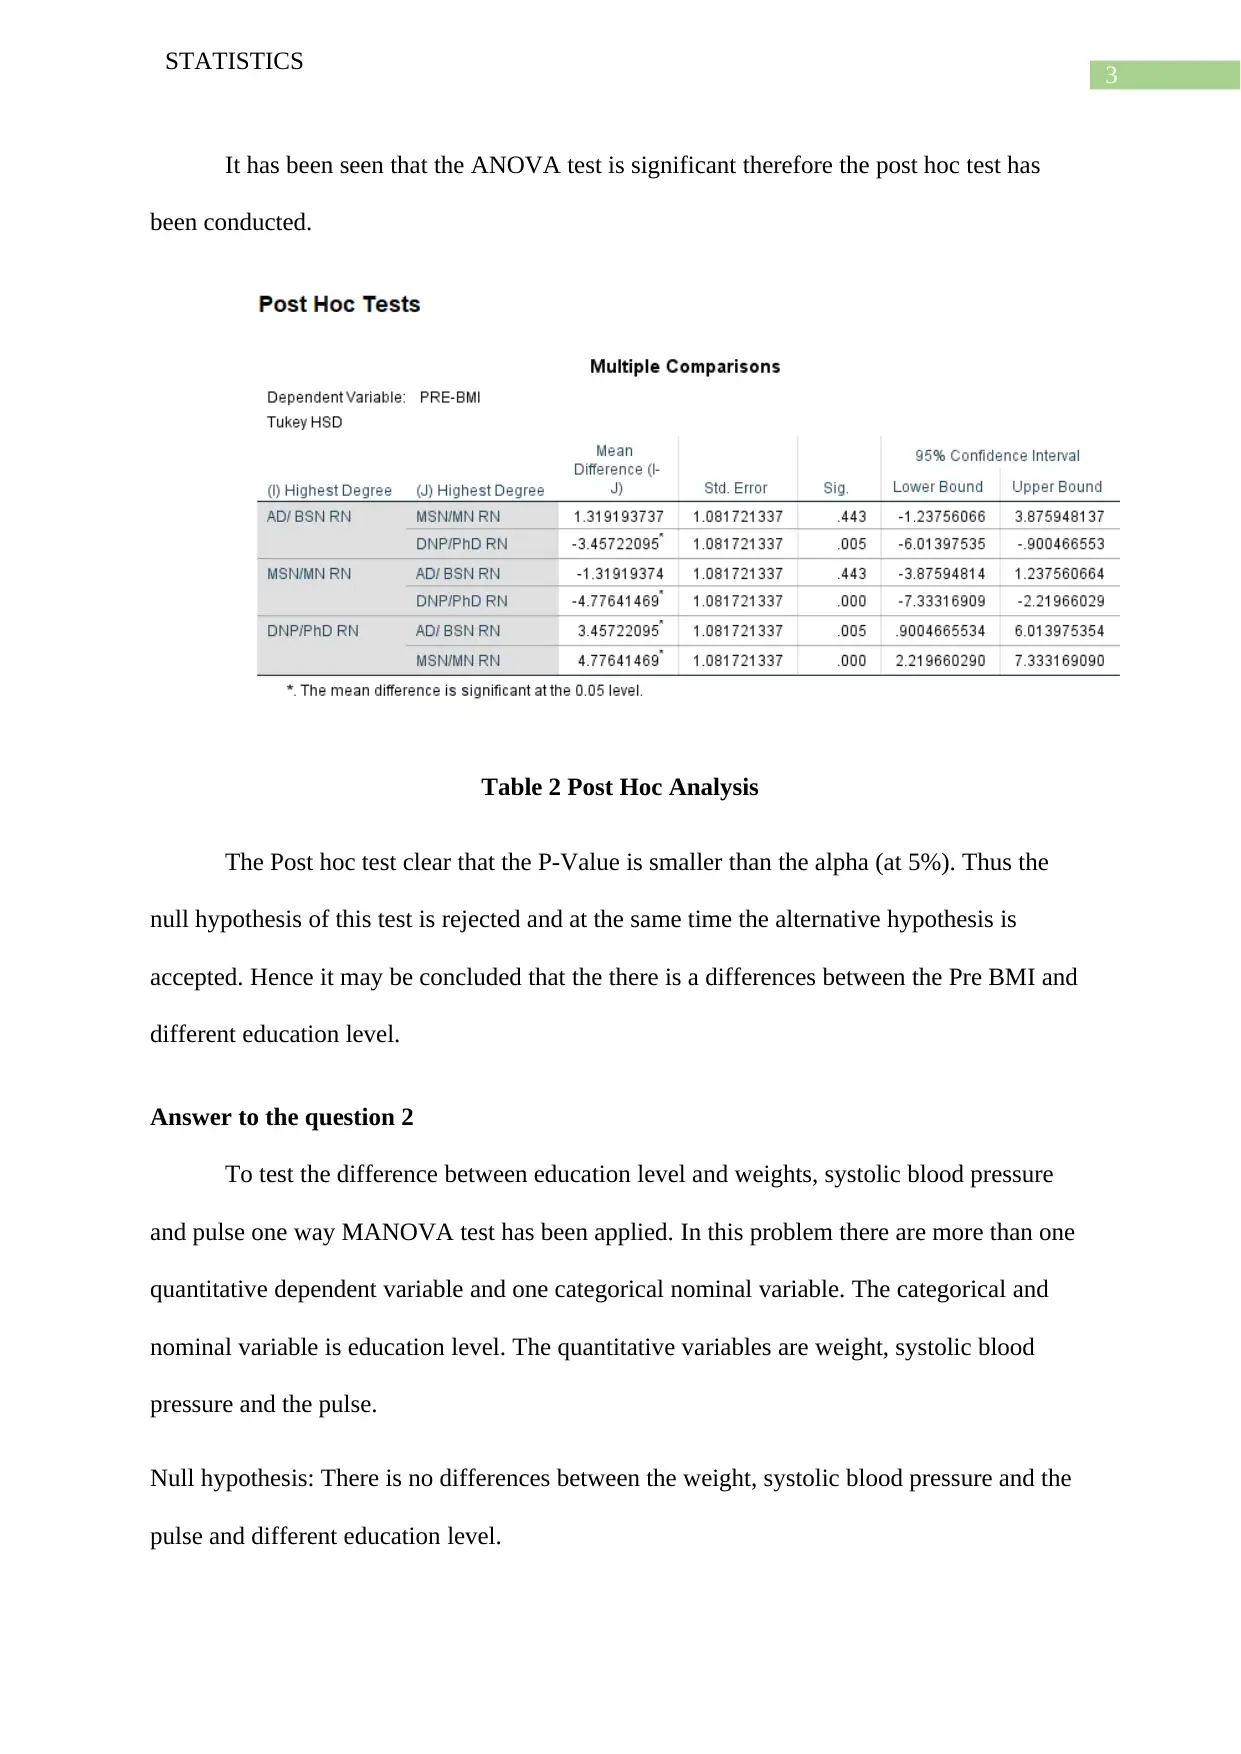
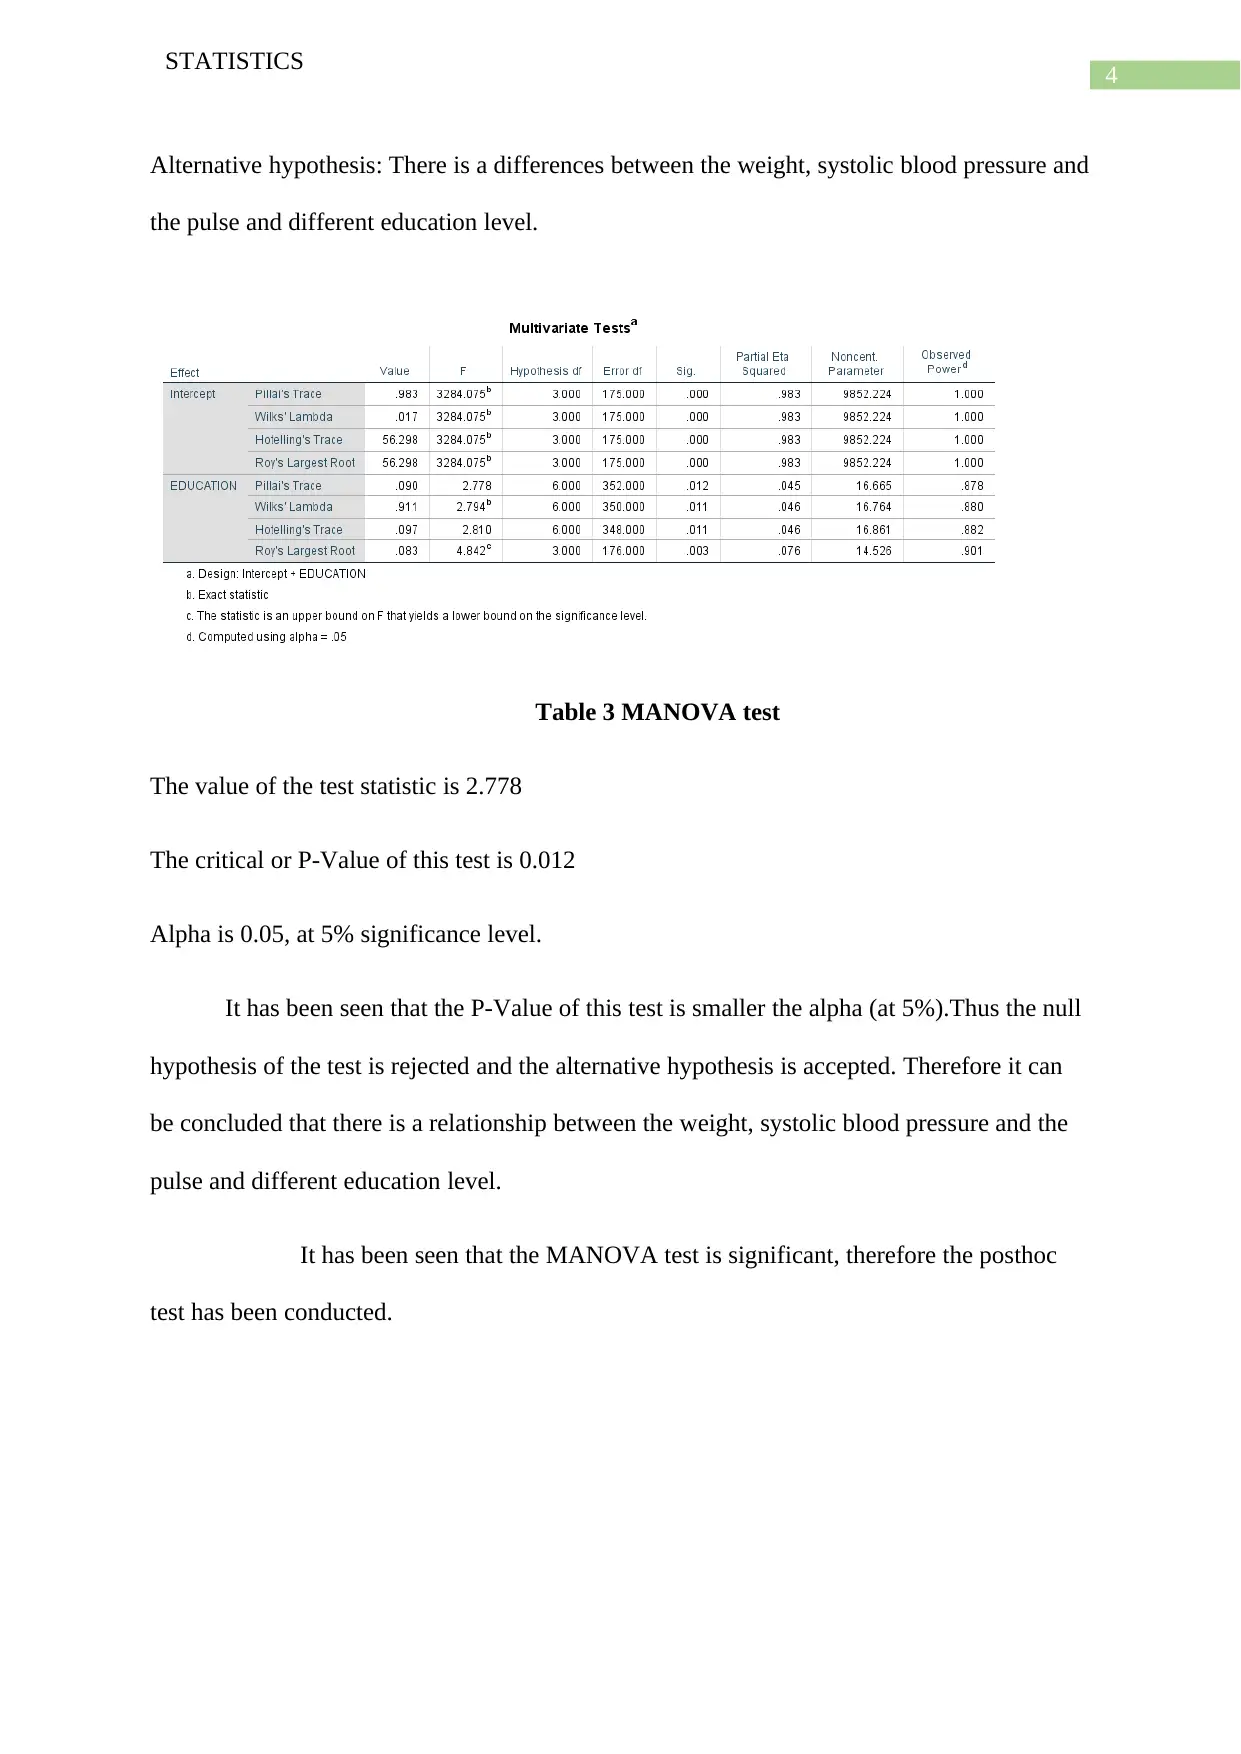
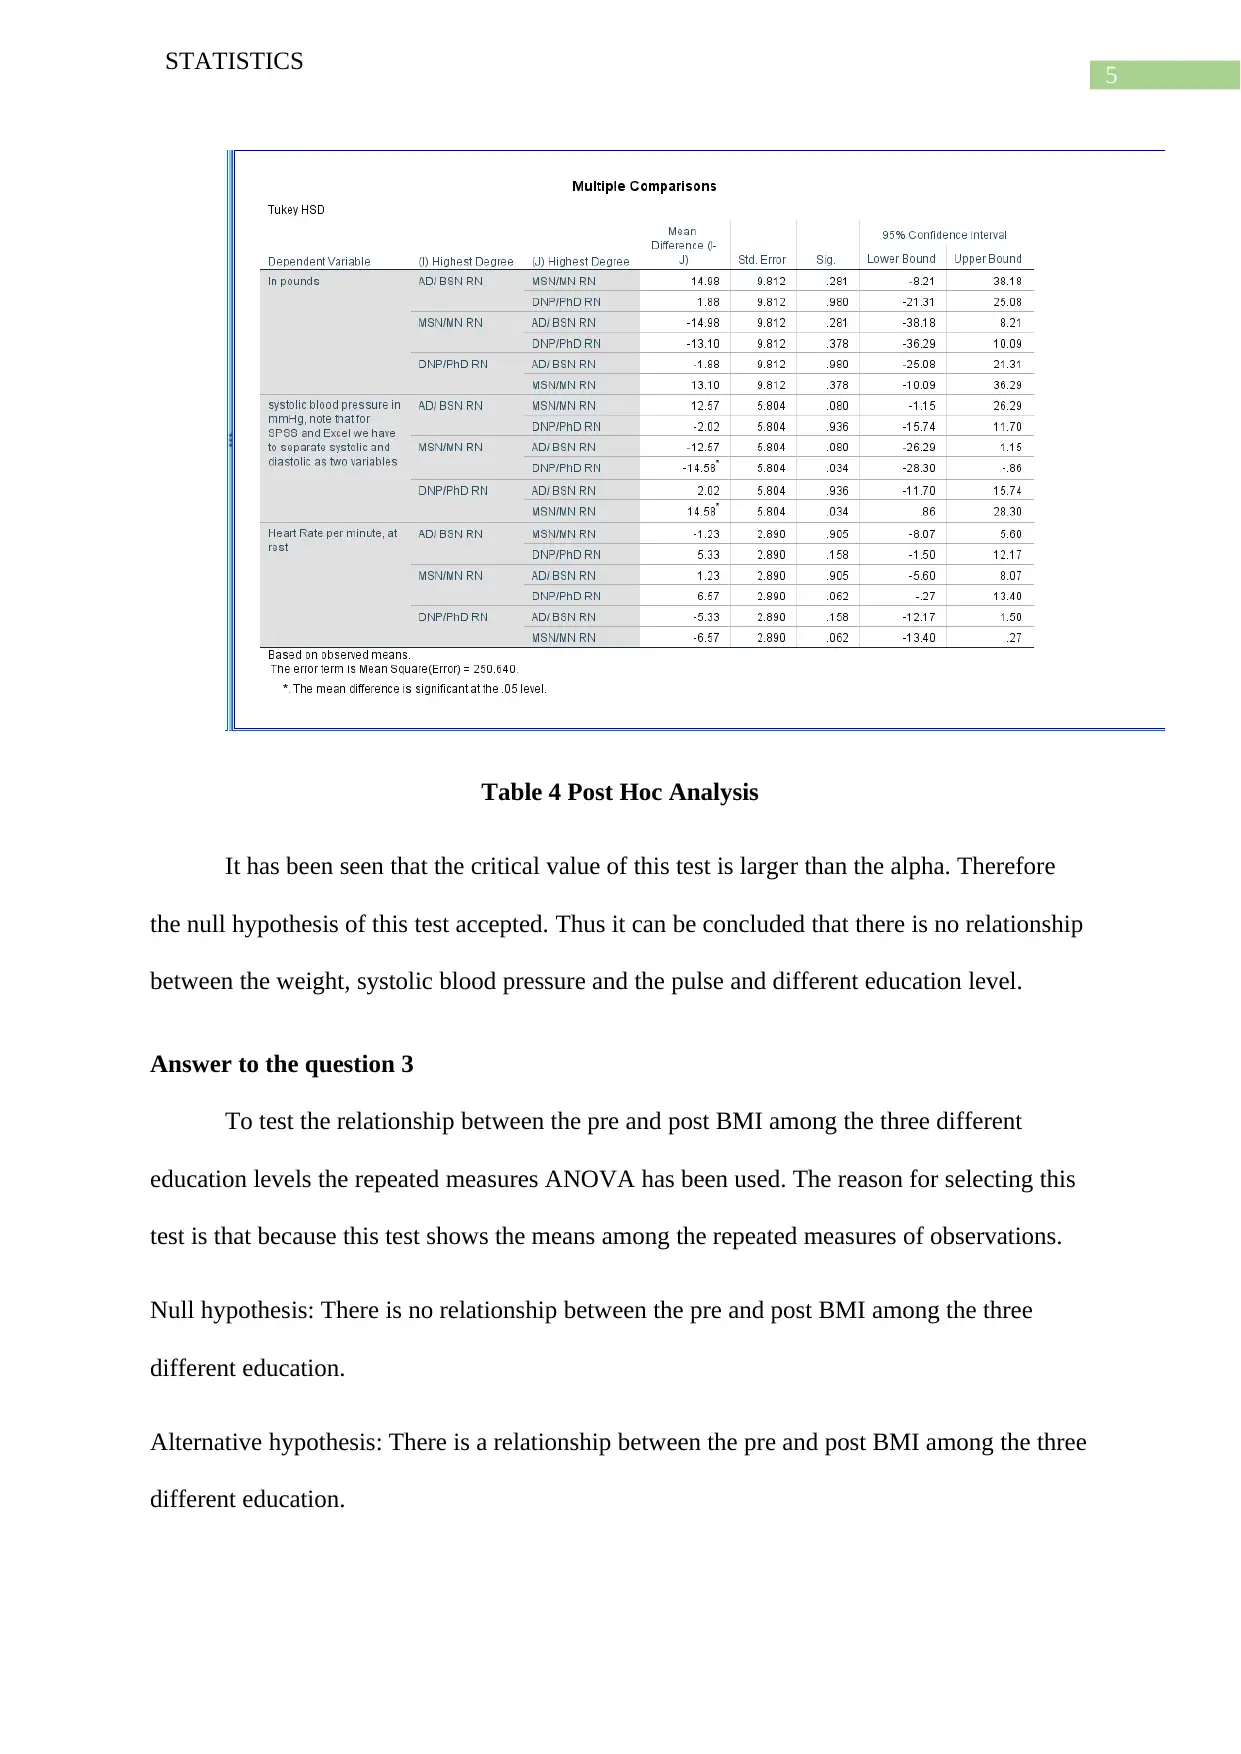
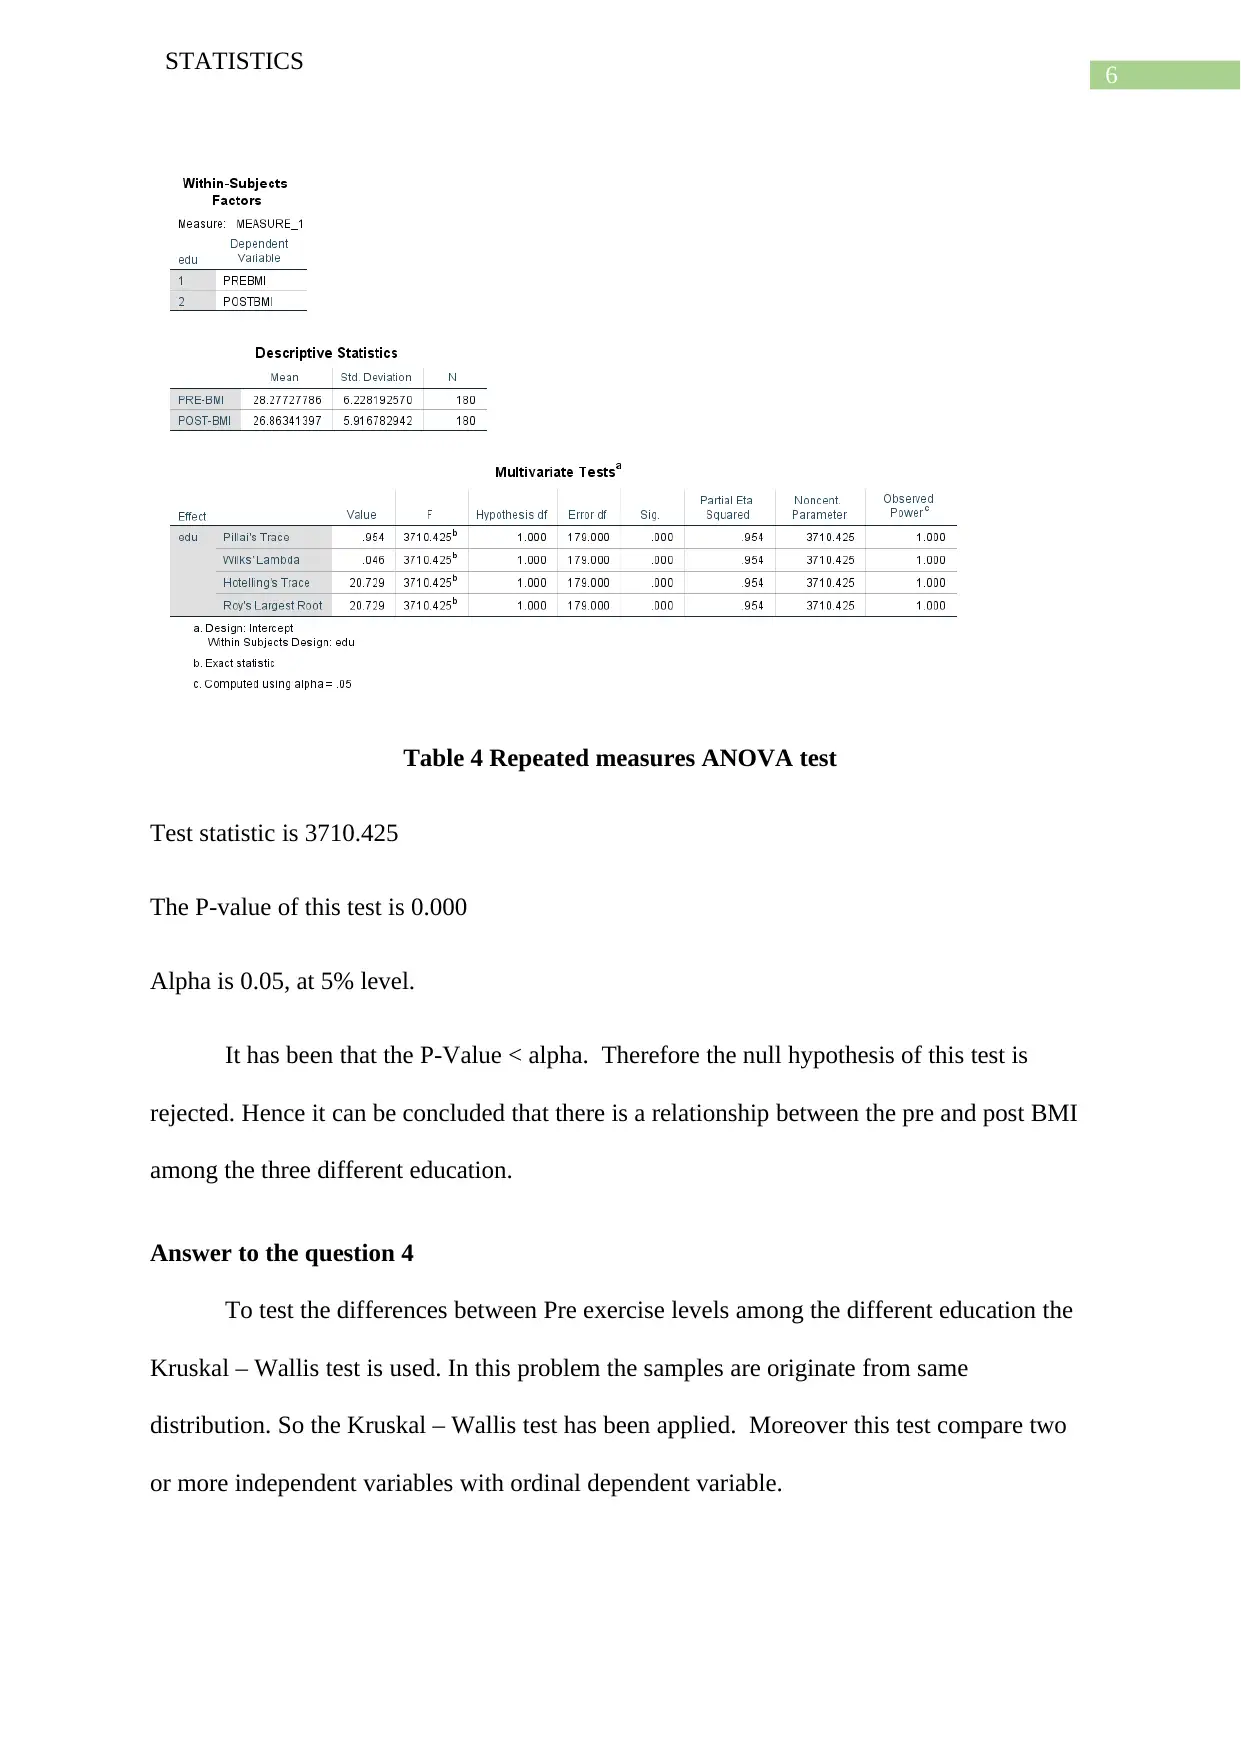
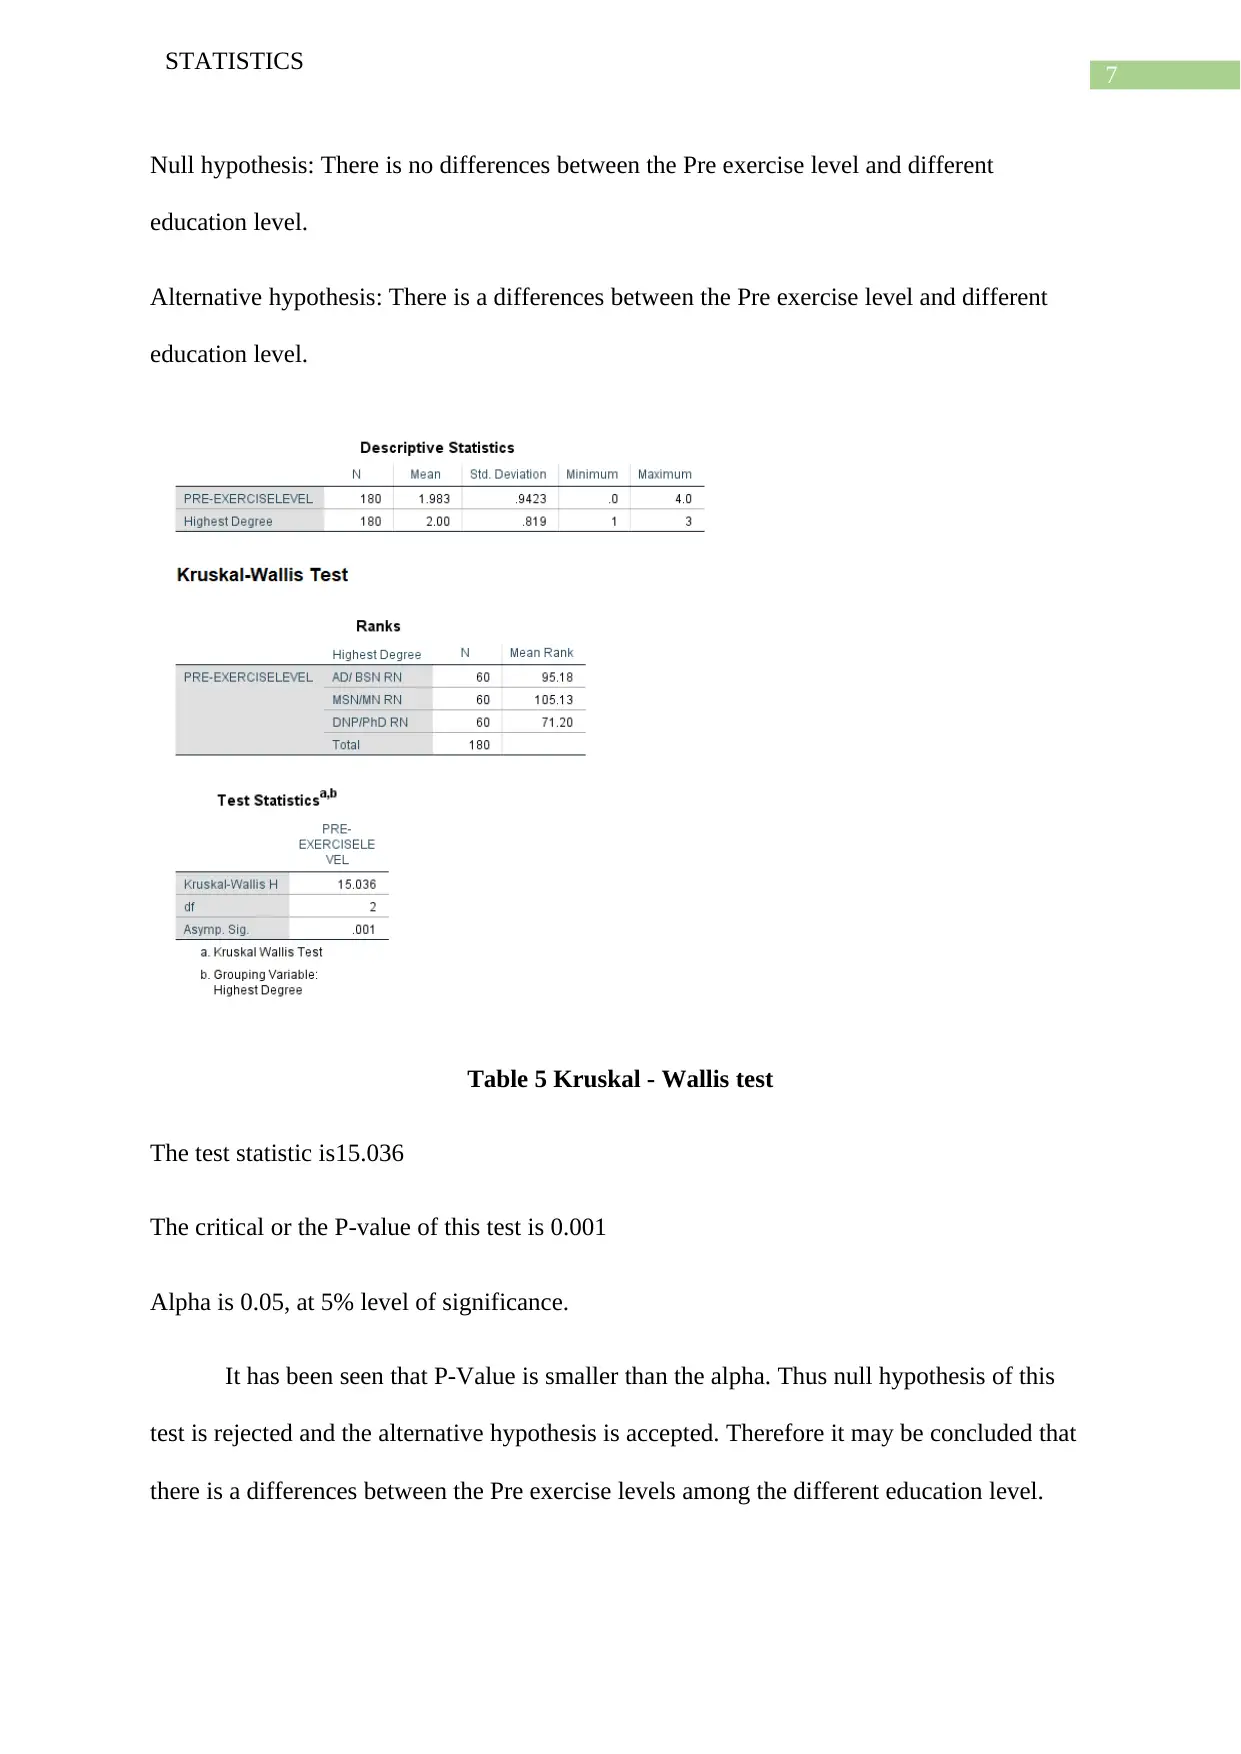
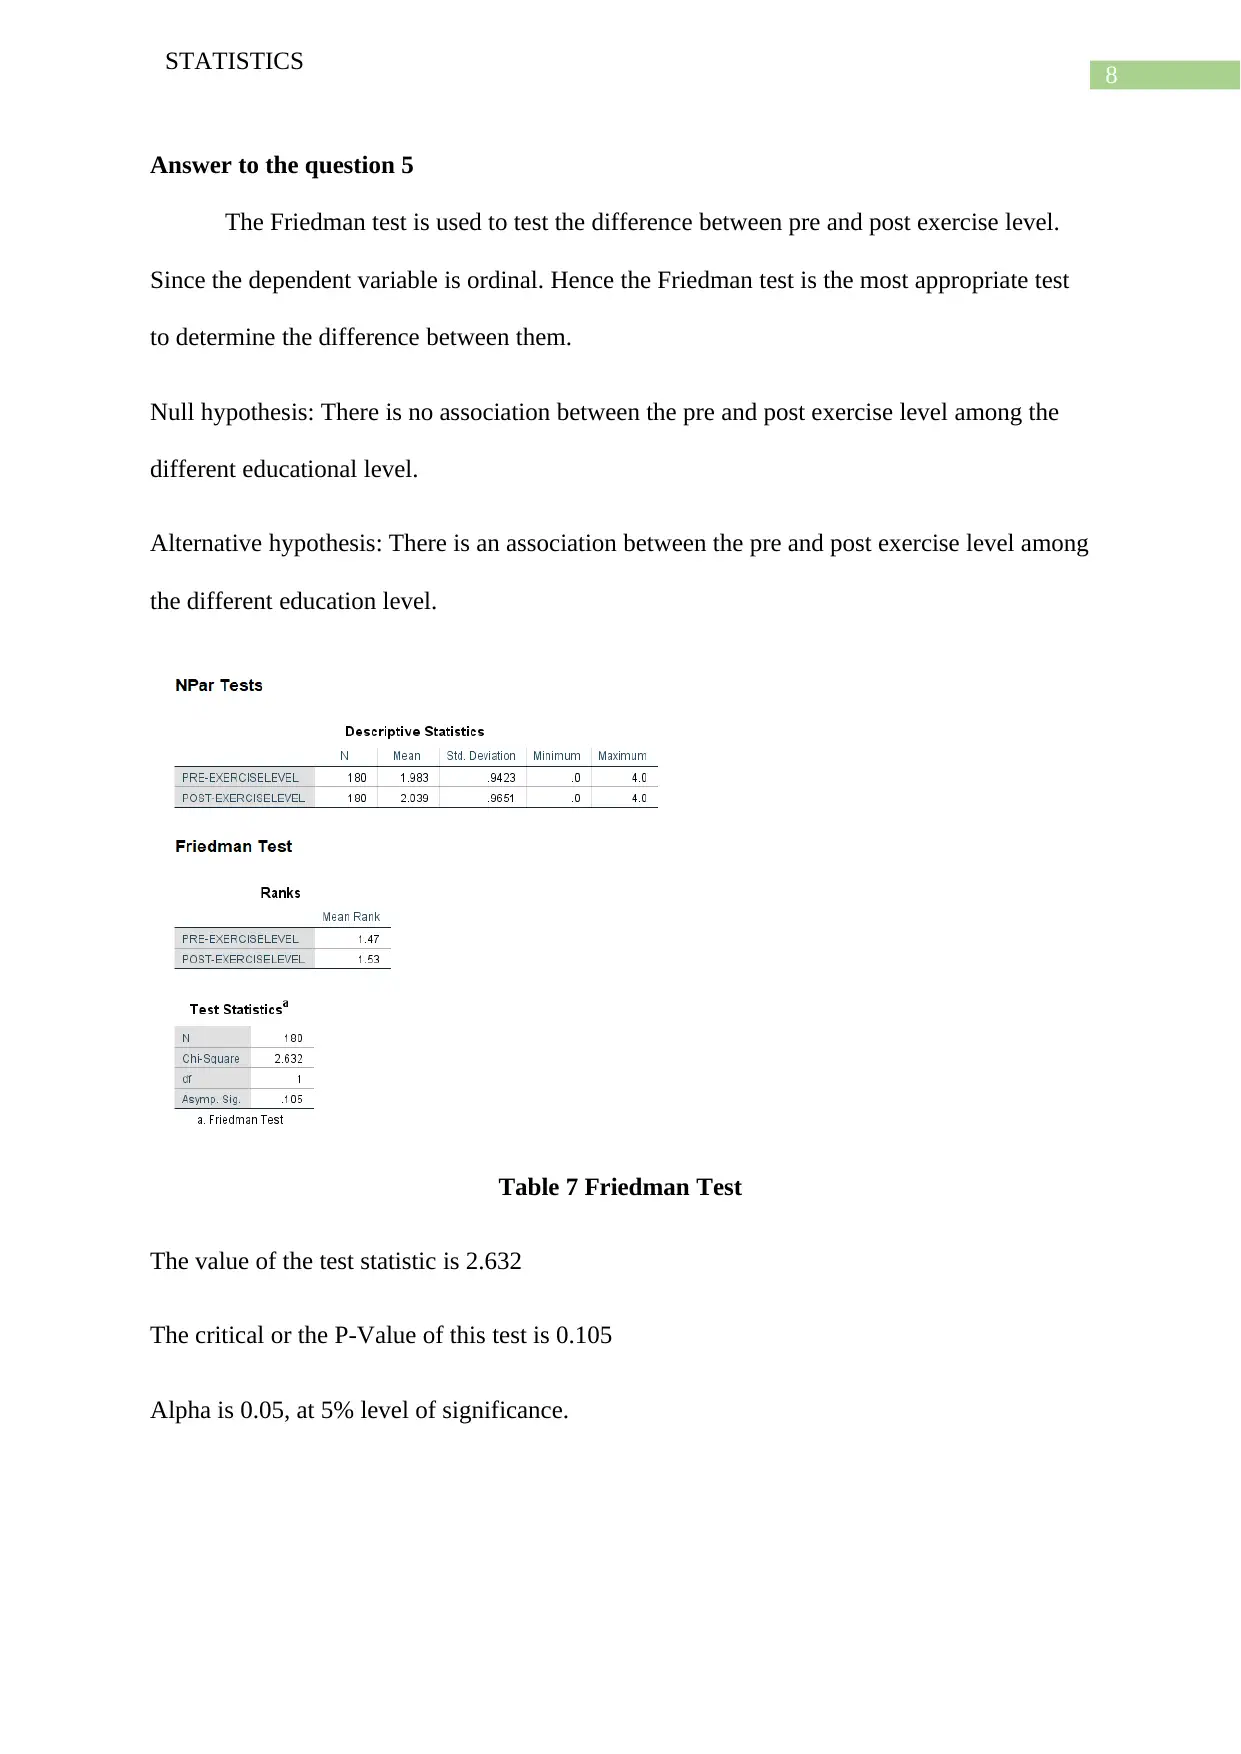
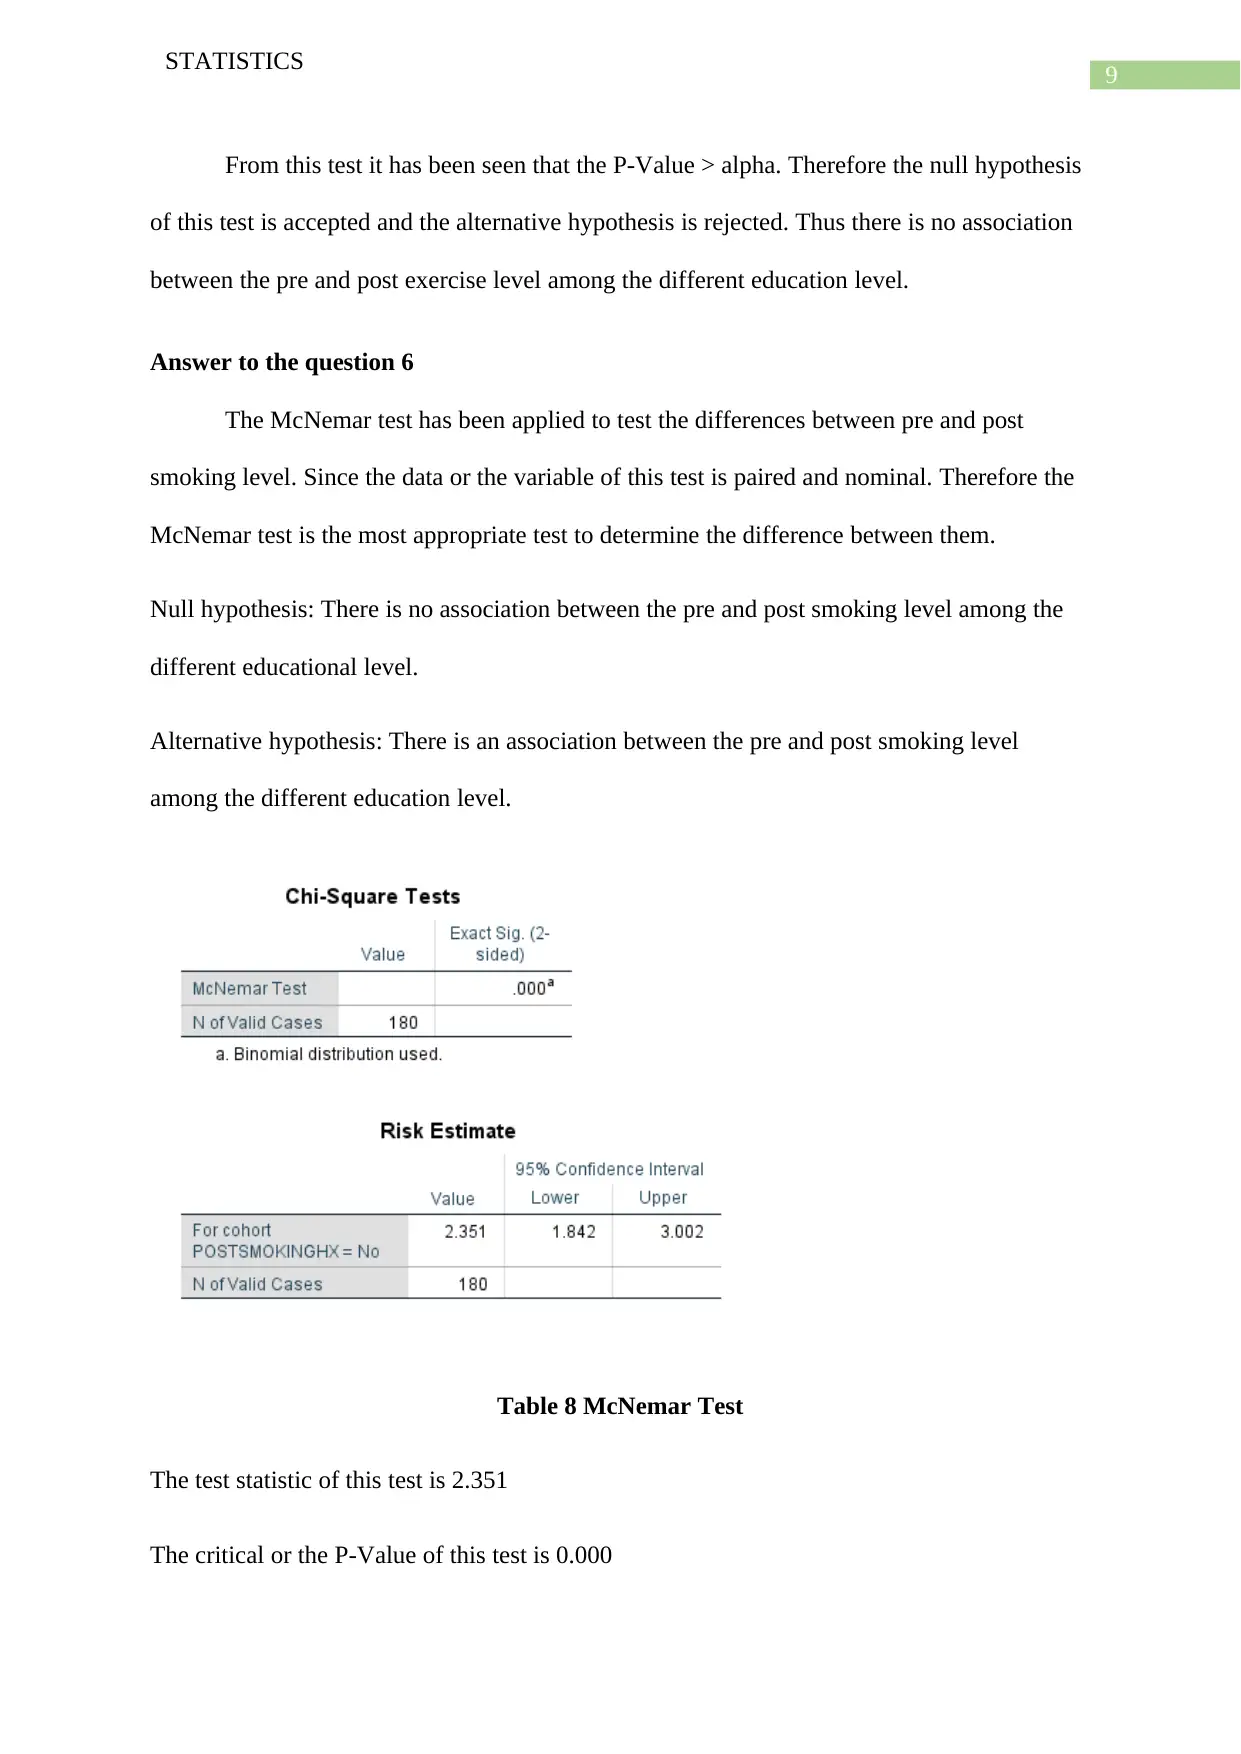
This assignment presents a statistical analysis of health data, addressing six research questions using various statistical tests. The analysis includes one-way ANOVA to compare Pre BMI across different education levels, MANOVA to examine the relationship between education level and multiple quantitative variables, and repeated measures ANOVA to assess the relationship between pre and post BMI. The Kruskal-Wallis test is used to compare pre-exercise levels, the Friedman test to assess differences in pre and post exercise levels, and the McNemar test to analyze pre and post smoking levels across different education levels. The results of each test, including test statistics, p-values, and conclusions, are presented with appropriate APA formatting. The assignment demonstrates the application of these statistical methods and the interpretation of their results.

Running head: STATISTICS
Statistics
Name of the Student:
Name of the University:
Author note:
Statistics
Name of the Student:
Name of the University:
Author note:
Paraphrase This Document
Need a fresh take? Get an instant paraphrase of this document with our AI Paraphraser

1
STATISTICS
Table of Contents
Answer to the question 1............................................................................................................2
Answer to the question 2............................................................................................................3
Answer to the question 3............................................................................................................5
Answer to the question 4............................................................................................................6
Answer to the question 5............................................................................................................8
Answer to the question 6............................................................................................................9
Bibliography.............................................................................................................................11

2
STATISTICS
Answer to the question 1
To test the differences between Pre BMI and education level the one way ANOVA
test is applied. In this problem there is one quantitative dependent variable and one
categorical nominal variable. Hence the one way ANOVA test has been applied. In this
problem Pre BMI is quantitative and education level is categorical variable.
Null hypothesis: There is no differences between the Pre BMI and different education level.
Alternative hypothesis: There is a differences between the Pre BMI and different education
level.
Table 1 ANOVA test output
Test statistic is 10.40
P- Value or critical value is 0.000
Alpha is 0.05, at 5% significance level.
It is clear from this test that the P-Value is lesser than the alpha (at 5%). Thus the null
hypothesis of this test is rejected and the alternative hypothesis is accepted. Therefore it may
be summarised that the there is a differences between the Pre BMI and different education
level.
⊘ This is a preview!⊘
Do you want full access?
Subscribe today to unlock all pages.

Trusted by 1+ million students worldwide

3
STATISTICS
It has been seen that the ANOVA test is significant therefore the post hoc test has
been conducted.
Table 2 Post Hoc Analysis
The Post hoc test clear that the P-Value is smaller than the alpha (at 5%). Thus the
null hypothesis of this test is rejected and at the same time the alternative hypothesis is
accepted. Hence it may be concluded that the there is a differences between the Pre BMI and
different education level.
Answer to the question 2
To test the difference between education level and weights, systolic blood pressure
and pulse one way MANOVA test has been applied. In this problem there are more than one
quantitative dependent variable and one categorical nominal variable. The categorical and
nominal variable is education level. The quantitative variables are weight, systolic blood
pressure and the pulse.
Null hypothesis: There is no differences between the weight, systolic blood pressure and the
pulse and different education level.
Paraphrase This Document
Need a fresh take? Get an instant paraphrase of this document with our AI Paraphraser

4
STATISTICS
Alternative hypothesis: There is a differences between the weight, systolic blood pressure and
the pulse and different education level.
Table 3 MANOVA test
The value of the test statistic is 2.778
The critical or P-Value of this test is 0.012
Alpha is 0.05, at 5% significance level.
It has been seen that the P-Value of this test is smaller the alpha (at 5%).Thus the null
hypothesis of the test is rejected and the alternative hypothesis is accepted. Therefore it can
be concluded that there is a relationship between the weight, systolic blood pressure and the
pulse and different education level.
It has been seen that the MANOVA test is significant, therefore the posthoc
test has been conducted.

5
STATISTICS
Table 4 Post Hoc Analysis
It has been seen that the critical value of this test is larger than the alpha. Therefore
the null hypothesis of this test accepted. Thus it can be concluded that there is no relationship
between the weight, systolic blood pressure and the pulse and different education level.
Answer to the question 3
To test the relationship between the pre and post BMI among the three different
education levels the repeated measures ANOVA has been used. The reason for selecting this
test is that because this test shows the means among the repeated measures of observations.
Null hypothesis: There is no relationship between the pre and post BMI among the three
different education.
Alternative hypothesis: There is a relationship between the pre and post BMI among the three
different education.
⊘ This is a preview!⊘
Do you want full access?
Subscribe today to unlock all pages.

Trusted by 1+ million students worldwide

6
STATISTICS
Table 4 Repeated measures ANOVA test
Test statistic is 3710.425
The P-value of this test is 0.000
Alpha is 0.05, at 5% level.
It has been that the P-Value < alpha. Therefore the null hypothesis of this test is
rejected. Hence it can be concluded that there is a relationship between the pre and post BMI
among the three different education.
Answer to the question 4
To test the differences between Pre exercise levels among the different education the
Kruskal – Wallis test is used. In this problem the samples are originate from same
distribution. So the Kruskal – Wallis test has been applied. Moreover this test compare two
or more independent variables with ordinal dependent variable.
Paraphrase This Document
Need a fresh take? Get an instant paraphrase of this document with our AI Paraphraser

7
STATISTICS
Null hypothesis: There is no differences between the Pre exercise level and different
education level.
Alternative hypothesis: There is a differences between the Pre exercise level and different
education level.
Table 5 Kruskal - Wallis test
The test statistic is15.036
The critical or the P-value of this test is 0.001
Alpha is 0.05, at 5% level of significance.
It has been seen that P-Value is smaller than the alpha. Thus null hypothesis of this
test is rejected and the alternative hypothesis is accepted. Therefore it may be concluded that
there is a differences between the Pre exercise levels among the different education level.

8
STATISTICS
Answer to the question 5
The Friedman test is used to test the difference between pre and post exercise level.
Since the dependent variable is ordinal. Hence the Friedman test is the most appropriate test
to determine the difference between them.
Null hypothesis: There is no association between the pre and post exercise level among the
different educational level.
Alternative hypothesis: There is an association between the pre and post exercise level among
the different education level.
Table 7 Friedman Test
The value of the test statistic is 2.632
The critical or the P-Value of this test is 0.105
Alpha is 0.05, at 5% level of significance.
⊘ This is a preview!⊘
Do you want full access?
Subscribe today to unlock all pages.

Trusted by 1+ million students worldwide

9
STATISTICS
From this test it has been seen that the P-Value > alpha. Therefore the null hypothesis
of this test is accepted and the alternative hypothesis is rejected. Thus there is no association
between the pre and post exercise level among the different education level.
Answer to the question 6
The McNemar test has been applied to test the differences between pre and post
smoking level. Since the data or the variable of this test is paired and nominal. Therefore the
McNemar test is the most appropriate test to determine the difference between them.
Null hypothesis: There is no association between the pre and post smoking level among the
different educational level.
Alternative hypothesis: There is an association between the pre and post smoking level
among the different education level.
Table 8 McNemar Test
The test statistic of this test is 2.351
The critical or the P-Value of this test is 0.000
Paraphrase This Document
Need a fresh take? Get an instant paraphrase of this document with our AI Paraphraser

10
STATISTICS
Alpha is 0.05, at 5% level of significance.
It has been seen that the P-Value of this test is smaller than the alpha. Therefore the
null hypothesis of this test is rejected and the alternative hypothesis is accepted. Hence it may
be concluded that there is an association between the pre and post smoking level among the
different education level.

11
STATISTICS
Bibliography
Acar, E. F., & Sun, L. (2013). A generalized Kruskal–Wallis test incorporating group
uncertainty with application to genetic association studies. Biometrics, 69(2), 427-
435.
Cramer, A. O., van Ravenzwaaij, D., Matzke, D., Steingroever, H., Wetzels, R., Grasman, R.
P., ... & Wagenmakers, E. J. (2016). Hidden multiplicity in exploratory multiway
ANOVA: Prevalence and remedies. Psychonomic bulletin & review, 23(2), 640-647.
Crowder, M. (2017). Analysis of repeated measures. Routledge.
Lachenbruch, P. A. (2014). McNemar test. Wiley StatsRef: Statistics Reference Online.
Oda, T., Liu, Y., Sakamoto, S., Elmazi, D., Barolli, L., & Xhafa Xhafa, F. (2015). Analysis of
mesh router placement in wireless mesh networks using Friedman test considering
different meta-heuristics. International journal of communication networks and
distributed systems, 15(1), 84-106.
Wakaki, H., Fujikoshi, Y., & Ulyanov, V. V. (2014). Asymptotic expansions of the
distributions of MANOVA test statistics when the dimension is large. Hiroshima
Mathematical Journal, 44(3), 247-259.
⊘ This is a preview!⊘
Do you want full access?
Subscribe today to unlock all pages.

Trusted by 1+ million students worldwide
1 out of 12
Related Documents

Your All-in-One AI-Powered Toolkit for Academic Success.
+13062052269
info@desklib.com
Available 24*7 on WhatsApp / Email
Unlock your academic potential
Copyright © 2020–2025 A2Z Services. All Rights Reserved. Developed and managed by ZUCOL.