Statistical Analysis to Support Decision Making - Report
VerifiedAdded on 2020/07/23
|13
|1278
|40
Report
AI Summary
This report provides a comprehensive statistical analysis to support decision-making, incorporating various statistical methods and concepts. The report begins with an analysis of operational delays, identifying areas for improvement and recommending process reengineering. It then delves into probability under standard normal distribution, calculating the probability of underweight packets and determining the target level for a specific percentage of underweight samples. Furthermore, the report explores the identification of relevant relationships, stratified random sampling, and a one-way ANOVA to measure mean differences. It presents descriptive statistics, calculates confidence intervals at different levels, and compares 70% and 85% cocoa products using t-tests. Finally, it assesses the significance of mean differences between variables, offering insights for informed decision-making.
STATISTICAL ANALYSIS TO
SUPPORT DECISION MAKING
SUPPORT DECISION MAKING
Paraphrase This Document
Need a fresh take? Get an instant paraphrase of this document with our AI Paraphraser
TABLE OF CONTENTS
(1).....................................................................................................................................................1
2.......................................................................................................................................................2
(a).................................................................................................................................................2
3.......................................................................................................................................................3
(a).................................................................................................................................................3
(b).................................................................................................................................................3
©..................................................................................................................................................3
4.......................................................................................................................................................4
(a).................................................................................................................................................4
(b).................................................................................................................................................5
(c).................................................................................................................................................5
(d).................................................................................................................................................6
(e).................................................................................................................................................6
5.......................................................................................................................................................7
(a).................................................................................................................................................7
(b).................................................................................................................................................7
©..................................................................................................................................................8
6.......................................................................................................................................................8
Table 1Descriptive statistics............................................................................................................5
Table 2Population upper and lower confidence interval.................................................................7
Figure 1Extra time taken to perform operations..............................................................................1
Figure 2Time taken to perform operations......................................................................................1
Figure 3Normal distribution chart...................................................................................................2
Figure 4Normal distribution chart...................................................................................................3
Figure 5T test table..........................................................................................................................4
Figure 6Classification of milk and dark choclates across gender....................................................4
Figure 7Calculation of CI at 99% level...........................................................................................6
Figure 8Computation of confidence interval at 99% CI..................................................................6
Figure 9 70% cocoa and 85% cocoa................................................................................................7
Figure 10Computation of t test........................................................................................................8
Figure 11Application to check whether population mean differ by value more then 2g................9
⊘ This is a preview!⊘
Do you want full access?
Subscribe today to unlock all pages.
Trusted by 1+ million students worldwide
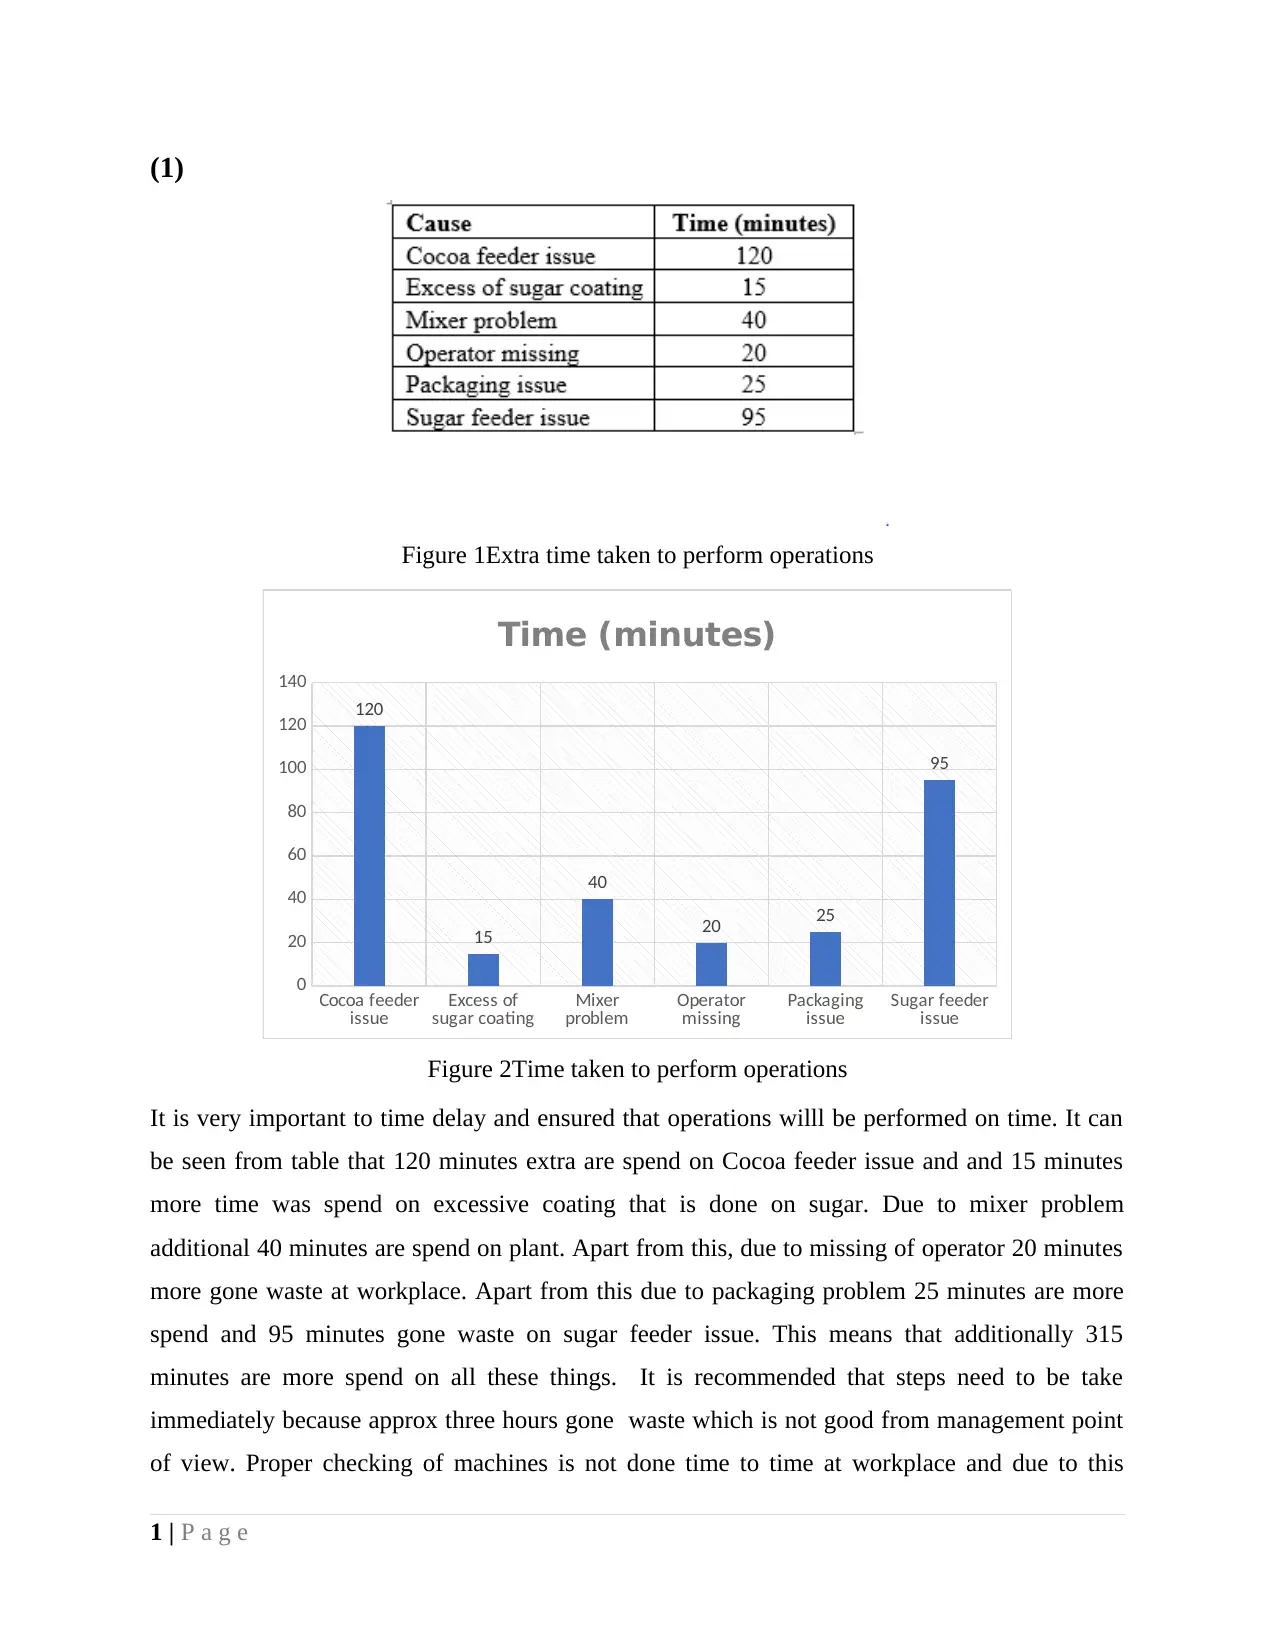
(1)
Figure 1Extra time taken to perform operations
Cocoa feeder
issue Excess of
sugar coating Mixer
problem Operator
missing Packaging
issue Sugar feeder
issue
0
20
40
60
80
100
120
140
120
15
40
20 25
95
Time (minutes)
Figure 2Time taken to perform operations
It is very important to time delay and ensured that operations willl be performed on time. It can
be seen from table that 120 minutes extra are spend on Cocoa feeder issue and and 15 minutes
more time was spend on excessive coating that is done on sugar. Due to mixer problem
additional 40 minutes are spend on plant. Apart from this, due to missing of operator 20 minutes
more gone waste at workplace. Apart from this due to packaging problem 25 minutes are more
spend and 95 minutes gone waste on sugar feeder issue. This means that additionally 315
minutes are more spend on all these things. It is recommended that steps need to be take
immediately because approx three hours gone waste which is not good from management point
of view. Proper checking of machines is not done time to time at workplace and due to this
1 | P a g e
Paraphrase This Document
Need a fresh take? Get an instant paraphrase of this document with our AI Paraphraser
reason such kind of problems occurred suddenly in the business. Hence, proper checking of
machines must be done and process reengneiring approaches must be used at workplace to
ensure that wastful activities will be eliminated from production process.
2
(a)
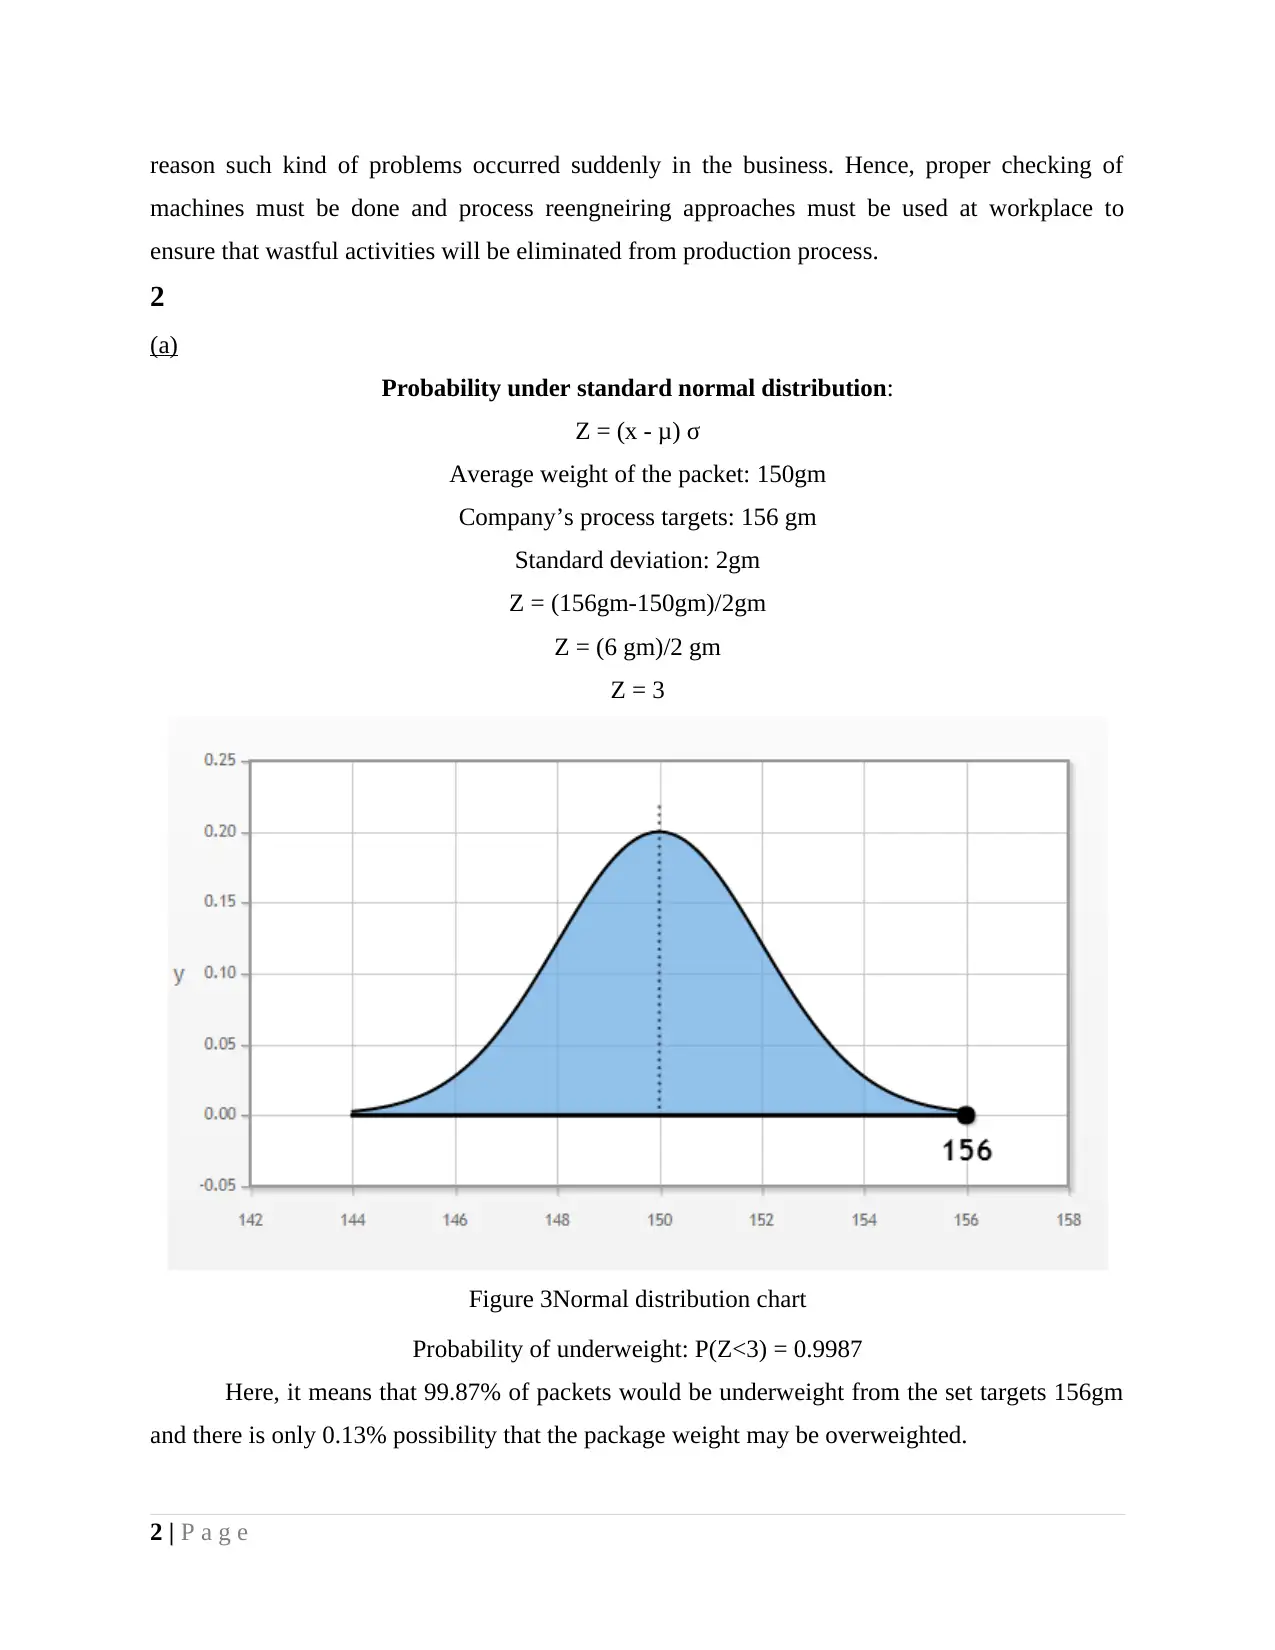
Probability under standard normal distribution:
Z = (x - μ) σ
Average weight of the packet: 150gm
Company’s process targets: 156 gm
Standard deviation: 2gm
Z = (156gm-150gm)/2gm
Z = (6 gm)/2 gm
Z = 3
Figure 3Normal distribution chart
Probability of underweight: P(Z<3) = 0.9987
Here, it means that 99.87% of packets would be underweight from the set targets 156gm
and there is only 0.13% possibility that the package weight may be overweighted.
2 | P a g e
machines must be done and process reengneiring approaches must be used at workplace to
ensure that wastful activities will be eliminated from production process.
2
(a)
Probability under standard normal distribution:
Z = (x - μ) σ
Average weight of the packet: 150gm
Company’s process targets: 156 gm
Standard deviation: 2gm
Z = (156gm-150gm)/2gm
Z = (6 gm)/2 gm
Z = 3
Figure 3Normal distribution chart
Probability of underweight: P(Z<3) = 0.9987
Here, it means that 99.87% of packets would be underweight from the set targets 156gm
and there is only 0.13% possibility that the package weight may be overweighted.
2 | P a g e
(b)
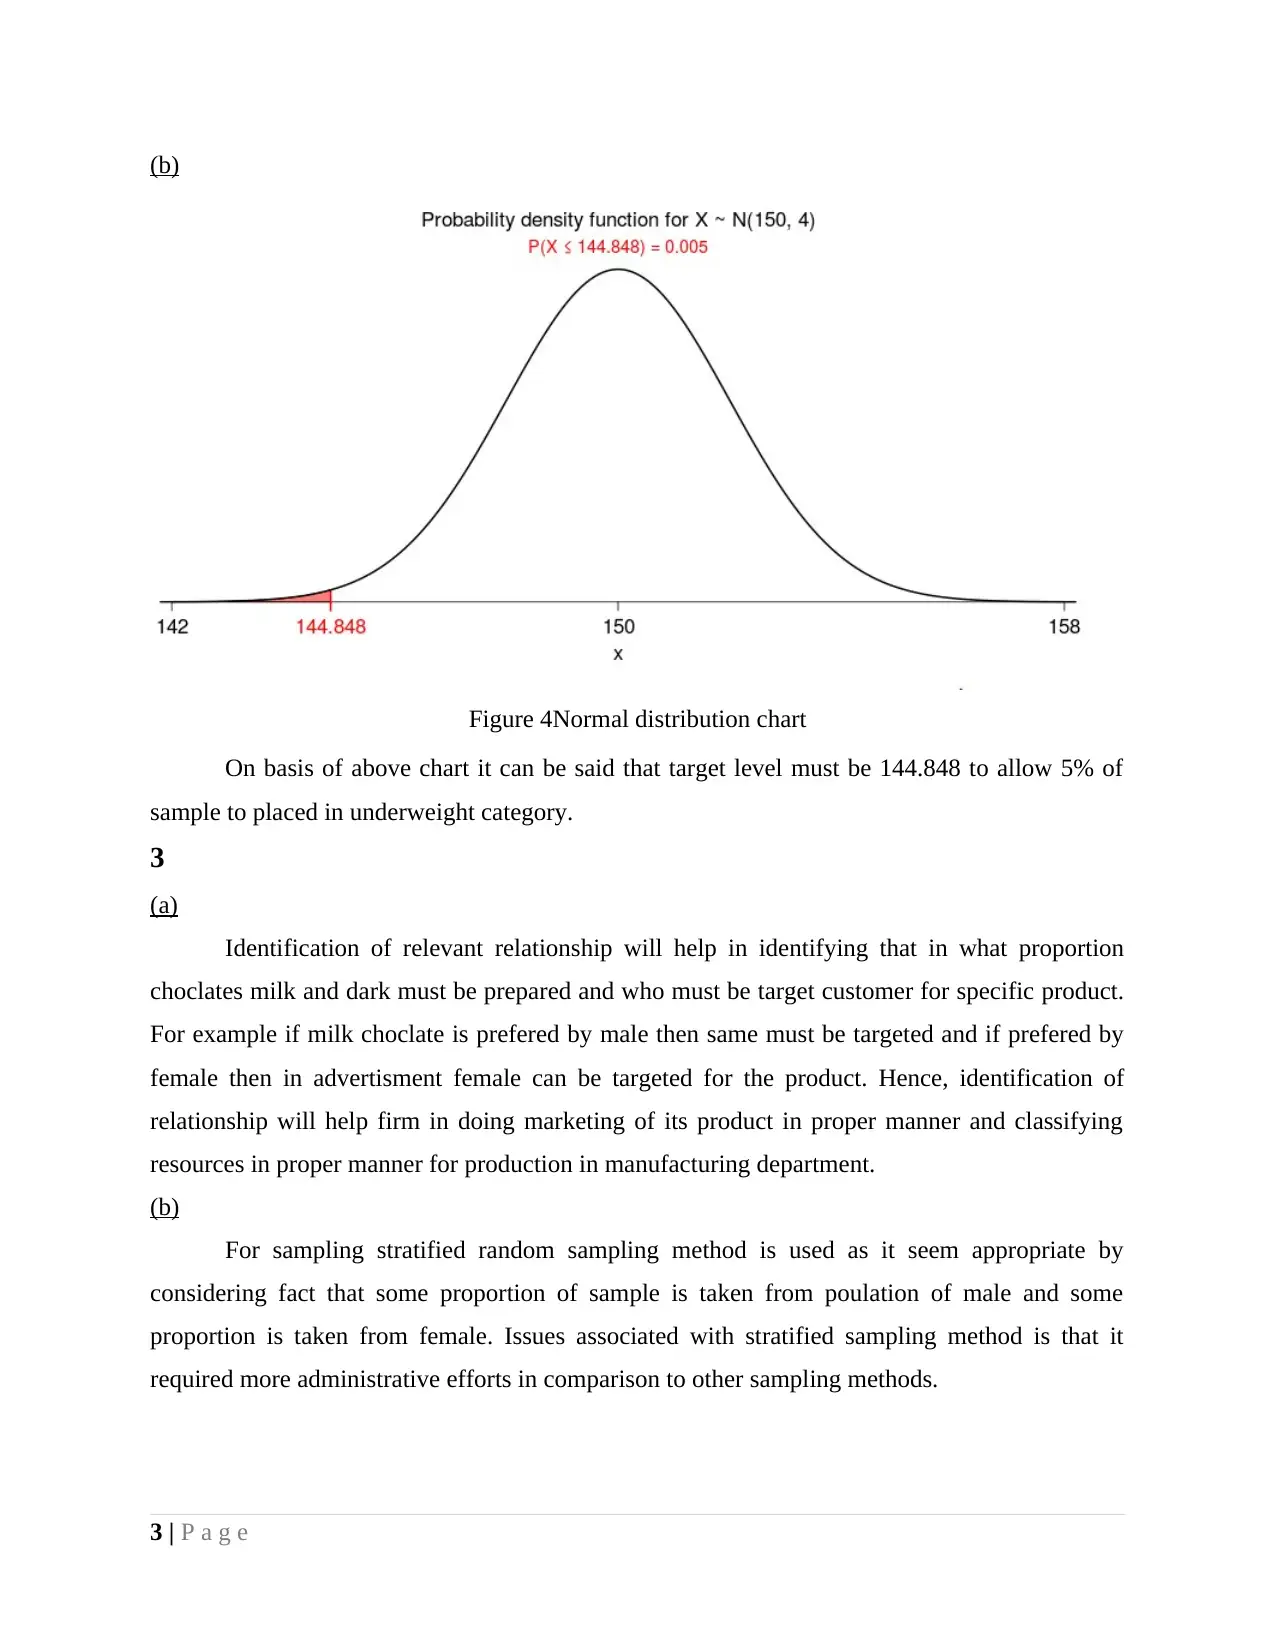
Figure 4Normal distribution chart
On basis of above chart it can be said that target level must be 144.848 to allow 5% of
sample to placed in underweight category.
3
(a)
Identification of relevant relationship will help in identifying that in what proportion
choclates milk and dark must be prepared and who must be target customer for specific product.
For example if milk choclate is prefered by male then same must be targeted and if prefered by
female then in advertisment female can be targeted for the product. Hence, identification of
relationship will help firm in doing marketing of its product in proper manner and classifying
resources in proper manner for production in manufacturing department.
(b)
For sampling stratified random sampling method is used as it seem appropriate by
considering fact that some proportion of sample is taken from poulation of male and some
proportion is taken from female. Issues associated with stratified sampling method is that it
required more administrative efforts in comparison to other sampling methods.
3 | P a g e
⊘ This is a preview!⊘
Do you want full access?
Subscribe today to unlock all pages.
Trusted by 1+ million students worldwide
©
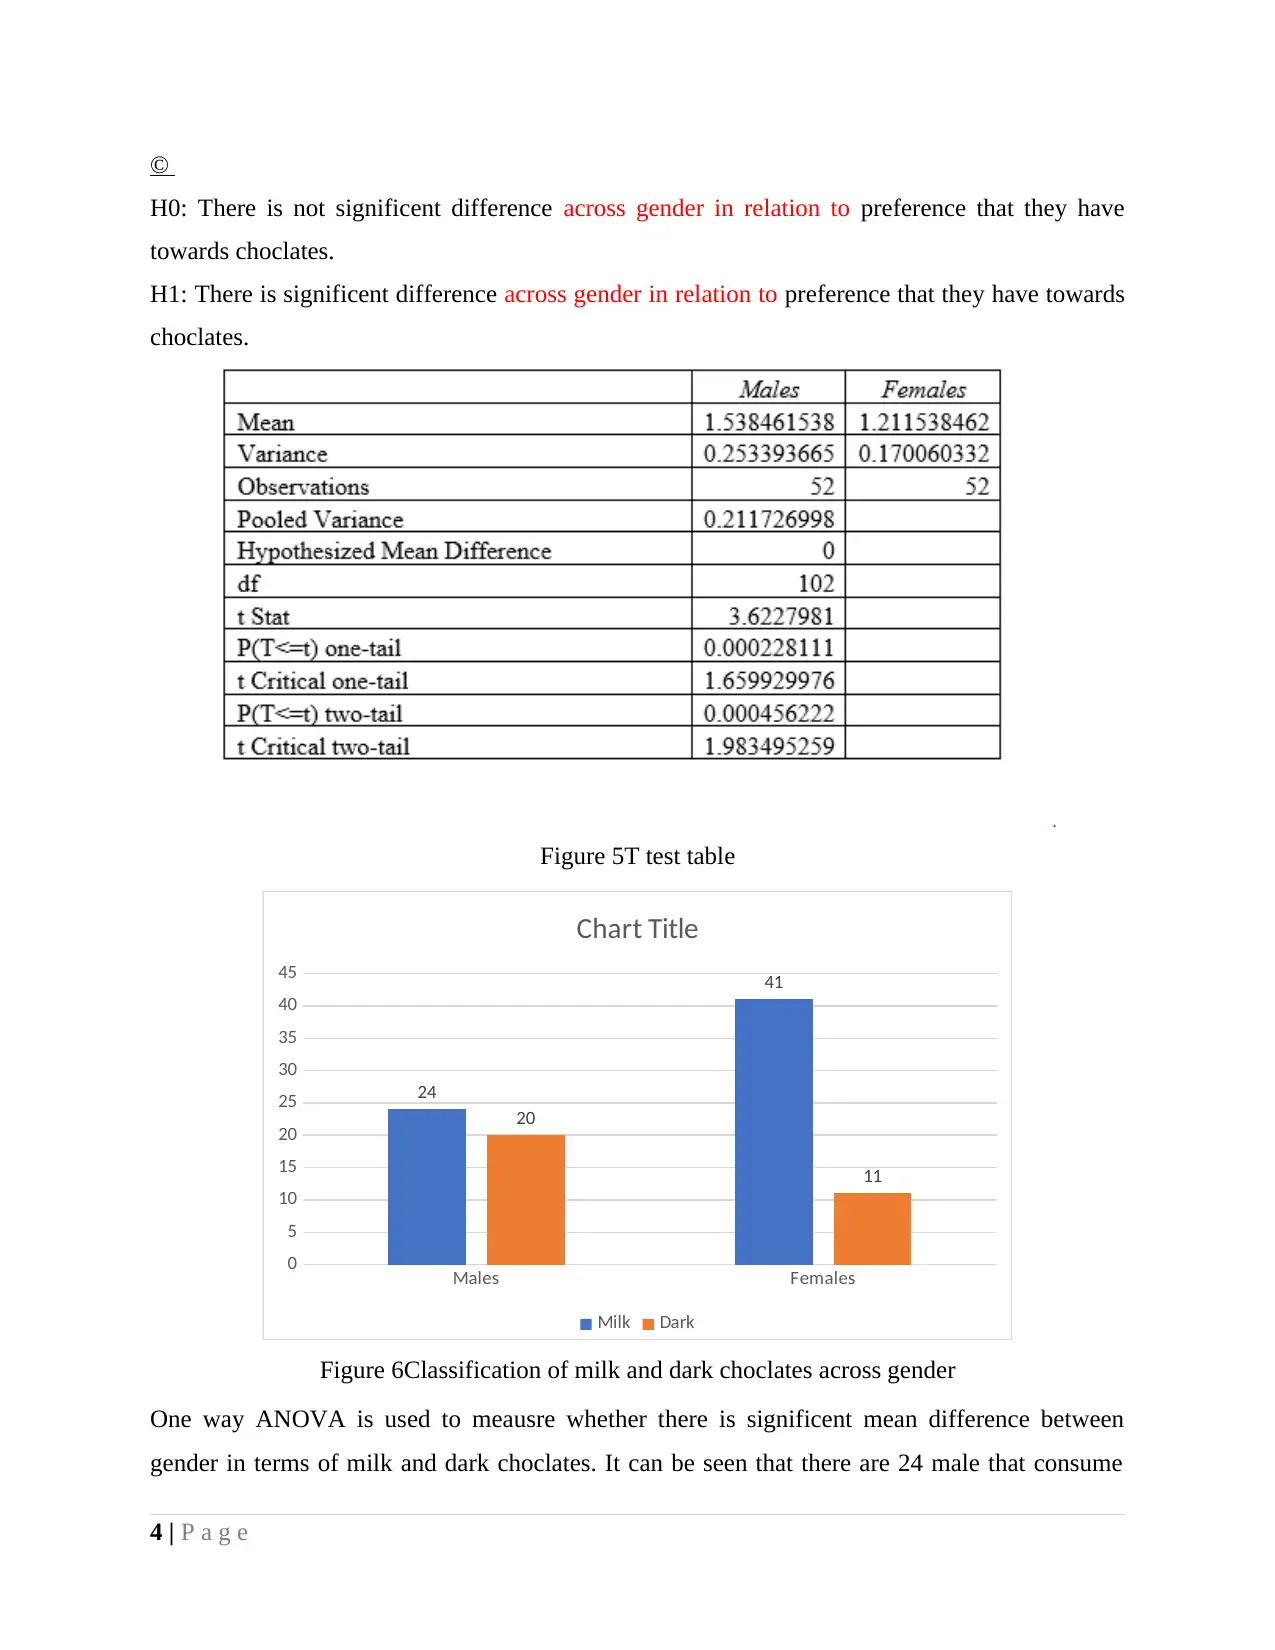
H0: There is not significent difference across gender in relation to preference that they have
towards choclates.
H1: There is significent difference across gender in relation to preference that they have towards
choclates.
Figure 5T test table
Males Females
0
5
10
15
20
25
30
35
40
45
24
41
20
11
Chart Title
Milk Dark
Figure 6Classification of milk and dark choclates across gender
One way ANOVA is used to meausre whether there is significent mean difference between
gender in terms of milk and dark choclates. It can be seen that there are 24 male that consume
4 | P a g e
Paraphrase This Document
Need a fresh take? Get an instant paraphrase of this document with our AI Paraphraser
milk choclates. There are 20 male that consume dark choclates. Apart from this, there are 41
females that consume milk choclates and 11 consume dark choclates. Significence number is less
alpha value and this means that significent difference is not present among both variables.
4
(a)
146
148
150
152
154
156
158
160
162
Series1;
153.67
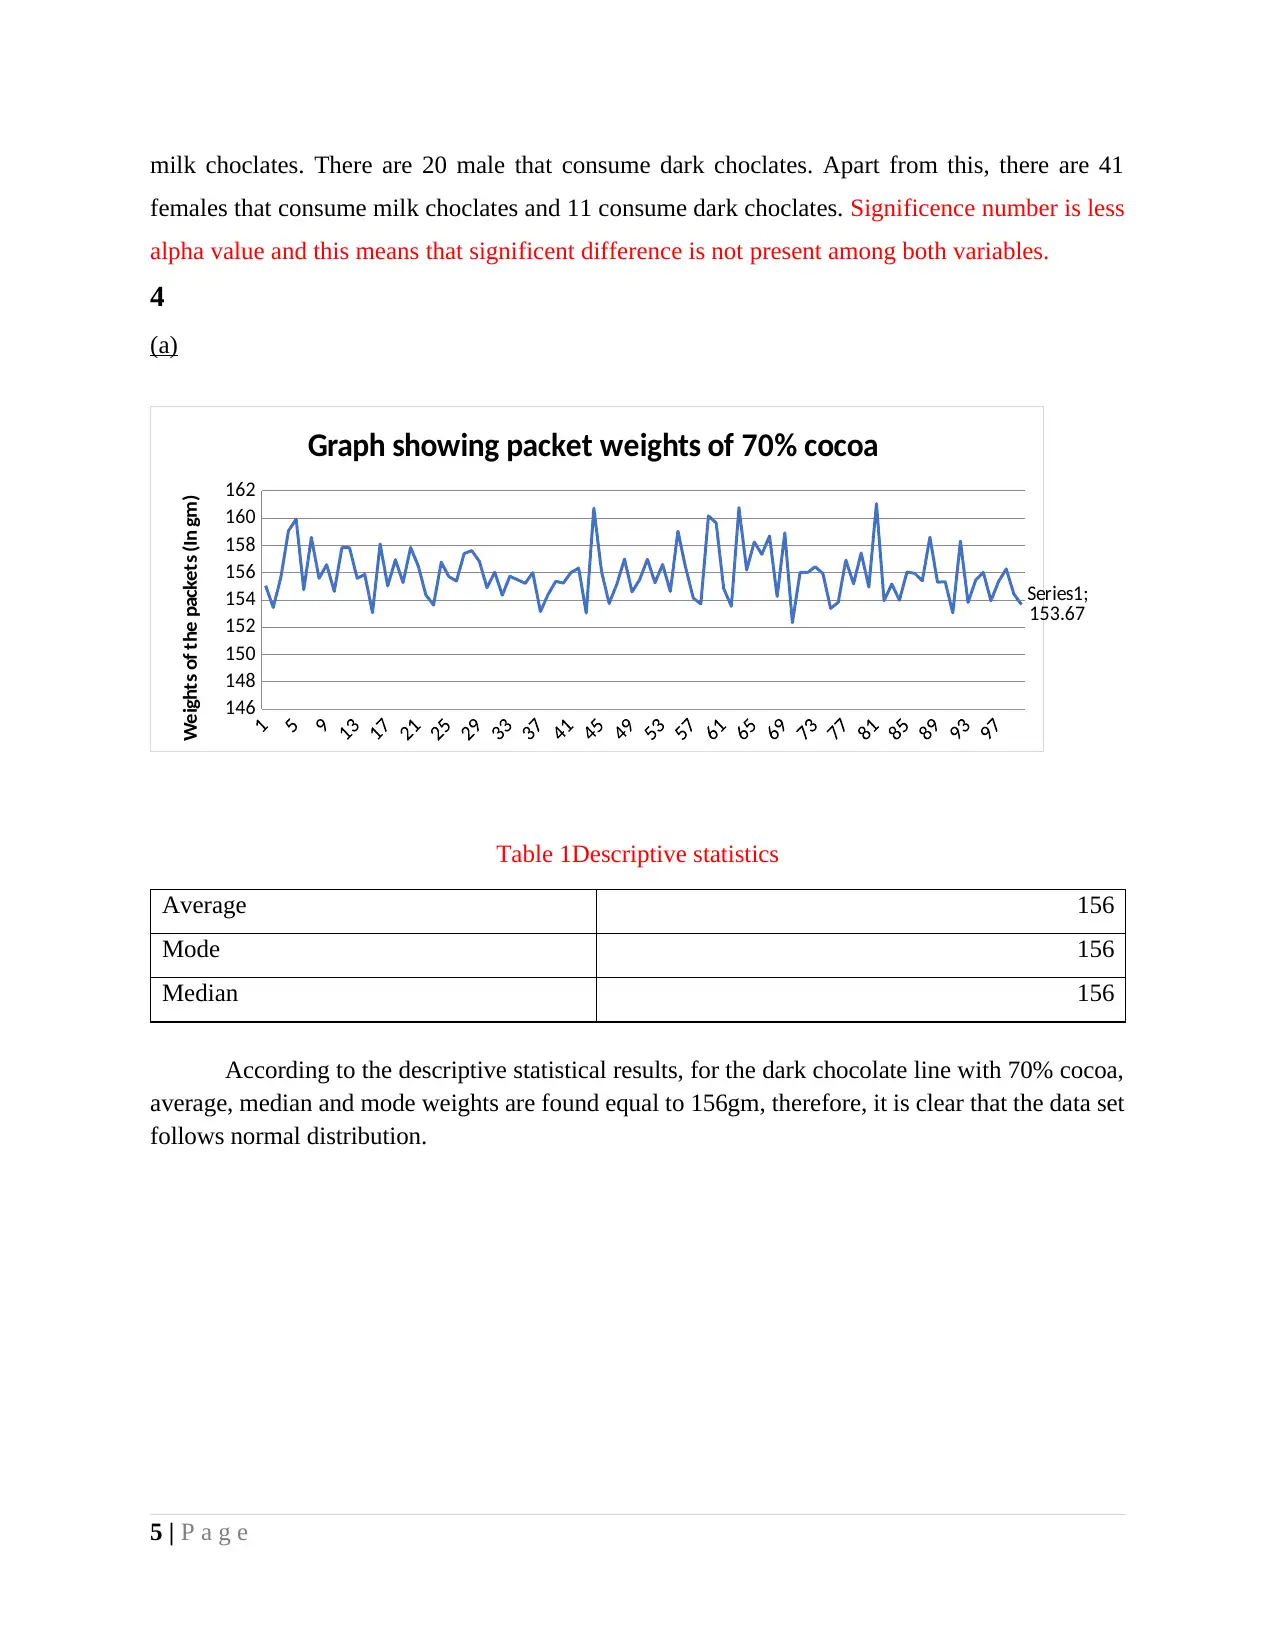
Graph showing packet weights of 70% cocoa
Weights of the packets (In gm)
Table 1Descriptive statistics
Average 156
Mode 156
Median 156
According to the descriptive statistical results, for the dark chocolate line with 70% cocoa,
average, median and mode weights are found equal to 156gm, therefore, it is clear that the data set
follows normal distribution.
5 | P a g e
females that consume milk choclates and 11 consume dark choclates. Significence number is less
alpha value and this means that significent difference is not present among both variables.
4
(a)
146
148
150
152
154
156
158
160
162
Series1;
153.67
Graph showing packet weights of 70% cocoa
Weights of the packets (In gm)
Table 1Descriptive statistics
Average 156
Mode 156
Median 156
According to the descriptive statistical results, for the dark chocolate line with 70% cocoa,
average, median and mode weights are found equal to 156gm, therefore, it is clear that the data set
follows normal distribution.
5 | P a g e
(b)
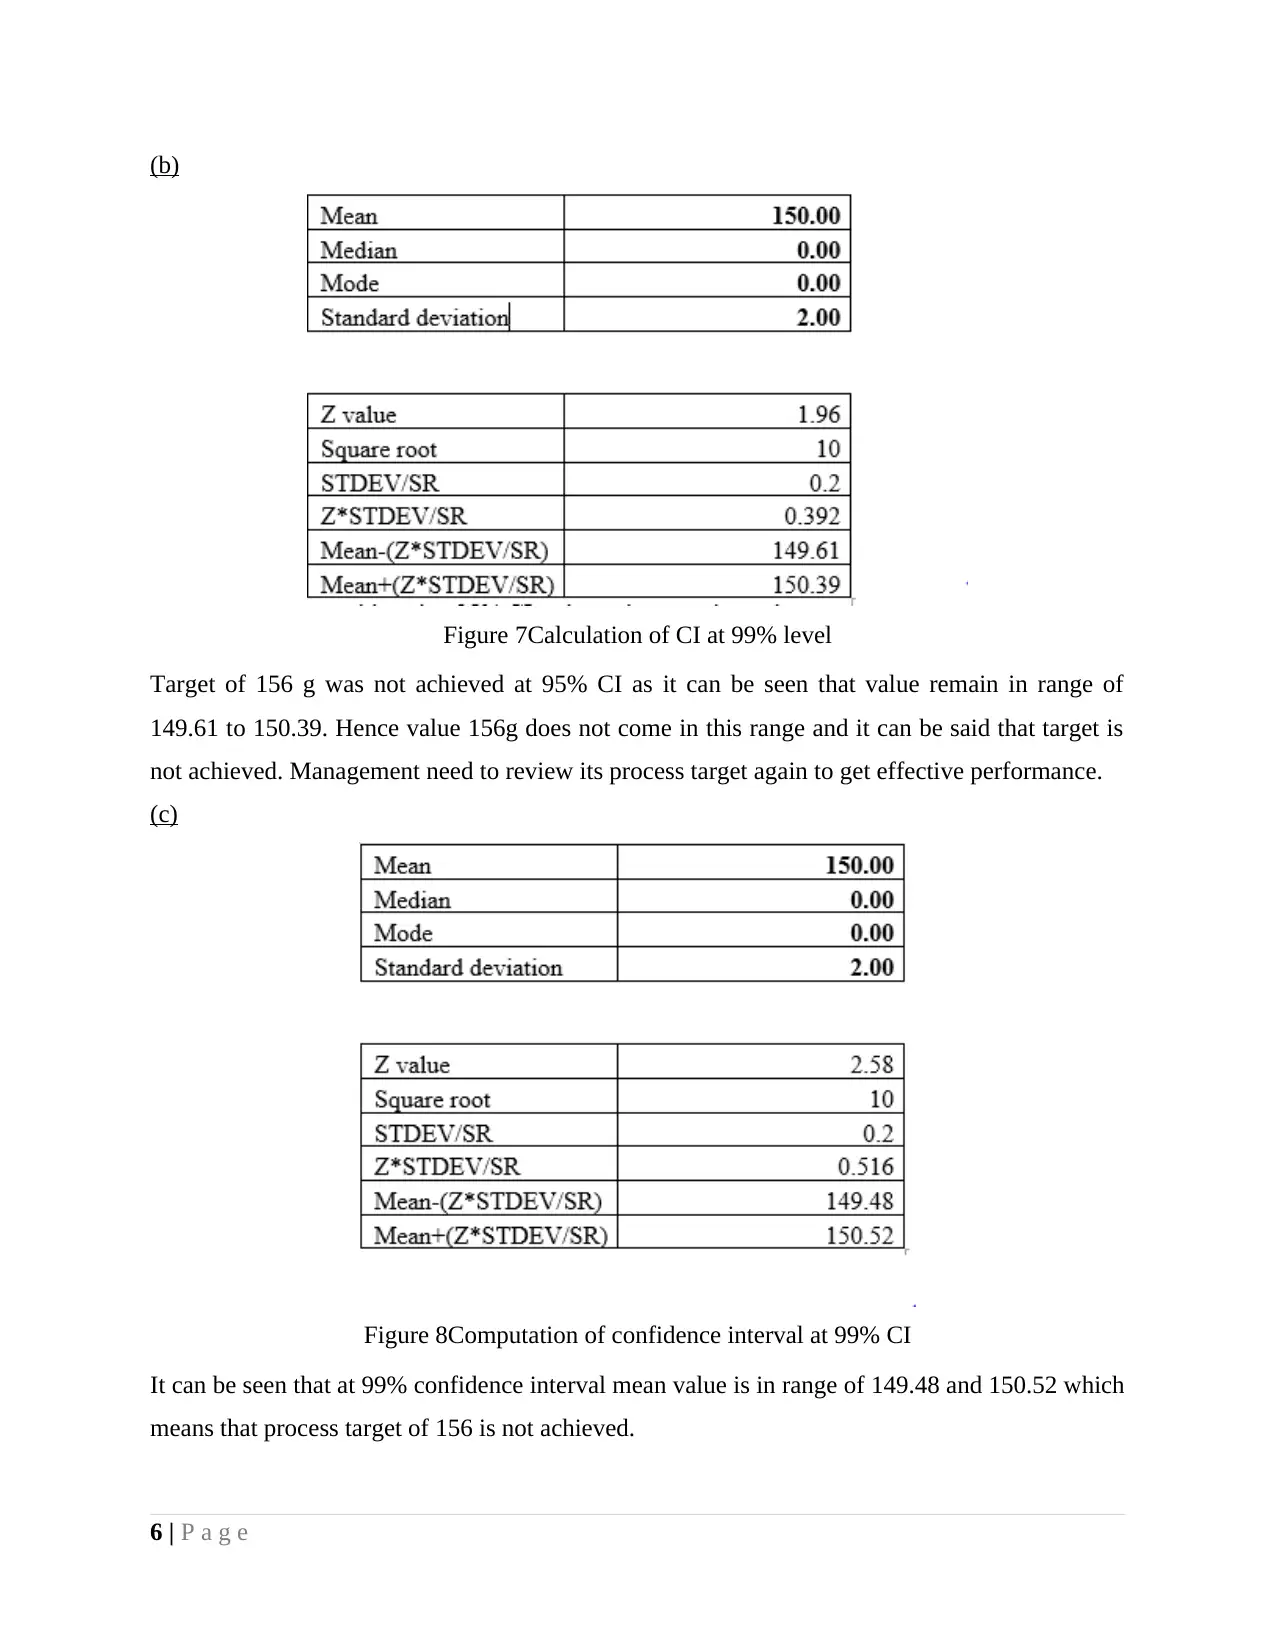
Figure 7Calculation of CI at 99% level
Target of 156 g was not achieved at 95% CI as it can be seen that value remain in range of
149.61 to 150.39. Hence value 156g does not come in this range and it can be said that target is
not achieved. Management need to review its process target again to get effective performance.
(c)
Figure 8Computation of confidence interval at 99% CI
It can be seen that at 99% confidence interval mean value is in range of 149.48 and 150.52 which
means that process target of 156 is not achieved.
6 | P a g e
⊘ This is a preview!⊘
Do you want full access?
Subscribe today to unlock all pages.
Trusted by 1+ million students worldwide

(d)
Table 2Population upper and lower confidence interval
Population CI
Sample 100
DF 99
Sample mean 150.00
t value 2.581
Sample/SQRT 0.2
T
Value*Sample/SQRT 0.5162
Lower interval 149.48
Upper interval 152.58
Upper and lower confidence interval value is 149.48 and 152.58. Means that if one is 99%
confident that in future also current mean value willl occur then values of variable will lie in
range of 149.48 and 152.58.
(e)
Results of C and D are related as it can be observed that both quesitons are related to
population and confidence interval is almost same and variable is also similar population mean.
7 | P a g e
Paraphrase This Document
Need a fresh take? Get an instant paraphrase of this document with our AI Paraphraser
5
(a)
1
5
9
13
17
21
25
29
33
37
41
45
49
53
57
61
65
69
73
77
81
85
89
93
97
140
145
150
155
160
165
Chart Title
70% cocoa 85% cocoa
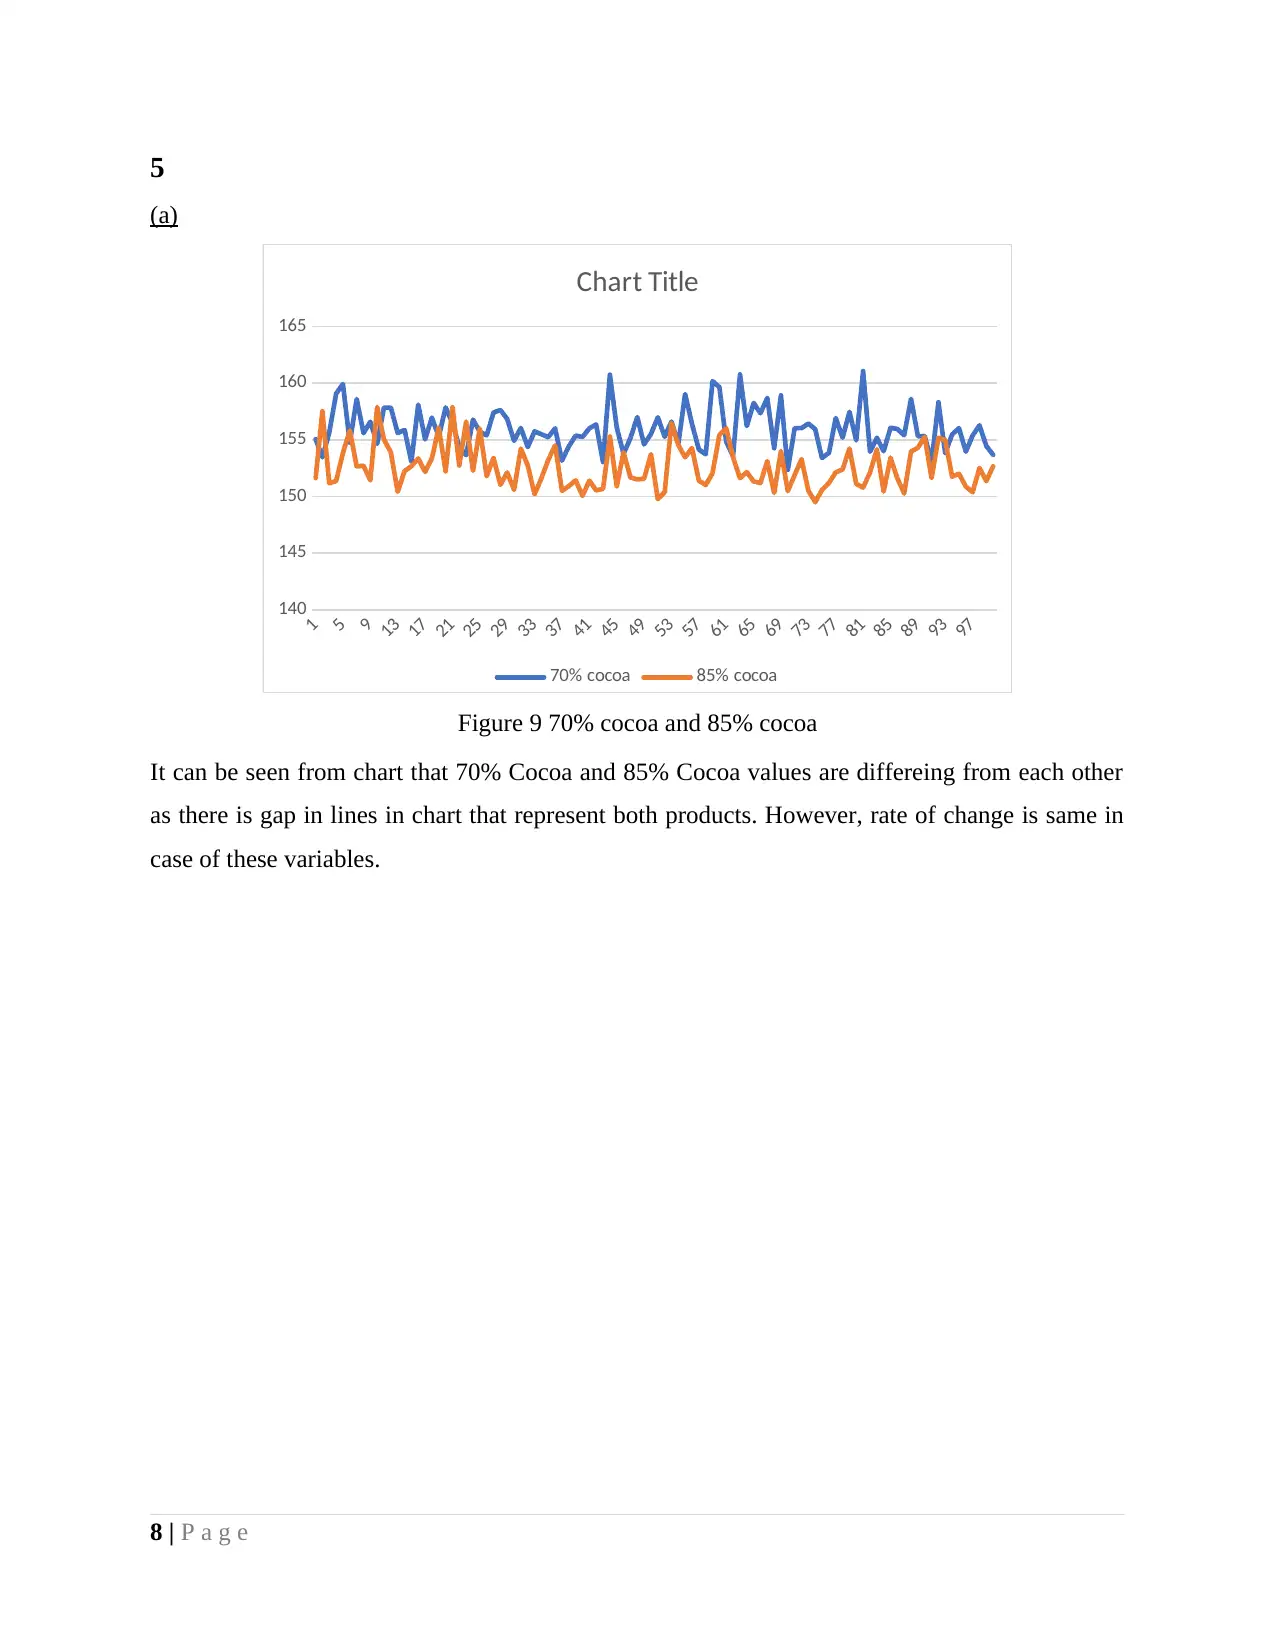
Figure 9 70% cocoa and 85% cocoa
It can be seen from chart that 70% Cocoa and 85% Cocoa values are differeing from each other
as there is gap in lines in chart that represent both products. However, rate of change is same in
case of these variables.
8 | P a g e
(a)
1
5
9
13
17
21
25
29
33
37
41
45
49
53
57
61
65
69
73
77
81
85
89
93
97
140
145
150
155
160
165
Chart Title
70% cocoa 85% cocoa
Figure 9 70% cocoa and 85% cocoa
It can be seen from chart that 70% Cocoa and 85% Cocoa values are differeing from each other
as there is gap in lines in chart that represent both products. However, rate of change is same in
case of these variables.
8 | P a g e
(b)
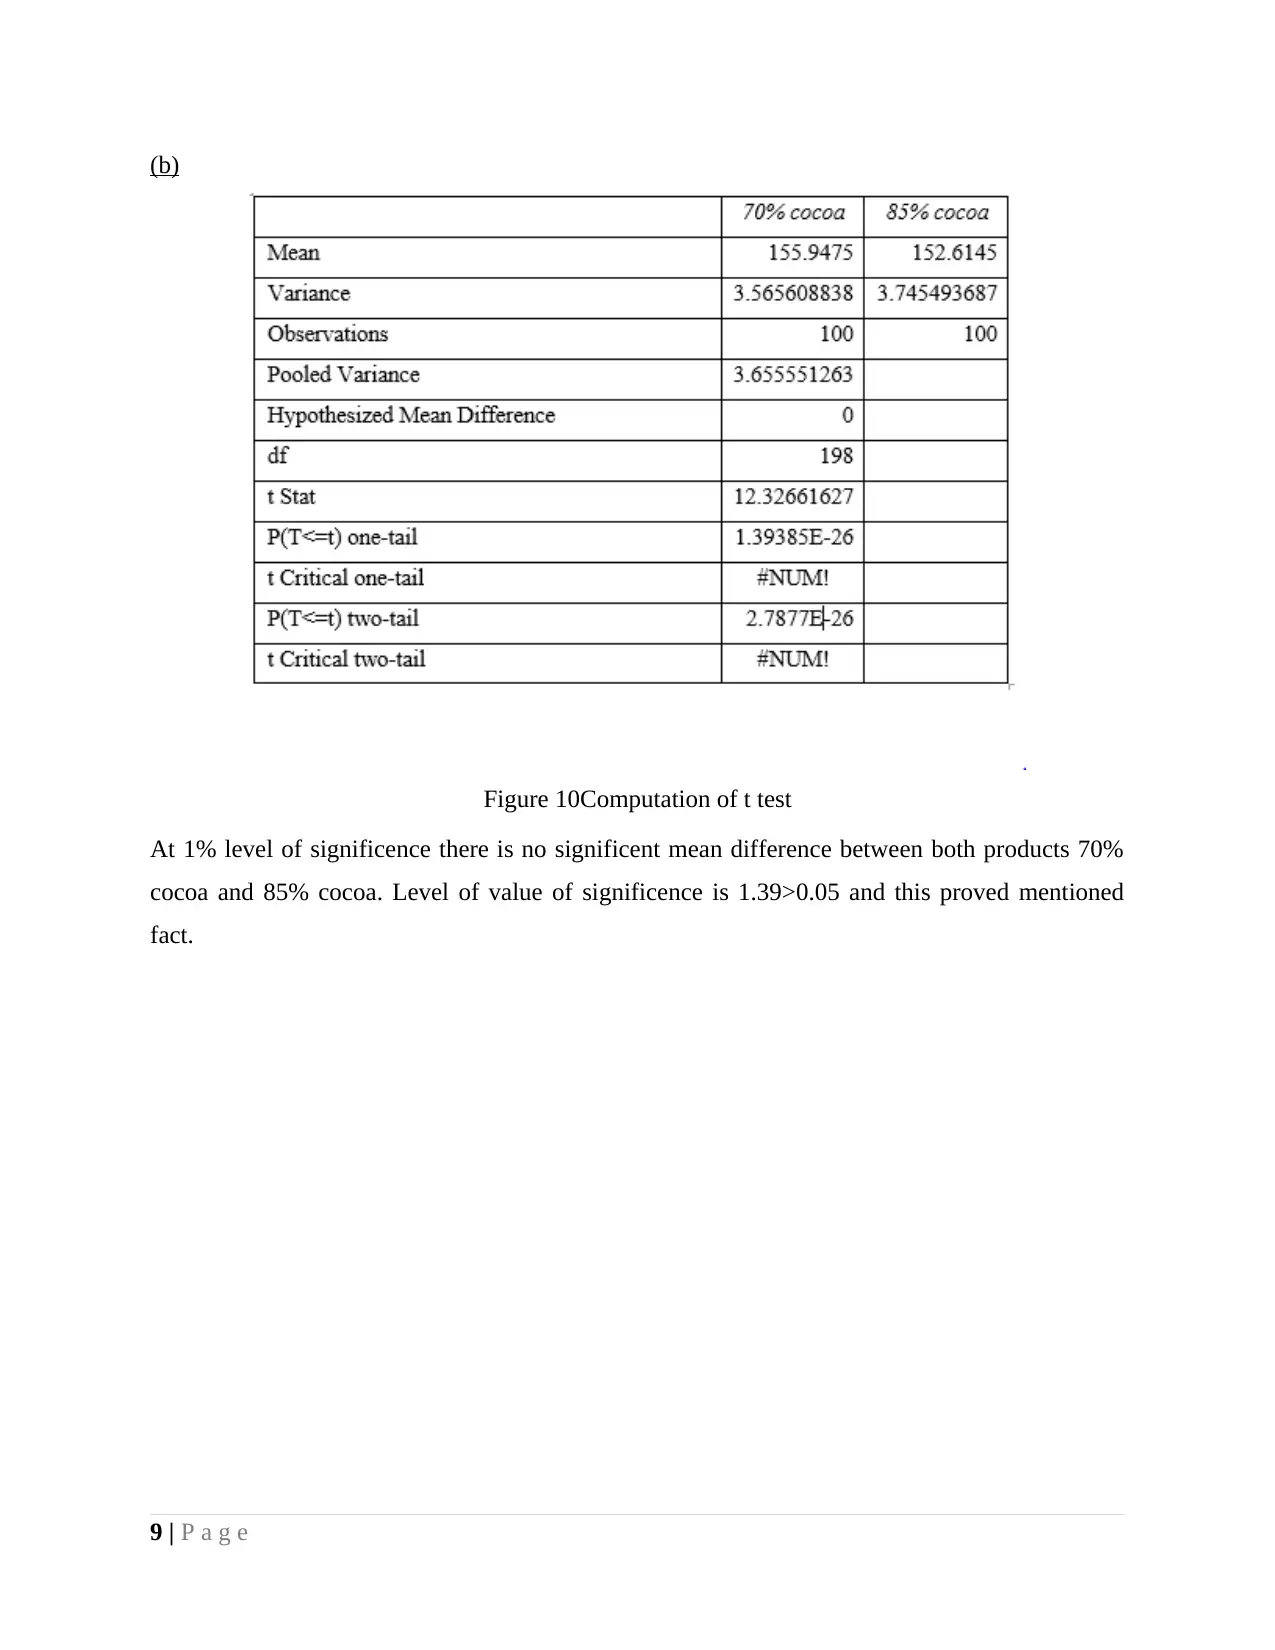
Figure 10Computation of t test
At 1% level of significence there is no significent mean difference between both products 70%
cocoa and 85% cocoa. Level of value of significence is 1.39>0.05 and this proved mentioned
fact.
9 | P a g e
Figure 10Computation of t test
At 1% level of significence there is no significent mean difference between both products 70%
cocoa and 85% cocoa. Level of value of significence is 1.39>0.05 and this proved mentioned
fact.
9 | P a g e
⊘ This is a preview!⊘
Do you want full access?
Subscribe today to unlock all pages.
Trusted by 1+ million students worldwide
1 out of 13
Your All-in-One AI-Powered Toolkit for Academic Success.
+13062052269
info@desklib.com
Available 24*7 on WhatsApp / Email
![[object Object]](/_next/static/media/star-bottom.7253800d.svg)
Unlock your academic potential
Copyright © 2020–2026 A2Z Services. All Rights Reserved. Developed and managed by ZUCOL.