Research and Statistical Methods Assignment: Employee Satisfaction
VerifiedAdded on 2022/10/07
|8
|2380
|17
Homework Assignment
AI Summary
This assignment analyzes a research study on employee satisfaction within Belgian banks. The student addresses key research processes, including sampling techniques, sample size justification, and the application of simple random sampling. The analysis evaluates the reliability and validity of the study's measures, considering Cronbach's alpha and potential biases. The student also discusses the role of control variables like age and gender in influencing the relationship between employee satisfaction and job security. Finally, the assignment identifies and discusses the advantages and disadvantages of the correlational research design employed in the study. The assignment uses relevant research to support the analysis of the study's methodology and findings.
RESEARCH AND STATISTICAL METHOD
STUDENT ID:
[Pick the date]
STUDENT ID:
[Pick the date]
Paraphrase This Document
Need a fresh take? Get an instant paraphrase of this document with our AI Paraphraser
Question 1
A key process in research is sampling which is used to obtain a sample which can be used as
a proxy for the population of interest and thereby can be used to study the same. In sampling,
the researcher needs to decide on the requisite sample size. The decision is not straight
forward as a trade off exists with regards to estimate accuracy and the underlying resources
that can be deployed for the sampling process. Typically, standard error and sample size
share a inverse relationship which implies that a larger sample would make it more likely that
the underlying sample selected represents the population of interest faithfully. The problem
with taking a bigger sample is that greater resources in terms of finances and manpower will
be required to enable the same. The resources and manpower available for research is often
limited and hence prudence must be exhibited by the researcher in utilising the same (Flick,
2015).
In order to outline the requisite sample size, it makes sense to consider two pivotal aspects.
One of these is the dispersion in the target population. If the target population is highly
dispersed, then it makes sense that the sample size should be large so that this variation is
adequately captured. As a result, minimum sample size would be contingent on the extent of
variation. Additionally, minimum sample size would also be dependent on the underlying
MOE (Margin of Error) which is a function of the accuracy that the researcher desires in the
result. Hence, higher accuracy would imply lower MOE and a larger minimum sample size.
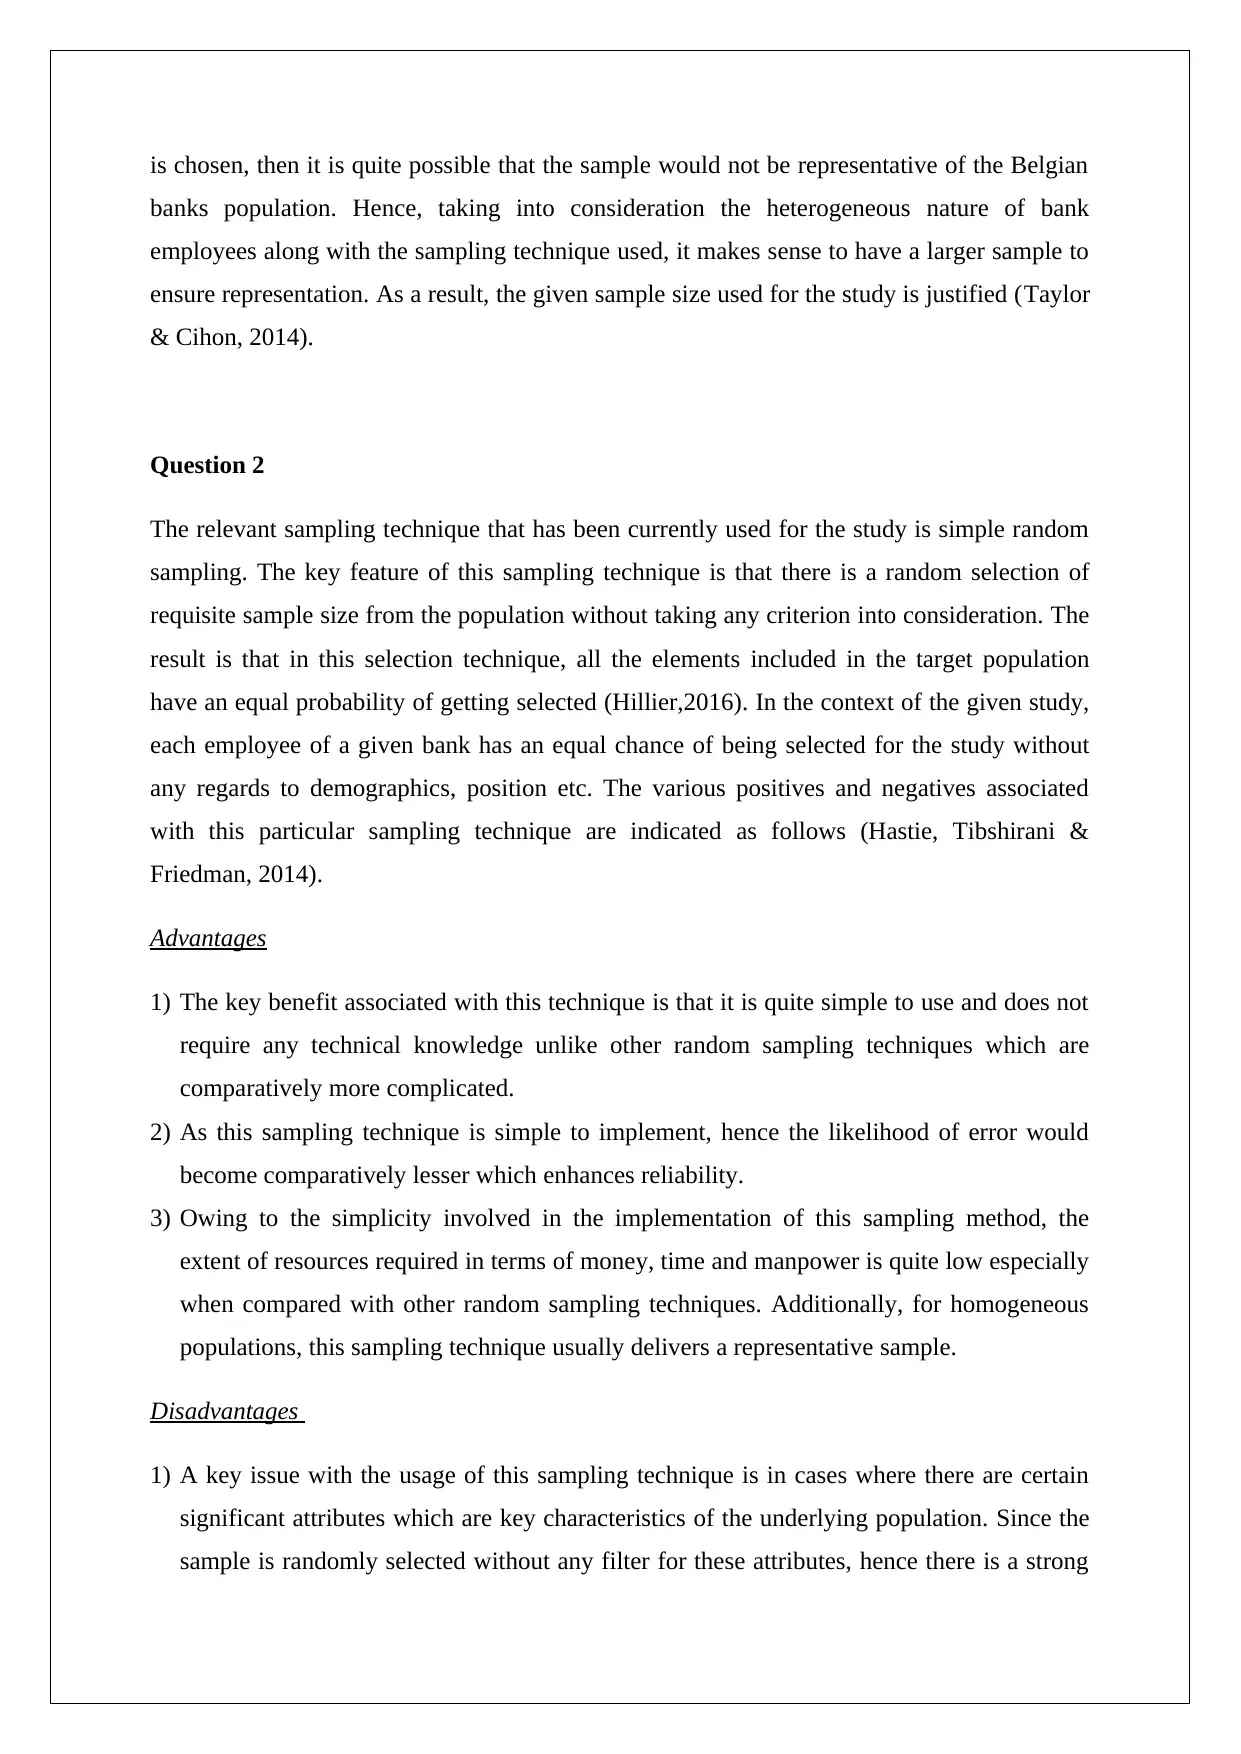
The above understanding is captured in the following formula (Hair et. al., 2015).
In the above formula, the dispersion in the population is captured by the standard deviation
while MOE captures the accuracy. The alphabet “n” captures the minimum sample size.
With regards to the study comprising of sample from Belgian banks, the sample selected is
representation of the population and includes about 21% of the population. Even though 1 out
of 5 employees has been included in the sample for each of the banks but this is not large
considering that the population is not homogeneous. The satisfaction level of bank employees
would be affected by gender, age, department, employee level etc. Since there is no
separation classification of these key attributes before random selection, hence it is pivotal
that the sample selected must be larger in size. If a lower sample size than the current sample
A key process in research is sampling which is used to obtain a sample which can be used as
a proxy for the population of interest and thereby can be used to study the same. In sampling,
the researcher needs to decide on the requisite sample size. The decision is not straight
forward as a trade off exists with regards to estimate accuracy and the underlying resources
that can be deployed for the sampling process. Typically, standard error and sample size
share a inverse relationship which implies that a larger sample would make it more likely that
the underlying sample selected represents the population of interest faithfully. The problem
with taking a bigger sample is that greater resources in terms of finances and manpower will
be required to enable the same. The resources and manpower available for research is often
limited and hence prudence must be exhibited by the researcher in utilising the same (Flick,
2015).
In order to outline the requisite sample size, it makes sense to consider two pivotal aspects.
One of these is the dispersion in the target population. If the target population is highly
dispersed, then it makes sense that the sample size should be large so that this variation is
adequately captured. As a result, minimum sample size would be contingent on the extent of
variation. Additionally, minimum sample size would also be dependent on the underlying
MOE (Margin of Error) which is a function of the accuracy that the researcher desires in the
result. Hence, higher accuracy would imply lower MOE and a larger minimum sample size.
The above understanding is captured in the following formula (Hair et. al., 2015).
In the above formula, the dispersion in the population is captured by the standard deviation
while MOE captures the accuracy. The alphabet “n” captures the minimum sample size.
With regards to the study comprising of sample from Belgian banks, the sample selected is
representation of the population and includes about 21% of the population. Even though 1 out
of 5 employees has been included in the sample for each of the banks but this is not large
considering that the population is not homogeneous. The satisfaction level of bank employees
would be affected by gender, age, department, employee level etc. Since there is no
separation classification of these key attributes before random selection, hence it is pivotal
that the sample selected must be larger in size. If a lower sample size than the current sample
is chosen, then it is quite possible that the sample would not be representative of the Belgian
banks population. Hence, taking into consideration the heterogeneous nature of bank
employees along with the sampling technique used, it makes sense to have a larger sample to
ensure representation. As a result, the given sample size used for the study is justified (Taylor
& Cihon, 2014).
Question 2
The relevant sampling technique that has been currently used for the study is simple random
sampling. The key feature of this sampling technique is that there is a random selection of
requisite sample size from the population without taking any criterion into consideration. The
result is that in this selection technique, all the elements included in the target population
have an equal probability of getting selected (Hillier,2016). In the context of the given study,
each employee of a given bank has an equal chance of being selected for the study without
any regards to demographics, position etc. The various positives and negatives associated
with this particular sampling technique are indicated as follows (Hastie, Tibshirani &
Friedman, 2014).
Advantages
1) The key benefit associated with this technique is that it is quite simple to use and does not
require any technical knowledge unlike other random sampling techniques which are
comparatively more complicated.
2) As this sampling technique is simple to implement, hence the likelihood of error would
become comparatively lesser which enhances reliability.
3) Owing to the simplicity involved in the implementation of this sampling method, the
extent of resources required in terms of money, time and manpower is quite low especially
when compared with other random sampling techniques. Additionally, for homogeneous
populations, this sampling technique usually delivers a representative sample.
Disadvantages
1) A key issue with the usage of this sampling technique is in cases where there are certain
significant attributes which are key characteristics of the underlying population. Since the
sample is randomly selected without any filter for these attributes, hence there is a strong
⊘ This is a preview!⊘
Do you want full access?
Subscribe today to unlock all pages.
Trusted by 1+ million students worldwide
possibility of these key attributes to be misrepresented. This aspect can be highlighted
within the context of the current study. The employee satisfaction level would be driven
by key attributes such as gender, age, employee level and other parameters. In the selected
sample for each bank, it is quite possible that the above identified attributes are not
represented in the same proportion as the underlying bank population. Thus, a superior
alternative is in the form of stratified random sampling where the first step is to divide the
population into various groups based on the key attributes. Once the division has been
performed, then random selection from each attribute is carried out thereby resulting in the
sample being representative of the underlying population. Typically, the simple random
sampling aims to overcome this issue by choosing a bigger sample size which would
require higher resources for selection and data collection.
Question 3
With regards to the utility of the study results, two pivotal aspects are reliability and validity
which need to be ensured. In relation to the given study, the reliability and validity of the
measures used has been carried out as follows (Hair et. al., 2015).
Quantitative job insecurity – The suitable statistical parameter to indicate the
reliability is known as Cronbach alpha. In case of a quantitative variable, if the
cronbach alpha does exceeds 0.8, then the underlying variable can be concluded as
being reliable. For the given variable under consideration, this condition is met which
implies that the measure is reliable. The validity of the given measure is highlighted
by the use of this measure in the empirical studies. In the past studies, the same
quantitative description for job insecurity has been used which leads to the conclusion
that there are no reliability related concerns for the given variable.
Qualitative job insecurity – In case of a qualitative variable, if the cronbach alpha
does exceeds 0.7, then the underlying variable can be concluded as being reliable. For
the given variable under consideration, this condition is met which implies that the
measure is reliable. It is known that the given measure involves the usage of only 10
selective measures from the list of 17 measures included in the given variable. This
choice of 10 variables may lead to selection bias which potentially could adversely
impact the validity of the measure under consideration.
Paraphrase This Document
Need a fresh take? Get an instant paraphrase of this document with our AI Paraphraser
Psychological distress – There is no concern regarding reliability as the cronbach
alpha for the underlying parameter exceeds 0.8. The key concern about the measure
for psychological distress is the underlying validity as the empirical evidence for the
same is deducted from a study carried out more than five decades ago. Since then,
there have been developments in the field of psychology which would lead to changes
in the measure that would have been used decades ago. As a result, it would be
considered superior is a relatively new measure of psychological distress is deployed
which has been used in the more recent studies.
It may be concluded on account of the above discussion that for the measures that have been
used in the study, reliability does not pose any issue as indicated from the respective
cronbach alpha. But the same cannot be said about the validity for some of measures which
may not be valid on account of selective choice and lack of recent empirical support.
Question 4
The objective of the given study on employee satisfaction is to indicate the level of
association between qualitative and quantitative measures which have been deployed in the
context of employee well being and job security. Also, for the given study some variables
like age, gender have been labelled as control variables. This labelling of the variables as
control variables can be explained on account of the underlying potential that these variables
have in regards to altering the relationship between the variables of interest (Medhi, 2016).
As a result, if the control variables are not kept constant, then the results would be unreliable
as they would impact the relationship observed between the variables of interest. While the
control variables do not need to be monitored during the research, but it is imperative that the
same must be kept constant. Hence, these variables are not monitored on a continuous basis
as the primary objective is to identify and control their fluctuations by holding them constant
(Eriksson & Kovalainen, 2015).
The role of the control variables can be explained based on the given study and control
variables identified. Age for instance plays a crucial role in altering the relationship between
qualitative and quantitative aspects related to satisfaction and job security. The preferences of
employees tend to vary with age. For instance, older employees would value job stability
over the qualitative aspects such as work environment and learning. This is because it would
be difficult for them to find a new job and adjust to a different corporate culture. In sharp
contrast, employees of young age would not prefer job security over the learning and work
culture. This is because at the early stage employees are highly flexible and aim to learn so as
to propel their career. Hence, it is evident that any change in the control variable would
influence the different parameters of employee satisfaction and hence need to be kept under
check.
Gender is yet another control variable which has been listed by the researcher. Owing to the
differing preferences and priorities of the two genders, the factors driving job satisfaction
would potentially be different. Hence, the employee satisfaction level is influenced by the
underlying gender distribution of employees. Further, the educational background of the
employees is also a key driver of underlying satisfaction. The highly qualified employees
would be readily employable and thereby would not be highly concerned about the
quantitative aspects but would have their main focus on qualitative aspects. This would be in
sharp contrast with the lesser qualified workers who would want to retain their jobs as they
would find it difficult to obtain another job. Therefore, the quantitative aspects of job security
and satisfaction are more pivotal for these employees.
Question 5
In relation to the given study, the appropriate research design is correlational design. The
various positives (advantages) and negatives (disadvantages) linked with this given design
are outlined as follows (Taylor & Cihon, 2014).
Advantages
1) Unlike experiments that are conducted within laboratory conditions, the correlation
research design is conducted under normal conditions. This results in the correlation
based studies to have a higher practical significance.
2) Typically, the information which is obtained through correlational design tends to be
larger as compared to experiments.
3) The given research design does act as a suitable point to start the various researcher
especially with descriptive design and experimental design. This is because the results
⊘ This is a preview!⊘
Do you want full access?
Subscribe today to unlock all pages.
Trusted by 1+ million students worldwide
of the correlational research are used as a reference point to carry out in-depth
research to explain the observation and enhance understanding about the same.
Disadvantages
1) The existence of correlation between variables does not imply the existence of causal
relationship. In order to test the same, other research designs such as descriptive and
experimental may be required. As a result, the conclusion provided only from the
correlational studies may be incomplete.
2) Further, this particular research design is not suitable when the number of variables is
quite large as this relies on considering two variables at a time and hence it is difficult
to consider the impact of multiple variables simultaneously.
Paraphrase This Document
Need a fresh take? Get an instant paraphrase of this document with our AI Paraphraser
References
Eriksson, P. & Kovalainen, A. (2015). Quantitative methods in business research (3rded.).
London: Sage Publications.
Flick, U. (2015) Introducing research methodology: A beginner's guide to doing a research
project (4thed.). New York: Sage Publications.
Hair, J. F., Wolfinbarger, M., Money, A. H., Samouel, P., & Page, M. J. (2015) Essentials of
business research methods (2nded.). New York: Routledge.
Hastie, T., Tibshirani, R. & Friedman, J. (2016). The Elements of Statistical Learning
(4thed.). New York: Springer Publications.
Hillier, F. (2016) Introduction to Operations Research(6thed.). New York: McGraw Hill
Publications.
Medhi, J. (2016). Statistical Methods: An Introductory Text (4th ed.). Sydney: New Age
International.
Taylor, K. J. & Cihon, C. (2014). Statistical Techniques for Data Analysis (2nd ed.).
Melbourne: CRC Press.
1 out of 8
Related Documents


Your All-in-One AI-Powered Toolkit for Academic Success.
+13062052269
info@desklib.com
Available 24*7 on WhatsApp / Email
![[object Object]](/_next/static/media/star-bottom.7253800d.svg)
Unlock your academic potential
Copyright © 2020–2026 A2Z Services. All Rights Reserved. Developed and managed by ZUCOL.