Regression Analysis: Hypothesis Testing and Confidence Intervals
VerifiedAdded on 2023/06/18
|12
|1521
|331
Homework Assignment
AI Summary
This assignment solution covers statistical inference, hypothesis testing, and regression analysis. It includes the construction of confidence intervals (95% and 99%) for mean amounts spent, and confidence intervals (90% and 95%) for the proportion of shoppers buying apparel. The solution also determines the necessary sample size for a given confidence level. The hypothesis testing section addresses the association between vaccine effectiveness and symptom improvement, discussing Type 1 and Type 2 errors, and analyzes waiting times using t-tests at different significance levels. Finally, the regression analysis section examines the relationship between years of education and winning in TV game shows, providing a regression equation for predicting winnings and a residual plot.
Regression Analysis Hypothesis
Testing Statistical Inference and
Confidence Intervals
Testing Statistical Inference and
Confidence Intervals
Paraphrase This Document
Need a fresh take? Get an instant paraphrase of this document with our AI Paraphraser
TABLE OF CONTENTS
SECTION 1: STATISTICAL INFERENCE AND CONFIDENCE INTERVALS........................2
Question 1....................................................................................................................................2
a) Construct 95% and 99% CI.....................................................................................................2
b) Construct 90% and 95% CI.....................................................................................................3
c) Sample size needed during 90% CI.........................................................................................4
SECTION 2: HYPOTHESIS TESTING.........................................................................................5
Question 2....................................................................................................................................5
a) Hypothesis...............................................................................................................................5
b) Risk associated with Type 1 and Type 2 errors.......................................................................5
Question 3....................................................................................................................................6
SECTION 3: REGRESSION ANALYSIS......................................................................................7
1. Regression analysis..................................................................................................................7
2. Summary in PPT......................................................................................................................8
3. Regression equation to determine predicted value..................................................................8
4. Graph of residual against the predicted value..........................................................................9
REFERENCES..............................................................................................................................10
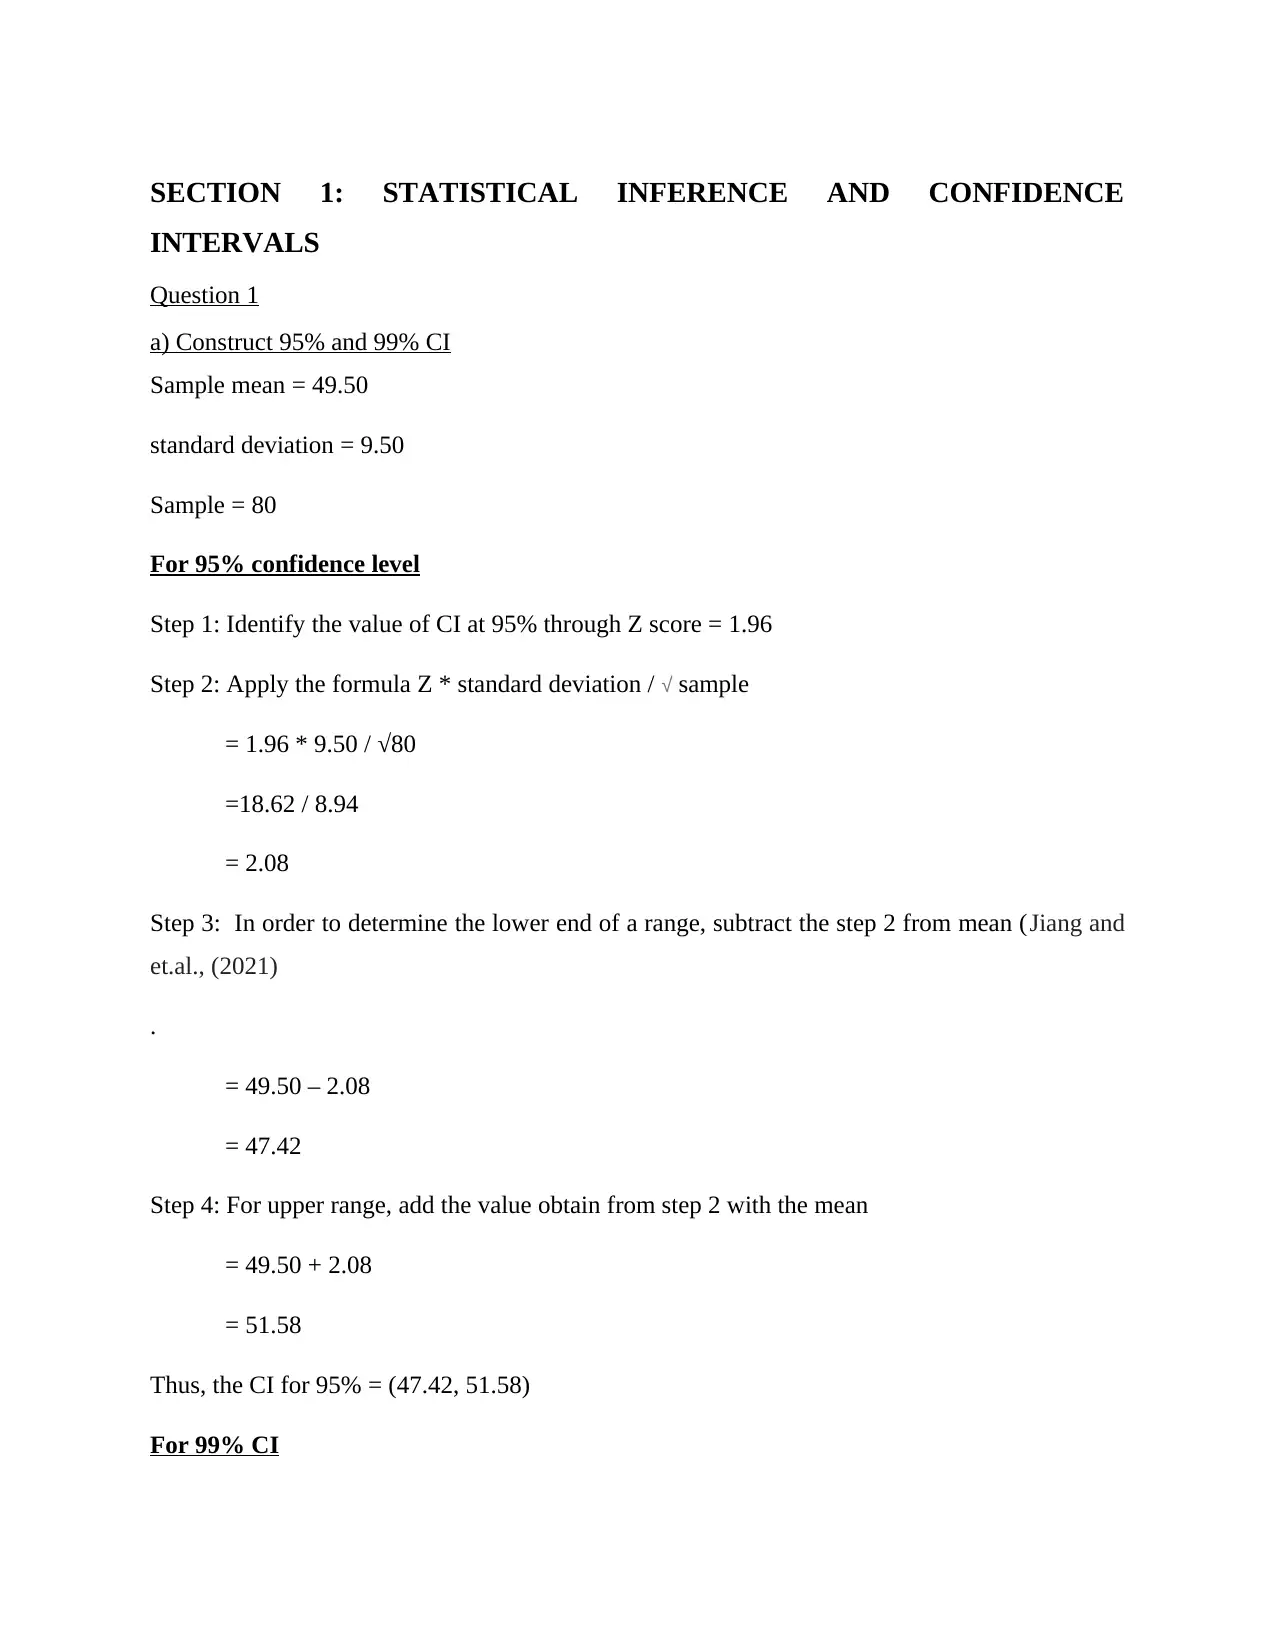
SECTION 1: STATISTICAL INFERENCE AND CONFIDENCE
INTERVALS
Question 1
a) Construct 95% and 99% CI
Sample mean = 49.50
standard deviation = 9.50
Sample = 80
For 95% confidence level
Step 1: Identify the value of CI at 95% through Z score = 1.96
Step 2: Apply the formula Z * standard deviation / √ sample
= 1.96 * 9.50 / √80
=18.62 / 8.94
= 2.08
Step 3: In order to determine the lower end of a range, subtract the step 2 from mean (Jiang and
et.al., (2021)
.
= 49.50 – 2.08
= 47.42
Step 4: For upper range, add the value obtain from step 2 with the mean
= 49.50 + 2.08
= 51.58
Thus, the CI for 95% = (47.42, 51.58)
For 99% CI
⊘ This is a preview!⊘
Do you want full access?
Subscribe today to unlock all pages.
Trusted by 1+ million students worldwide
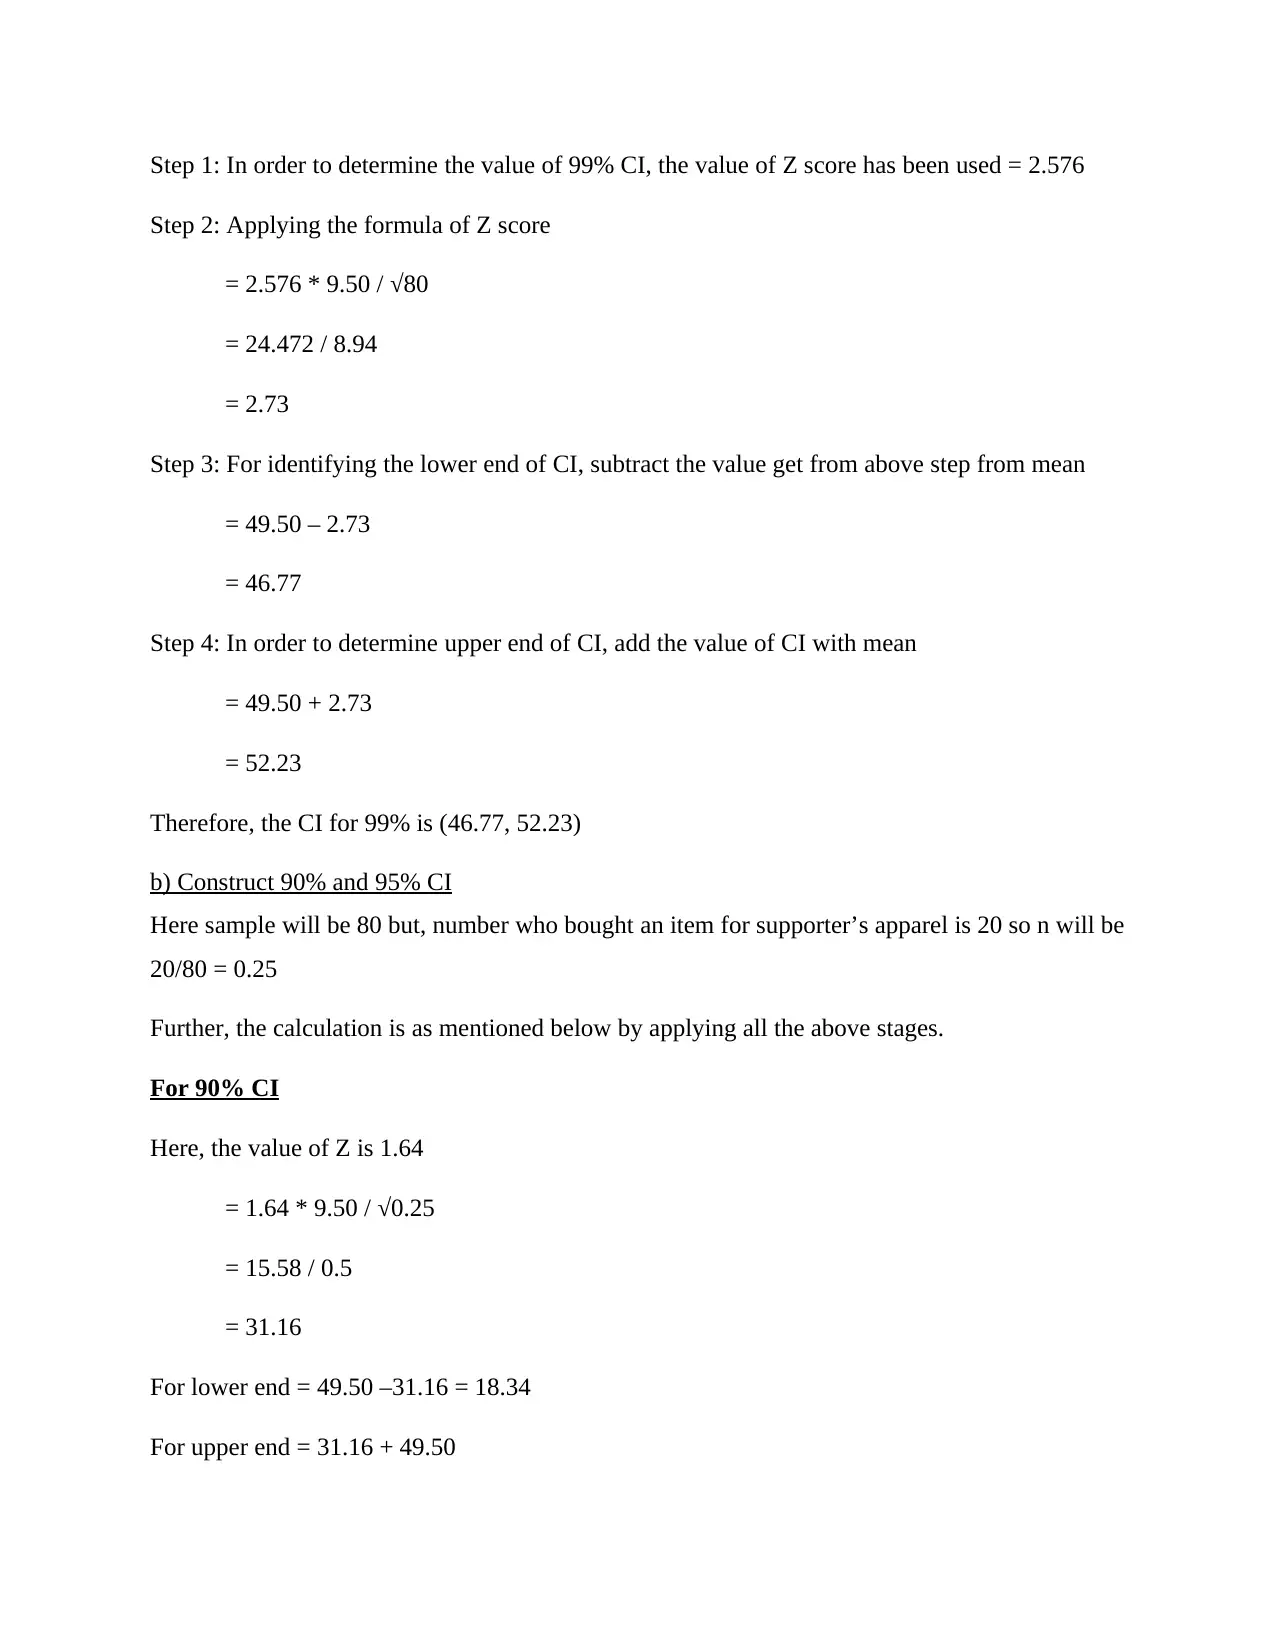
Step 1: In order to determine the value of 99% CI, the value of Z score has been used = 2.576
Step 2: Applying the formula of Z score
= 2.576 * 9.50 / √80
= 24.472 / 8.94
= 2.73
Step 3: For identifying the lower end of CI, subtract the value get from above step from mean
= 49.50 – 2.73
= 46.77
Step 4: In order to determine upper end of CI, add the value of CI with mean
= 49.50 + 2.73
= 52.23
Therefore, the CI for 99% is (46.77, 52.23)
b) Construct 90% and 95% CI
Here sample will be 80 but, number who bought an item for supporter’s apparel is 20 so n will be
20/80 = 0.25
Further, the calculation is as mentioned below by applying all the above stages.
For 90% CI
Here, the value of Z is 1.64
= 1.64 * 9.50 / √0.25
= 15.58 / 0.5
= 31.16
For lower end = 49.50 –31.16 = 18.34
For upper end = 31.16 + 49.50
Paraphrase This Document
Need a fresh take? Get an instant paraphrase of this document with our AI Paraphraser
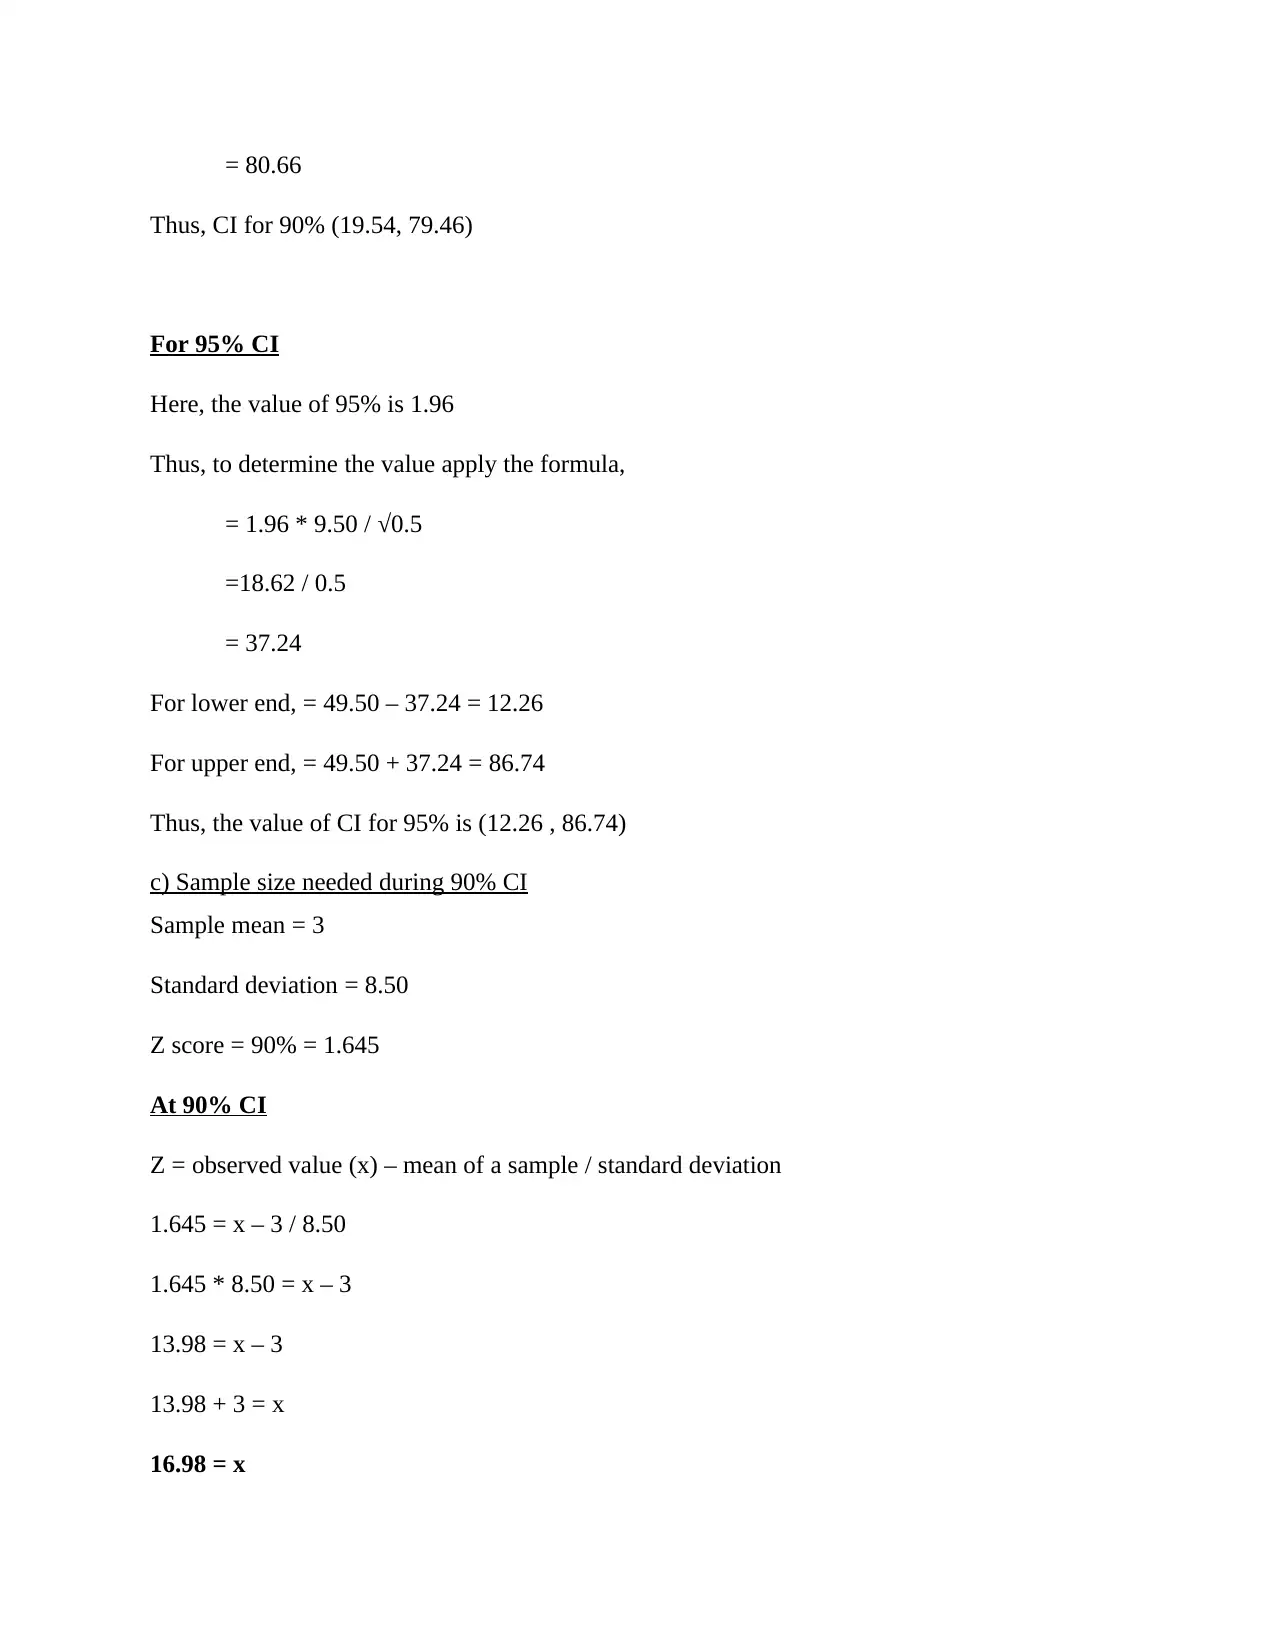
= 80.66
Thus, CI for 90% (19.54, 79.46)
For 95% CI
Here, the value of 95% is 1.96
Thus, to determine the value apply the formula,
= 1.96 * 9.50 / √0.5
=18.62 / 0.5
= 37.24
For lower end, = 49.50 – 37.24 = 12.26
For upper end, = 49.50 + 37.24 = 86.74
Thus, the value of CI for 95% is (12.26 , 86.74)
c) Sample size needed during 90% CI
Sample mean = 3
Standard deviation = 8.50
Z score = 90% = 1.645
At 90% CI
Z = observed value (x) – mean of a sample / standard deviation
1.645 = x – 3 / 8.50
1.645 * 8.50 = x – 3
13.98 = x – 3
13.98 + 3 = x
16.98 = x
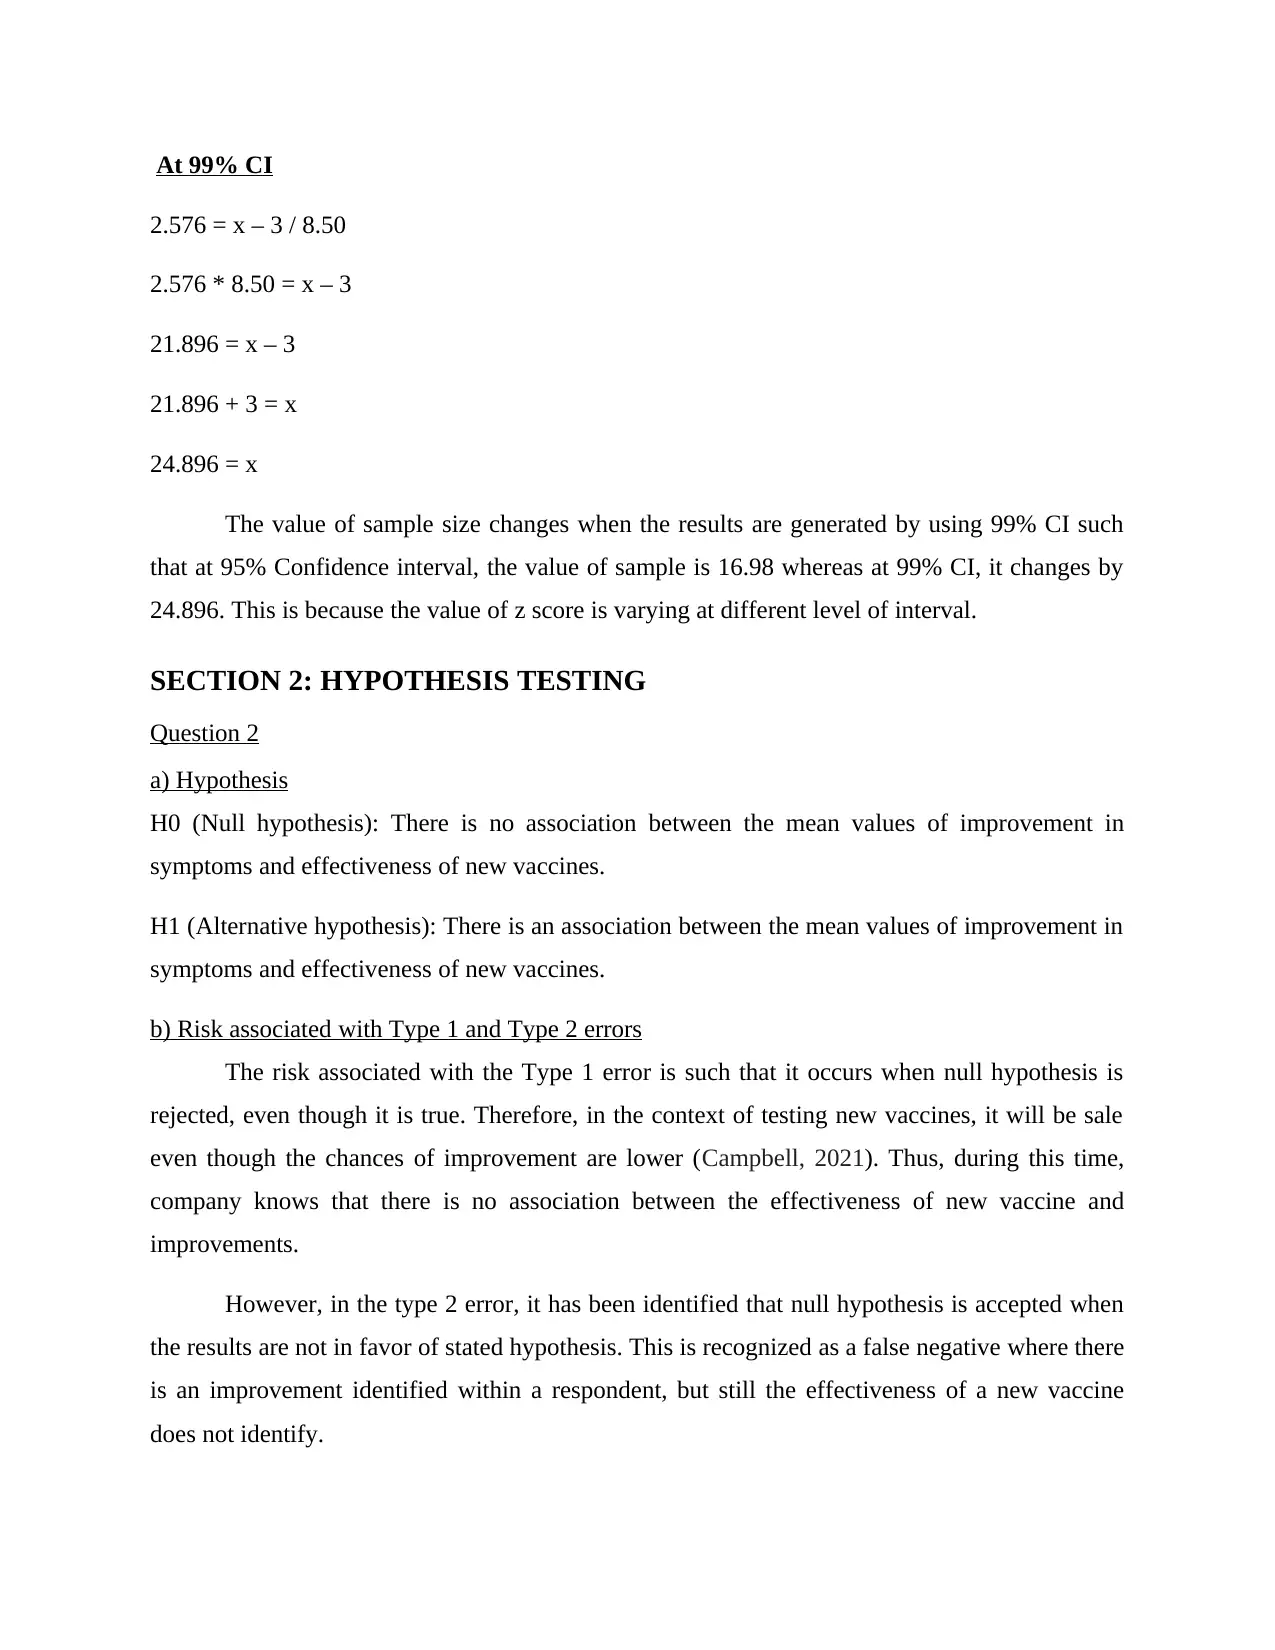
At 99% CI
2.576 = x – 3 / 8.50
2.576 * 8.50 = x – 3
21.896 = x – 3
21.896 + 3 = x
24.896 = x
The value of sample size changes when the results are generated by using 99% CI such
that at 95% Confidence interval, the value of sample is 16.98 whereas at 99% CI, it changes by
24.896. This is because the value of z score is varying at different level of interval.
SECTION 2: HYPOTHESIS TESTING
Question 2
a) Hypothesis
H0 (Null hypothesis): There is no association between the mean values of improvement in
symptoms and effectiveness of new vaccines.
H1 (Alternative hypothesis): There is an association between the mean values of improvement in
symptoms and effectiveness of new vaccines.
b) Risk associated with Type 1 and Type 2 errors
The risk associated with the Type 1 error is such that it occurs when null hypothesis is
rejected, even though it is true. Therefore, in the context of testing new vaccines, it will be sale
even though the chances of improvement are lower (Campbell, 2021). Thus, during this time,
company knows that there is no association between the effectiveness of new vaccine and
improvements.
However, in the type 2 error, it has been identified that null hypothesis is accepted when
the results are not in favor of stated hypothesis. This is recognized as a false negative where there
is an improvement identified within a respondent, but still the effectiveness of a new vaccine
does not identify.
⊘ This is a preview!⊘
Do you want full access?
Subscribe today to unlock all pages.
Trusted by 1+ million students worldwide
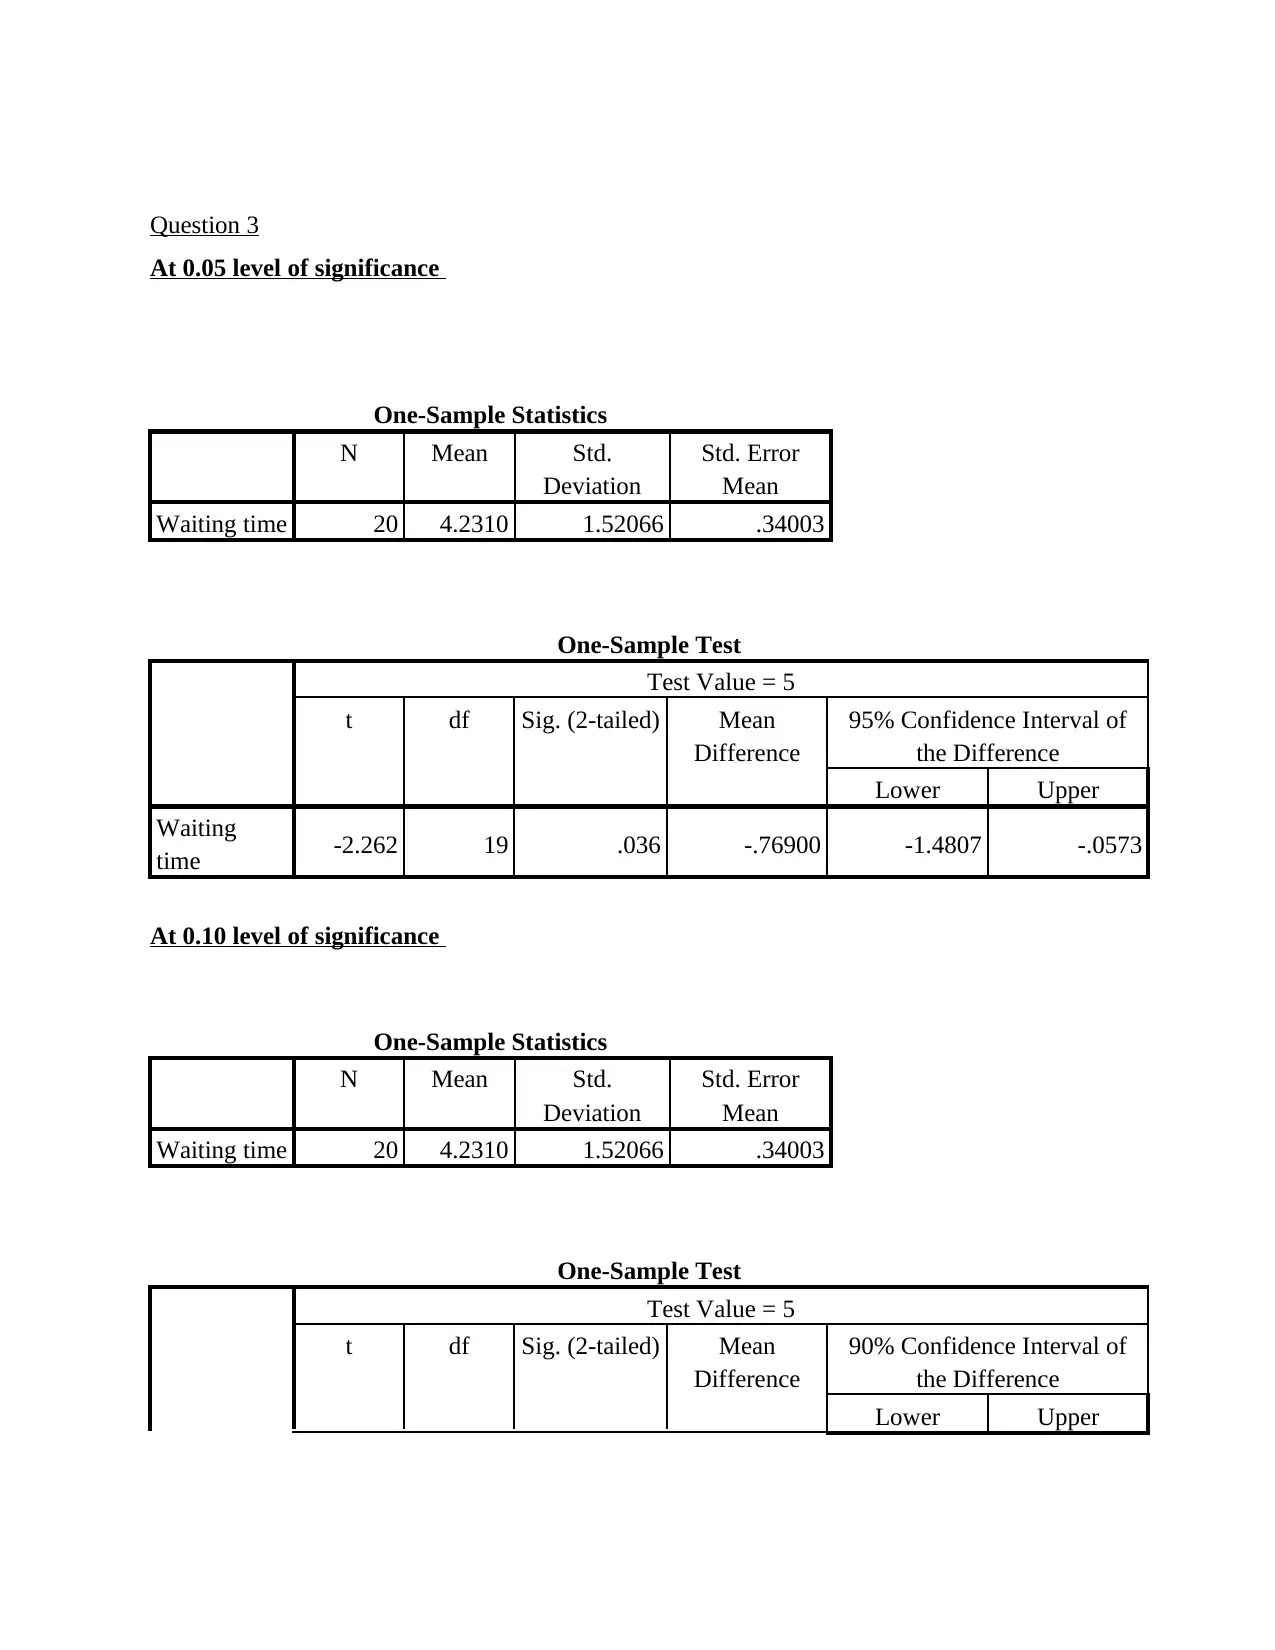
Question 3
At 0.05 level of significance
One-Sample Statistics
N Mean Std.
Deviation
Std. Error
Mean
Waiting time 20 4.2310 1.52066 .34003
One-Sample Test
Test Value = 5
t df Sig. (2-tailed) Mean
Difference
95% Confidence Interval of
the Difference
Lower Upper
Waiting
time -2.262 19 .036 -.76900 -1.4807 -.0573
At 0.10 level of significance
One-Sample Statistics
N Mean Std.
Deviation
Std. Error
Mean
Waiting time 20 4.2310 1.52066 .34003
One-Sample Test
Test Value = 5
t df Sig. (2-tailed) Mean
Difference
90% Confidence Interval of
the Difference
Lower Upper
Paraphrase This Document
Need a fresh take? Get an instant paraphrase of this document with our AI Paraphraser
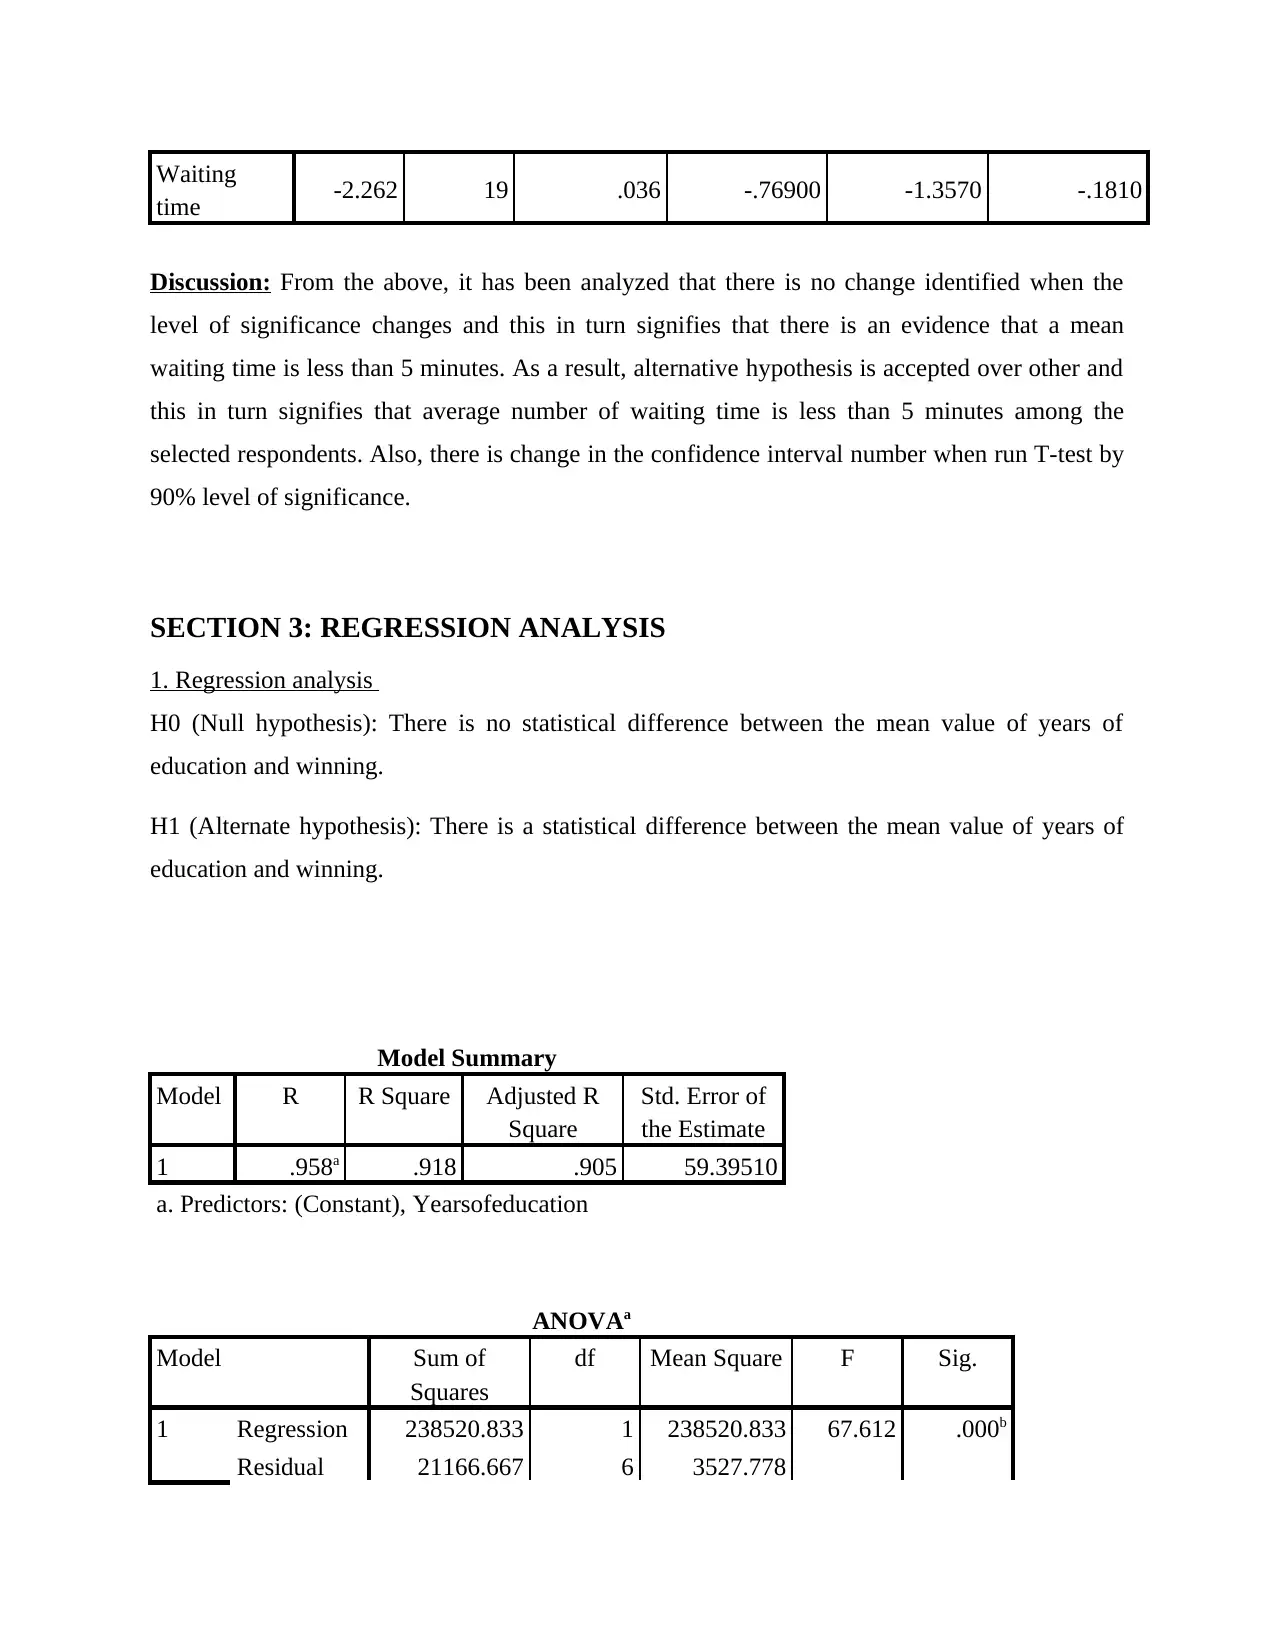
Waiting
time -2.262 19 .036 -.76900 -1.3570 -.1810
Discussion: From the above, it has been analyzed that there is no change identified when the
level of significance changes and this in turn signifies that there is an evidence that a mean
waiting time is less than 5 minutes. As a result, alternative hypothesis is accepted over other and
this in turn signifies that average number of waiting time is less than 5 minutes among the
selected respondents. Also, there is change in the confidence interval number when run T-test by
90% level of significance.
SECTION 3: REGRESSION ANALYSIS
1. Regression analysis
H0 (Null hypothesis): There is no statistical difference between the mean value of years of
education and winning.
H1 (Alternate hypothesis): There is a statistical difference between the mean value of years of
education and winning.
Model Summary
Model R R Square Adjusted R
Square
Std. Error of
the Estimate
1 .958a .918 .905 59.39510
a. Predictors: (Constant), Yearsofeducation
ANOVAa
Model Sum of
Squares
df Mean Square F Sig.
1 Regression 238520.833 1 238520.833 67.612 .000b
Residual 21166.667 6 3527.778
Total 259687.500 7
a. Dependent Variable: winning
b. Predictors: (Constant), Yearsofeducation
Coefficientsa
Model Unstandardized
Coefficients
Standardized
Coefficients
t Sig.
B Std. Error Beta
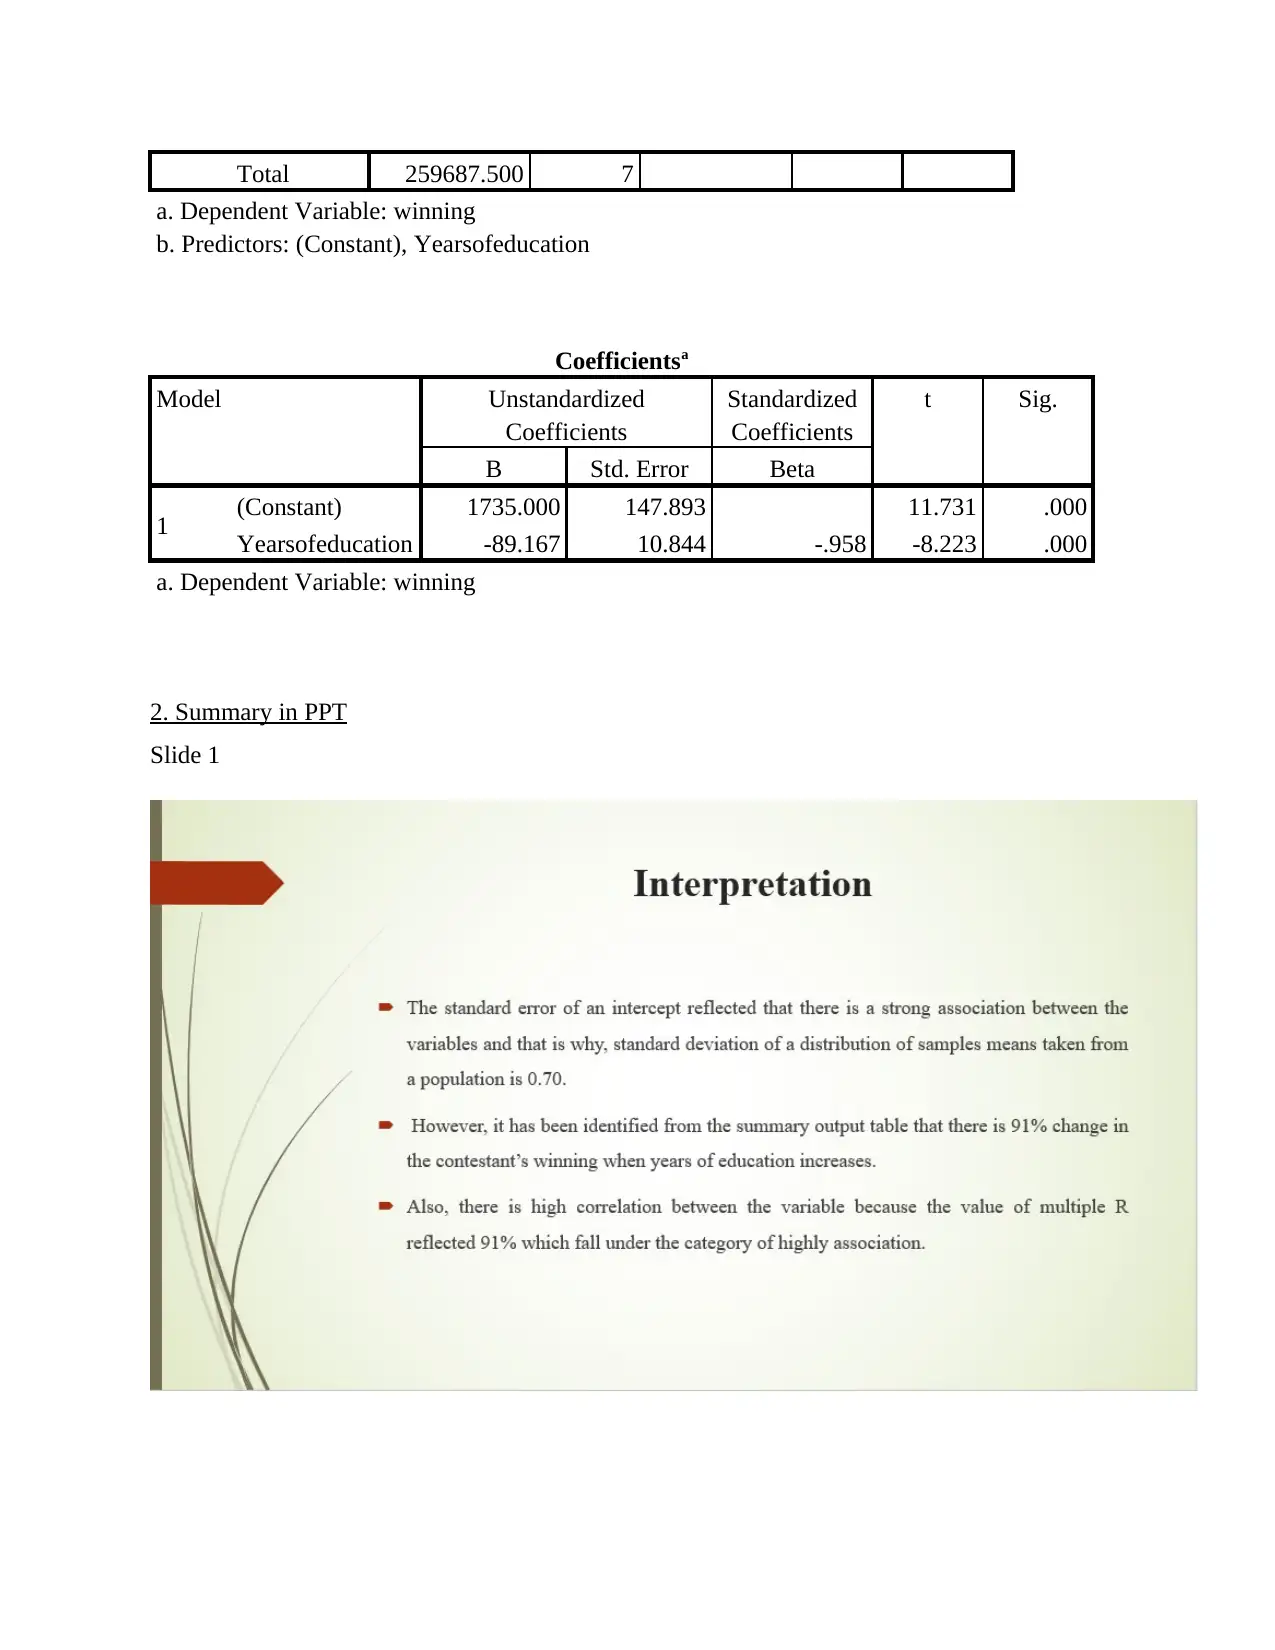
1 (Constant) 1735.000 147.893 11.731 .000
Yearsofeducation -89.167 10.844 -.958 -8.223 .000
a. Dependent Variable: winning
2. Summary in PPT
Slide 1
a. Dependent Variable: winning
b. Predictors: (Constant), Yearsofeducation
Coefficientsa
Model Unstandardized
Coefficients
Standardized
Coefficients
t Sig.
B Std. Error Beta
1 (Constant) 1735.000 147.893 11.731 .000
Yearsofeducation -89.167 10.844 -.958 -8.223 .000
a. Dependent Variable: winning
2. Summary in PPT
Slide 1
⊘ This is a preview!⊘
Do you want full access?
Subscribe today to unlock all pages.
Trusted by 1+ million students worldwide
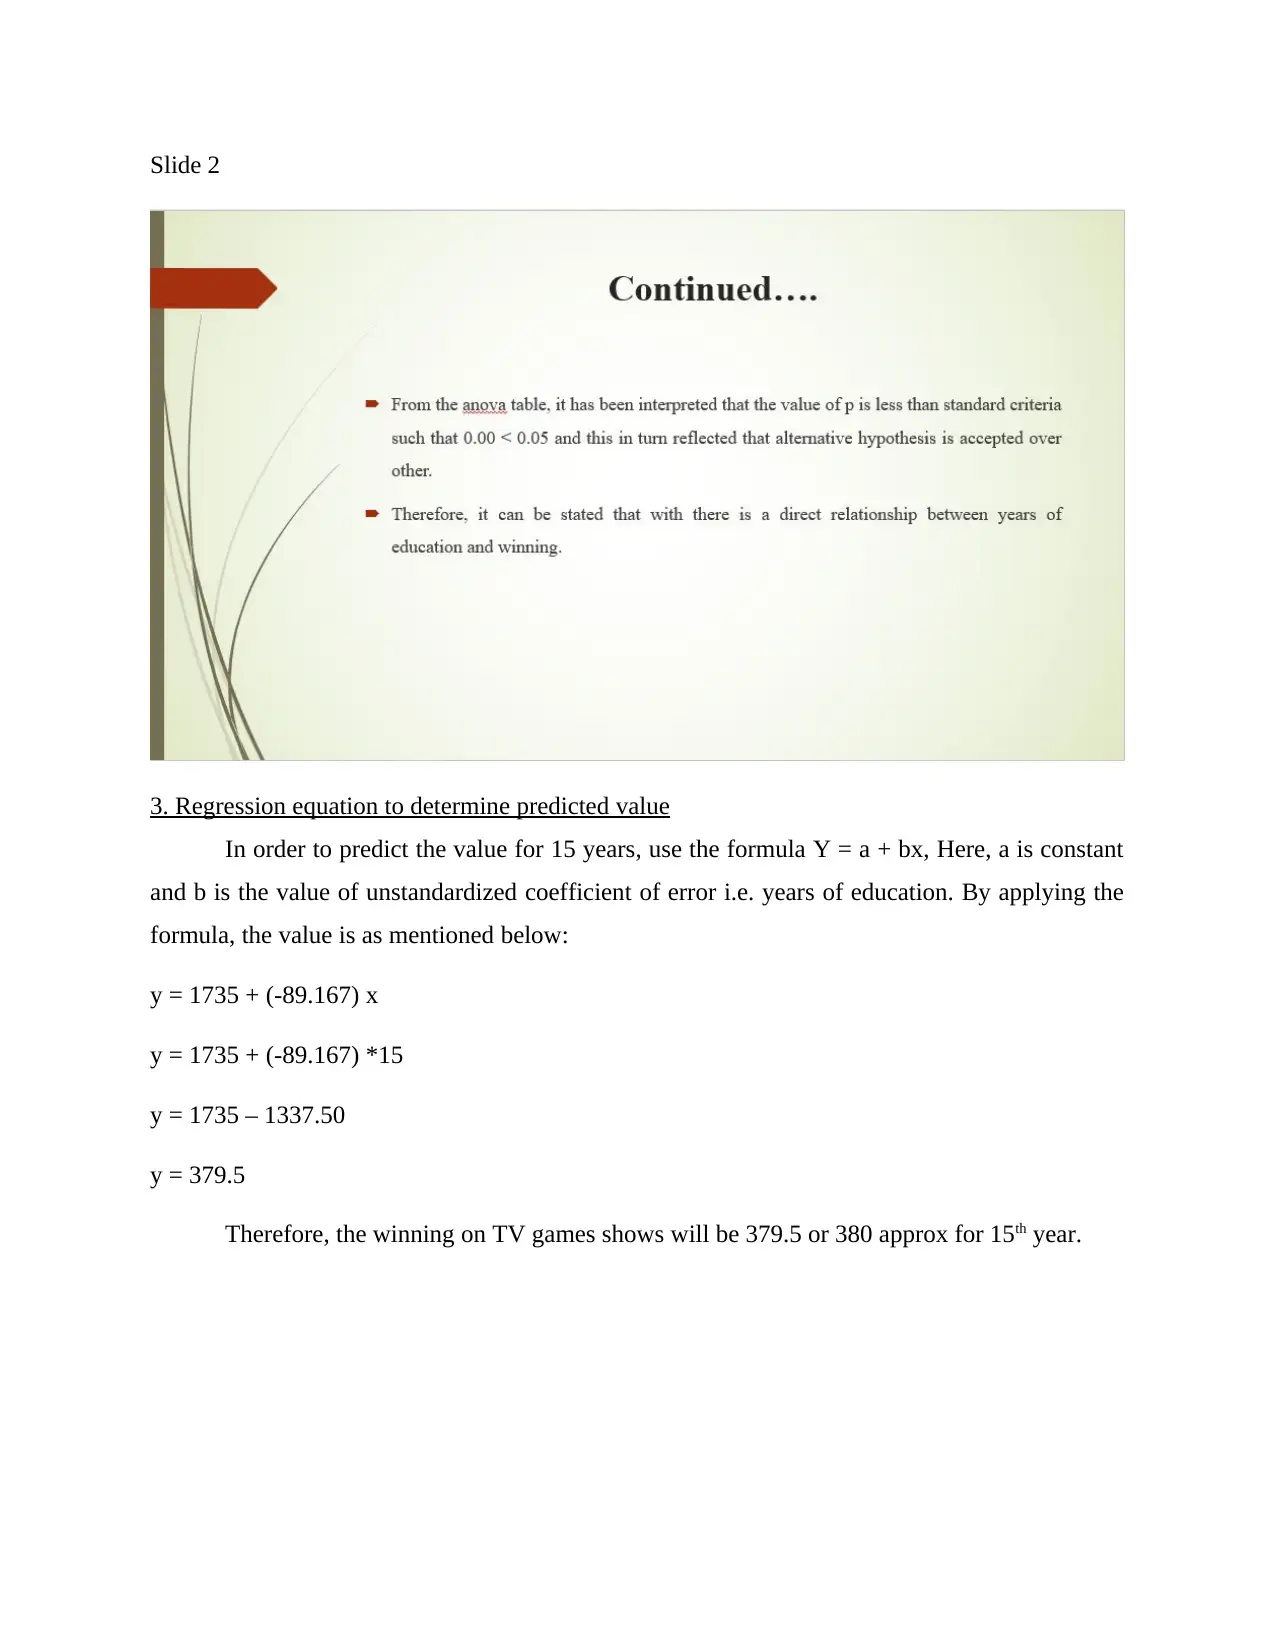
Slide 2
3. Regression equation to determine predicted value
In order to predict the value for 15 years, use the formula Y = a + bx, Here, a is constant
and b is the value of unstandardized coefficient of error i.e. years of education. By applying the
formula, the value is as mentioned below:
y = 1735 + (-89.167) x
y = 1735 + (-89.167) *15
y = 1735 – 1337.50
y = 379.5
Therefore, the winning on TV games shows will be 379.5 or 380 approx for 15th year.
Paraphrase This Document
Need a fresh take? Get an instant paraphrase of this document with our AI Paraphraser
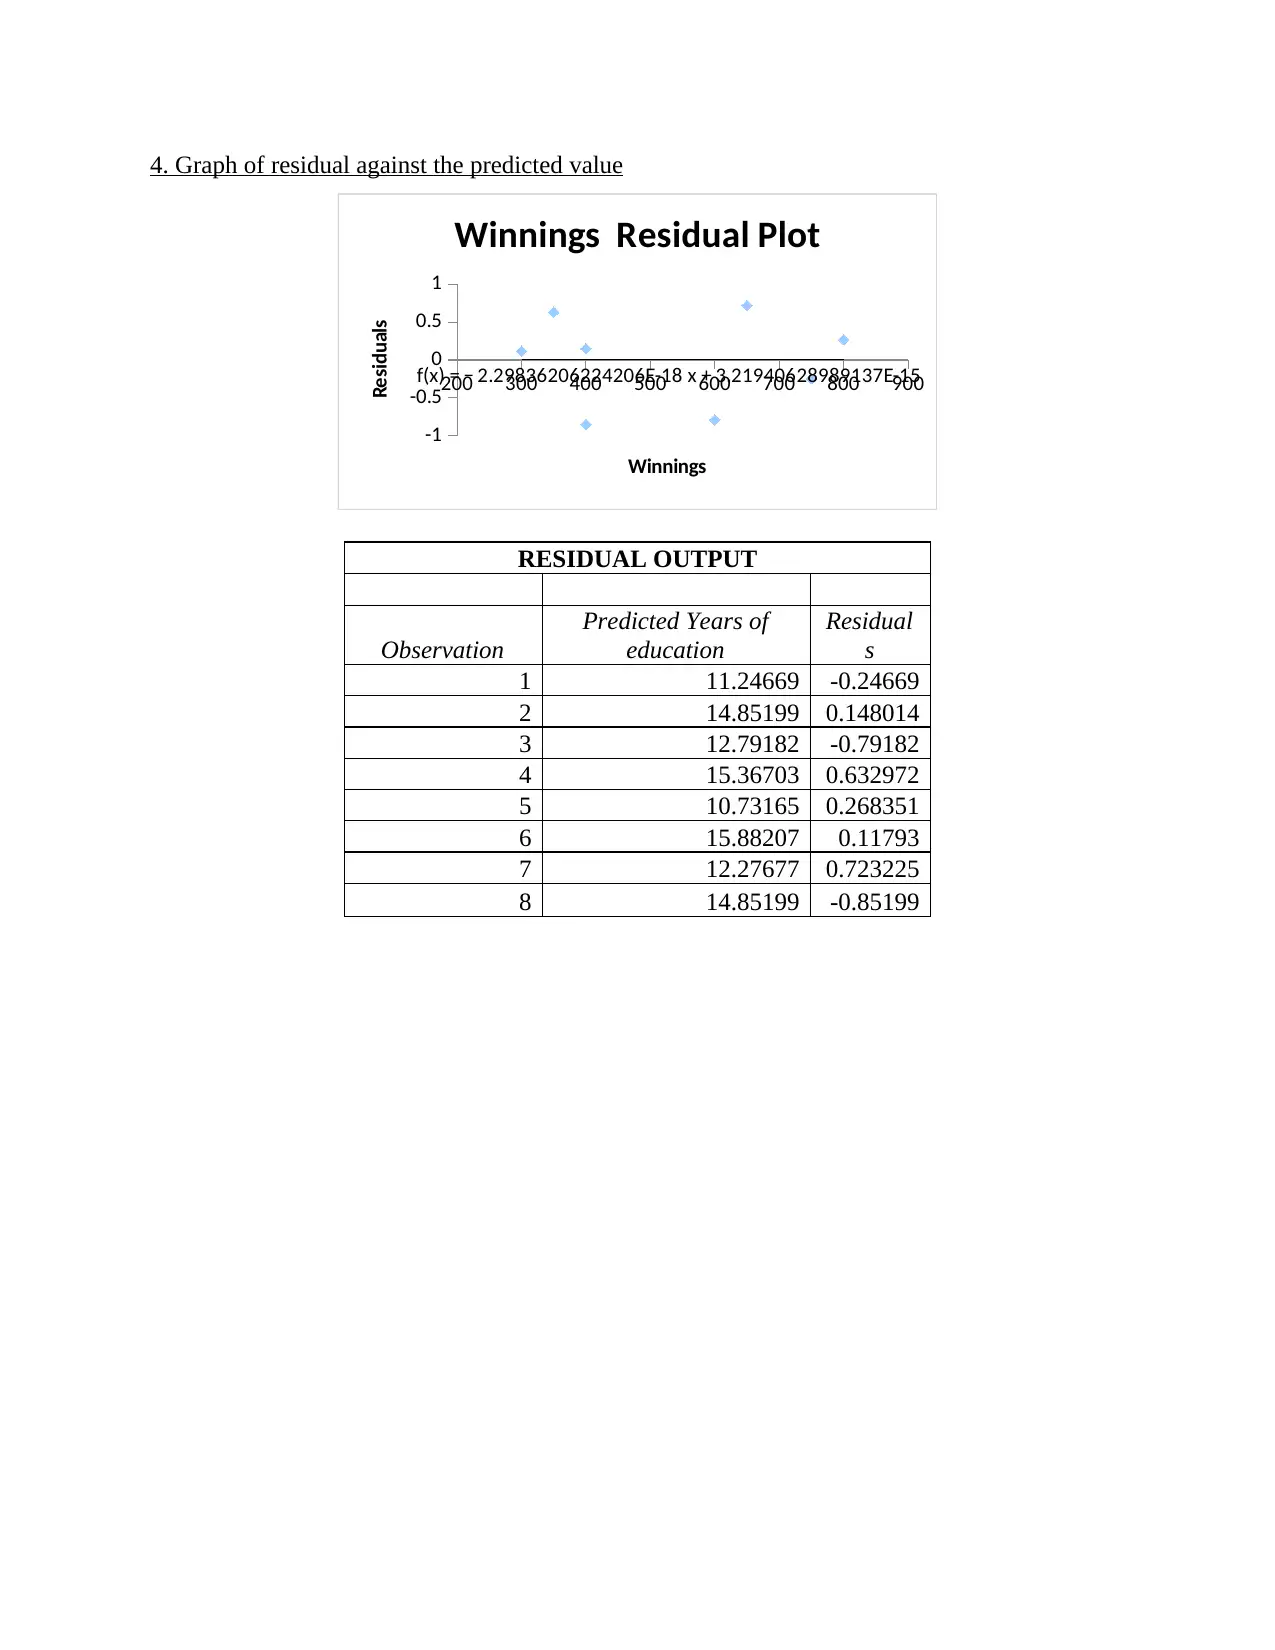
4. Graph of residual against the predicted value
200 300 400 500 600 700 800 900
-1
-0.5
0
0.5
1
f(x) = − 2.29836206224206E-18 x + 3.21940628989137E-15
Winnings Residual Plot
Winnings
Residuals
RESIDUAL OUTPUT
Observation
Predicted Years of
education
Residual
s
1 11.24669 -0.24669
2 14.85199 0.148014
3 12.79182 -0.79182
4 15.36703 0.632972
5 10.73165 0.268351
6 15.88207 0.11793
7 12.27677 0.723225
8 14.85199 -0.85199
REFERENCES
Books and Journals
Campbell, M. J. (Ed.). (2021). Statistics at square one. John Wiley & Sons.
Jiang, Z. and et.al., (2021). A Monte Carlo Study of Confidence Interval Methods for
Generalizability Coefficient. Educational and Psychological Measurement,
00131644211033899.
Books and Journals
Campbell, M. J. (Ed.). (2021). Statistics at square one. John Wiley & Sons.
Jiang, Z. and et.al., (2021). A Monte Carlo Study of Confidence Interval Methods for
Generalizability Coefficient. Educational and Psychological Measurement,
00131644211033899.
⊘ This is a preview!⊘
Do you want full access?
Subscribe today to unlock all pages.
Trusted by 1+ million students worldwide
1 out of 12
Your All-in-One AI-Powered Toolkit for Academic Success.
+13062052269
info@desklib.com
Available 24*7 on WhatsApp / Email
![[object Object]](/_next/static/media/star-bottom.7253800d.svg)
Unlock your academic potential
Copyright © 2020–2026 A2Z Services. All Rights Reserved. Developed and managed by ZUCOL.