Statistical Analysis Assignment: Problems and Solutions

Verified

Added on  2023/01/17

|8
|1314
|37
Homework Assignment
AI Summary
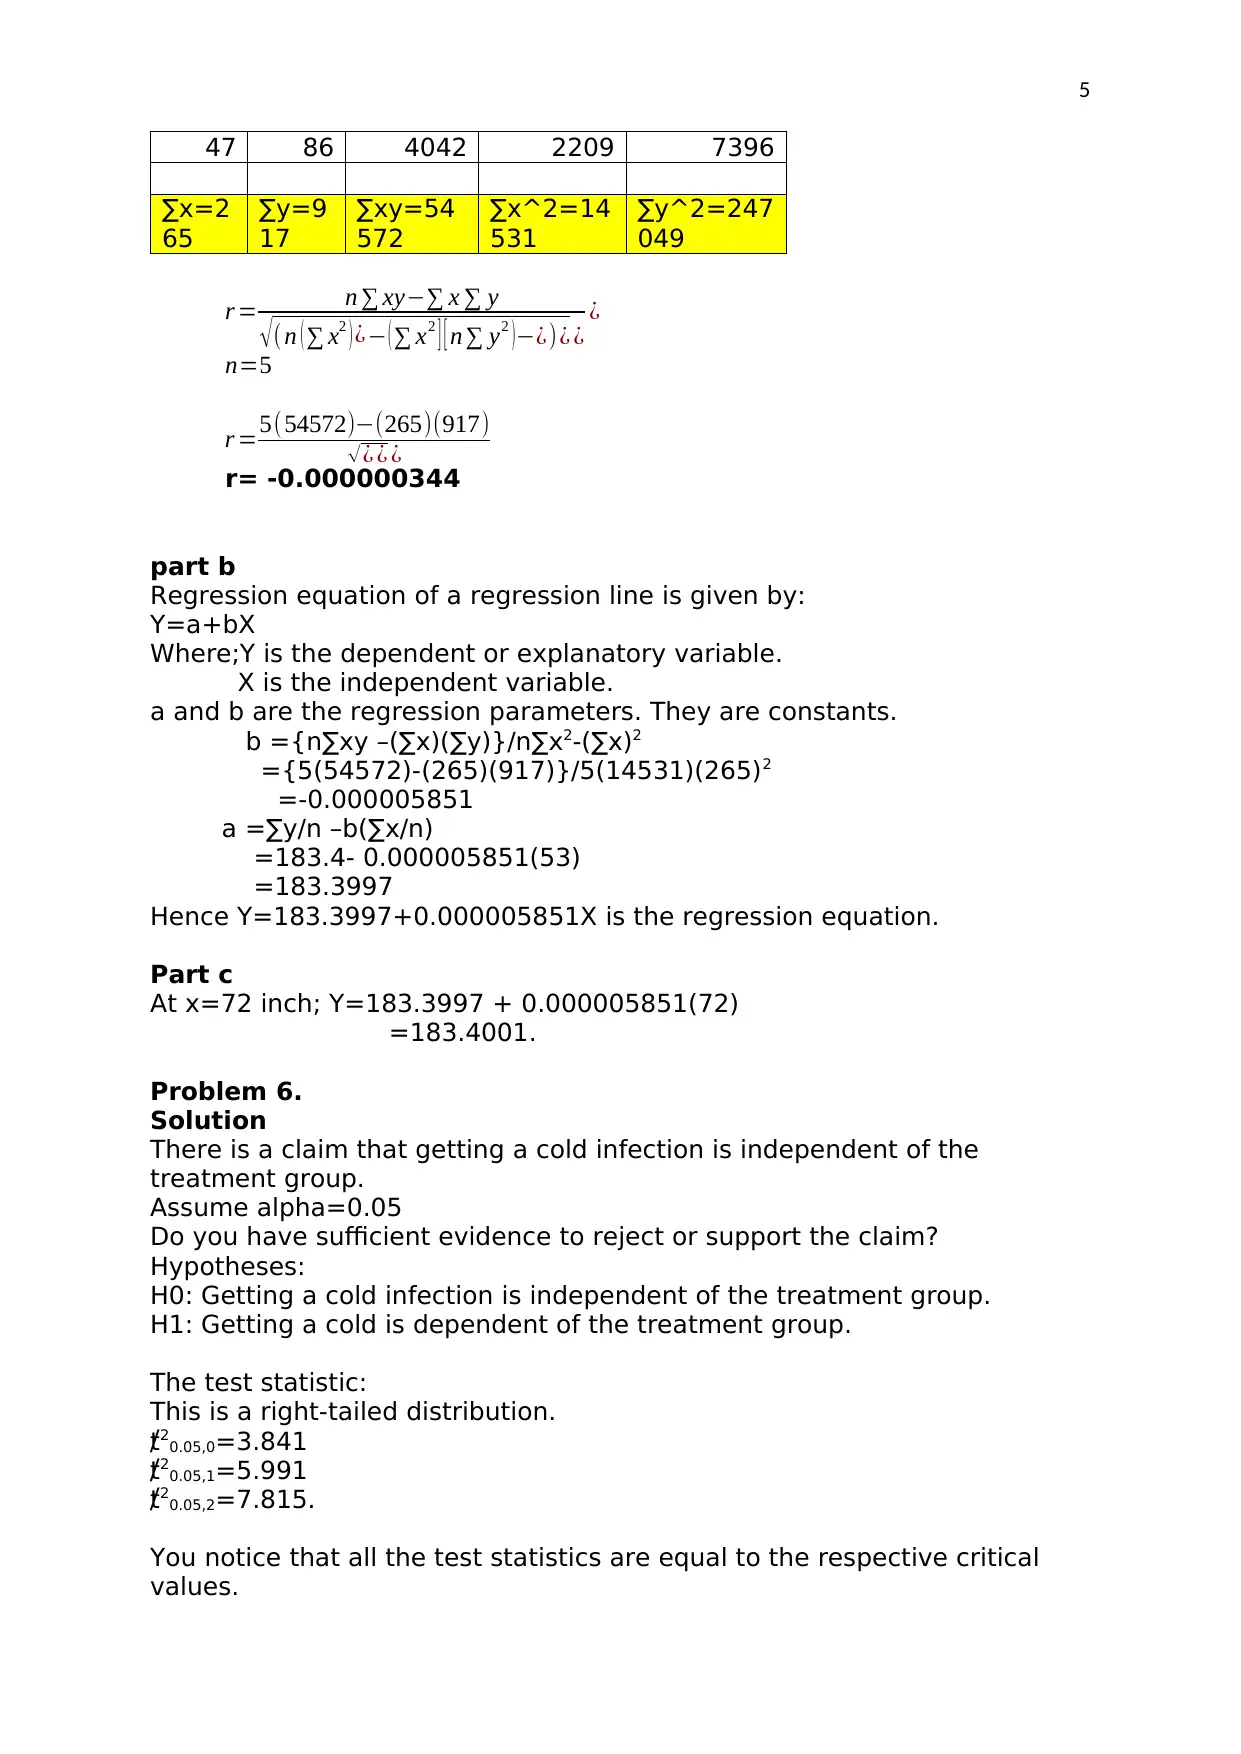
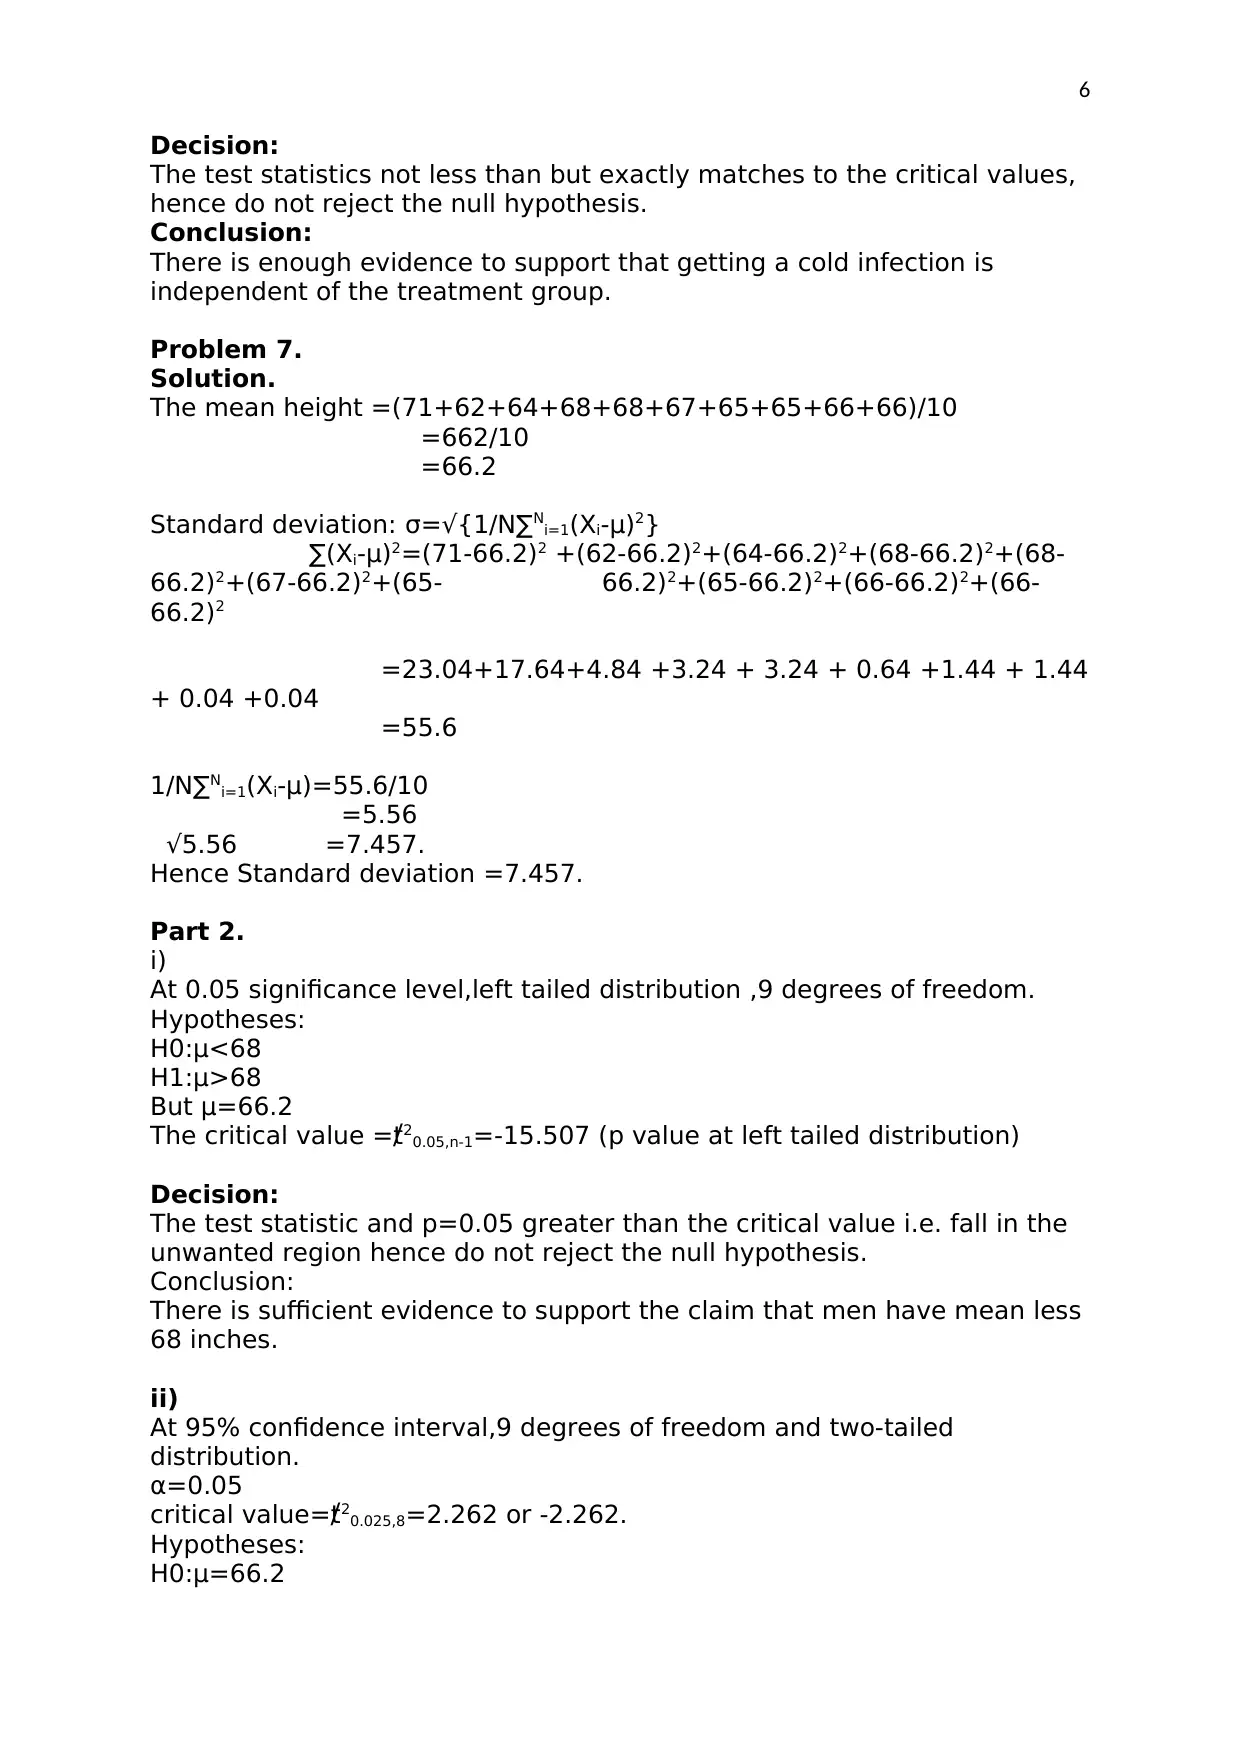
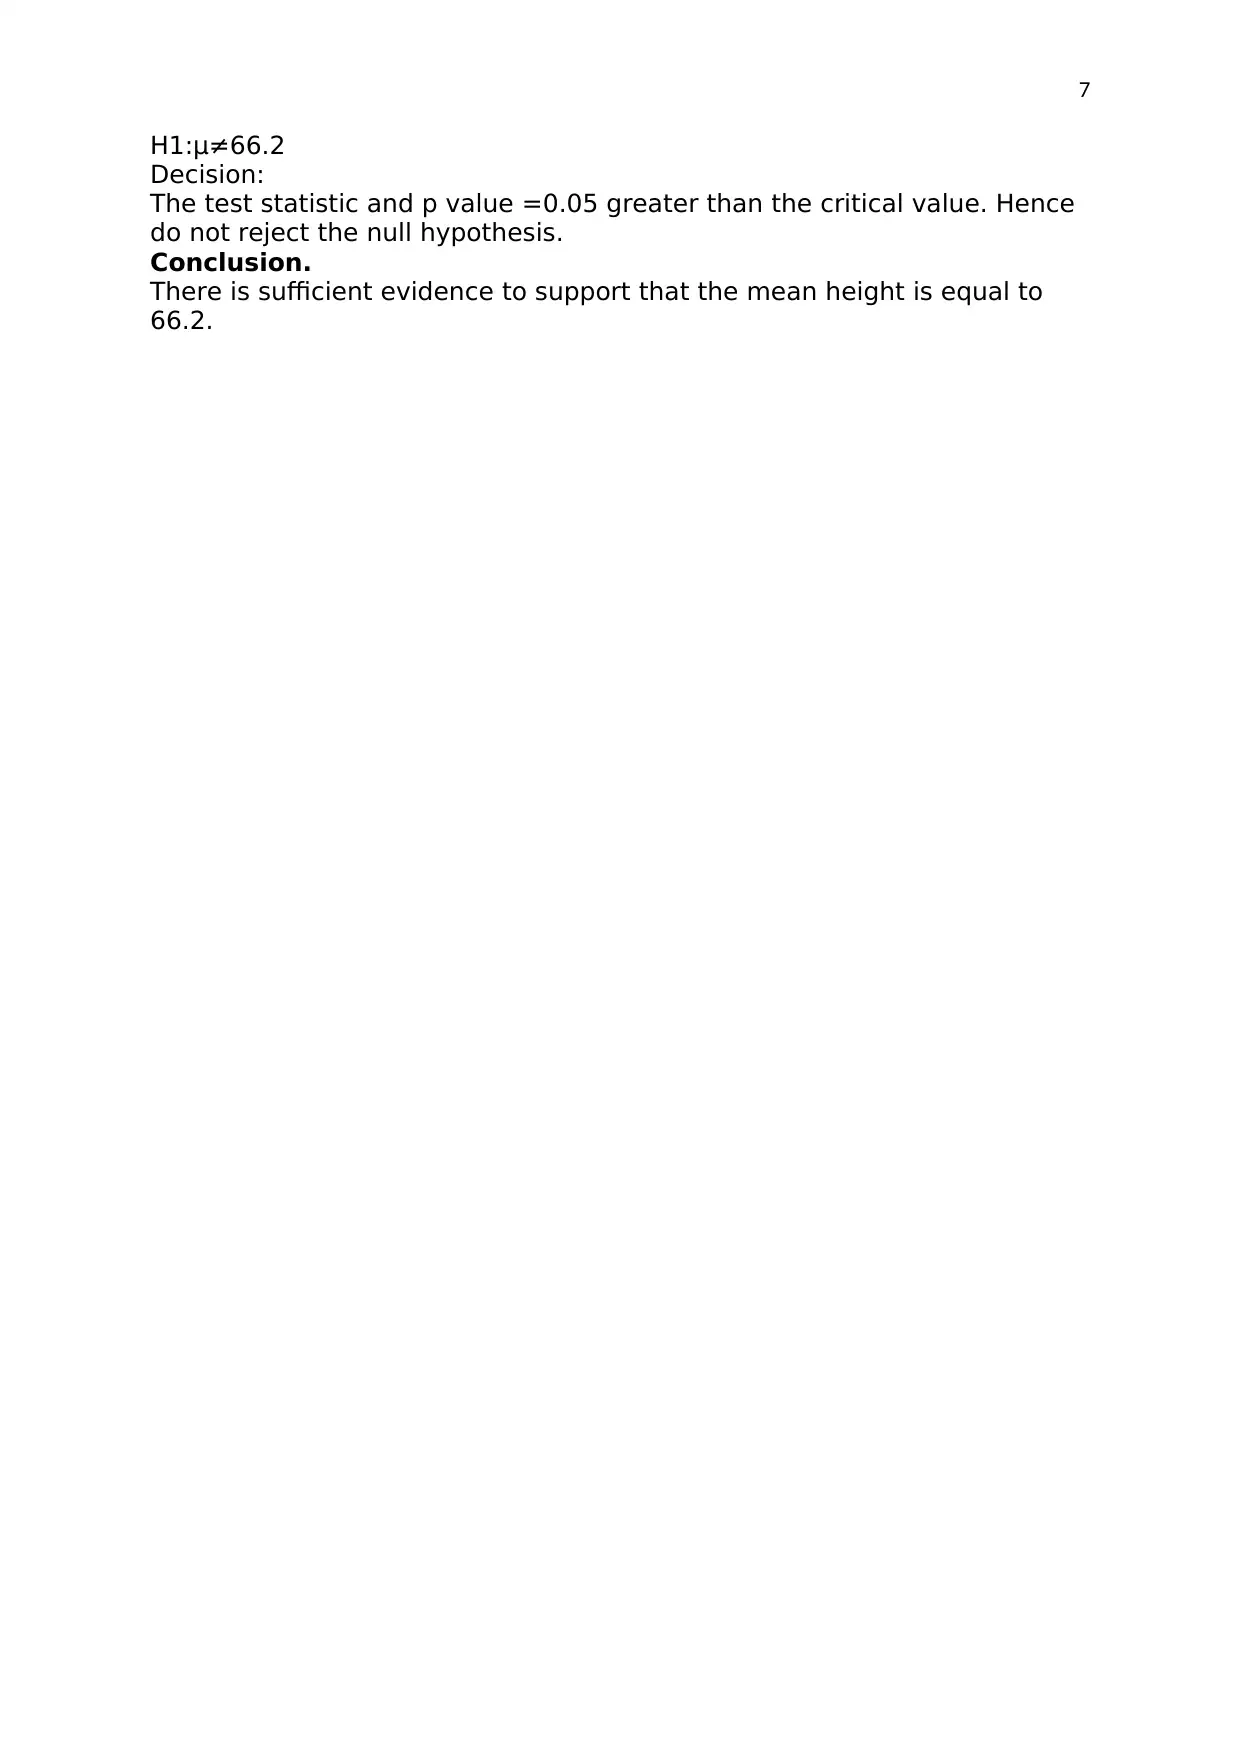
This document presents a comprehensive set of solutions to a statistics assignment, addressing various problems related to hypothesis testing, regression analysis, and confidence intervals. The solutions demonstrate the application of statistical concepts to real-world scenarios, including analyzing driver demographics, body temperatures, and cigarette tar content. The assignment covers topics such as calculating p-values, performing z-tests and t-tests, and constructing regression equations. Furthermore, the document includes chi-square tests for independence and the calculation of descriptive statistics like mean and standard deviation. The solutions are presented step-by-step, providing clear explanations and calculations for each problem, along with relevant references. The document provides detailed explanations, calculations, and conclusions for each problem, making it a valuable resource for students studying statistics.
tabler-icon-diamond-filled.svg

Contribute Materials

Your contribution can guide someone’s learning journey. Share your documents today.
Document Page
Statistical Analysis
Student’s Name:
University Affiliation:
tabler-icon-diamond-filled.svg

Secure Best Marks with AI Grader

Need help grading? Try our AI Grader for instant feedback on your assignments.
Document Page
2
Problem 1
Solution.
Given that
Ho: Null Hypothesis P≥0.05 (There are more female drivers than male
drivers)
Ha: Alternative Hypothesis (P<0.05 (There are fewer female drivers than
male drivers)
n=sample size is 900
p= sample of proportion is (468/900) = 0.52 which is the probability of
female drivers.
q=1-p=(1-0.52)=0.48
But SE= ( pq ) /¿ n ¿
¿ (0.520.48)/900=0.0167
Now determining the Test statistic:
Z= (0.52-0.5)/0.0167=1.200
From the table P(Z<1.200) = 0.8849
Therefore, P-Value= 1- 0.8849=0.1151
Since the P-value = 0.1151is greater than = 0.05, We fail to reject the
null hypothesis.
Conclusion
There is no enough evidence to reject the claim that there are more
female drivers in the USA than male drivers.
Problem 2.
Solution
Ho: Null Hypothesis: P=98.6
Ha: Alternative Hypothesis: >98.6
Given
n=100 x=98.6 , σ =0.6 , μ =98.6
Z=( xμ
s
n
)
Z=( 98.898.6
0.6
100
)
Z=3.333
Now from the table
P(z=3.3333)=0.9996
Therefore, P-value =0.9996
Since the P-Value=0.9996 is greater than = 0.05, we fail to reject the
claim that the mean body temperature of the population is equal to 98.6

Conclusion
There is no sufficient evidence to conclude that the common belief is
wrong.
Document Page
3
Problem 3
Solution
Ho: Null Hypothesis, Ho: μ<20
Ha: Alternative Hypothesis, Ha: μ>20
Given n=25, x=15, μ<20 σ ¿ 4, μ=20
t=( xμ
σ
n
)
t=(1520
4
25
)
t=¿-6.25
The critical value for left tail is -1.711
Computing Z statstics
Z=(xμ)/σ
Z=1520
4
Z=-1.25
The computed critical value (-1.711) is less than -1.25.
Conclusion
There is enough eveidence to support the claim that the mean tar content
of filtered 100 mm cigarettes is less than 20 mg, which is the mean for
unfiltered king size cigarettes
Problem 4
Solution
Given that
N’=2500
X’=15
Therefore, sample proportion of N’
=15/2500
=0.006
N=7500
X=15
Document Page
4
Sample proprtion N
=15/7500
=0.002
Now
Ho: The Null hypothesis: Ho:p1=p2
Ha: Alternative: Ha:p1>p2
Finding the pooled proportion
(p)=( x'+x
N'+N )
(P)= ( 15+15
2500+7500 ) = 30
10,000 =0.003
The test statistics is given to be z=3.17
Because it a right-tailed test,
Value value will be given as
P(Z>3.17)=1-p(z<3.17)
=1-0.9992
=0.0008 this is the p-value.
Conclusion
Because 0.0008 is less than 0.005, we can conclude that the null is
rejected.
There is enough evidence to support th claim that claim that the fatality
rate is higher for those not wearing seat belts.
Problem 5
Part a
Length (x) 40 64 65 49
47
Weight(y) 65 356 316 94
86
Solution.
x y xy x^2 y^2
40 65 2600 1600 4225
64 356 22784 4096 126736
65 316 20540 4225 99856
49 94 4606 2401 8836
tabler-icon-diamond-filled.svg

Secure Best Marks with AI Grader

Need help grading? Try our AI Grader for instant feedback on your assignments.
Document Page
5
47 86 4042 2209 7396
∑x=2
65
∑y=9
17
∑xy=54
572
∑x^2=14
531
∑y^2=247
049
r = n xy x y
( n ( x2 ) ¿ ( x2 ] [ n y2 )¿)¿ ¿
¿
n=5
r =5(54572)(265)(917)
¿ ¿ ¿
r= -0.000000344
part b
Regression equation of a regression line is given by:
Y=a+bX
Where;Y is the dependent or explanatory variable.
X is the independent variable.
a and b are the regression parameters. They are constants.
b ={nxy –(x)(y)}/nx2-(x)2
={5(54572)-(265)(917)}/5(14531)(265)2
=-0.000005851
a =y/n –b(x/n)
=183.4- 0.000005851(53)
=183.3997
Hence Y=183.3997+0.000005851X is the regression equation.
Part c
At x=72 inch; Y=183.3997 + 0.000005851(72)
=183.4001.
Problem 6.
Solution
There is a claim that getting a cold infection is independent of the
treatment group.
Assume alpha=0.05
Do you have sufficient evidence to reject or support the claim?
Hypotheses:
H0: Getting a cold infection is independent of the treatment group.
H1: Getting a cold is dependent of the treatment group.
The test statistic:
This is a right-tailed distribution.
20.05,0=3.841
20.05,1=5.991
20.05,2=7.815.
You notice that all the test statistics are equal to the respective critical
values.
Document Page
6
Decision:
The test statistics not less than but exactly matches to the critical values,
hence do not reject the null hypothesis.
Conclusion:
There is enough evidence to support that getting a cold infection is
independent of the treatment group.
Problem 7.
Solution.
The mean height =(71+62+64+68+68+67+65+65+66+66)/10
=662/10
=66.2
Standard deviation: σ=√{1/N∑Ni=1(Xi-μ)2}
∑(Xi-μ)2=(71-66.2)2 +(62-66.2)2+(64-66.2)2+(68-66.2)2+(68-
66.2)2+(67-66.2)2+(65- 66.2)2+(65-66.2)2+(66-66.2)2+(66-
66.2)2
=23.04+17.64+4.84 +3.24 + 3.24 + 0.64 +1.44 + 1.44
+ 0.04 +0.04
=55.6
1/N∑Ni=1(Xi-μ)=55.6/10
=5.56
√5.56 =7.457.
Hence Standard deviation =7.457.
Part 2.
i)
At 0.05 significance level,left tailed distribution ,9 degrees of freedom.
Hypotheses:
H0:μ<68
H1:μ>68
But μ=66.2
The critical value =ⱦ20.05,n-1=-15.507 (p value at left tailed distribution)
Decision:
The test statistic and p=0.05 greater than the critical value i.e. fall in the
unwanted region hence do not reject the null hypothesis.
Conclusion:
There is sufficient evidence to support the claim that men have mean less
68 inches.
ii)
At 95% confidence interval,9 degrees of freedom and two-tailed
distribution.
α=0.05
critical value=ⱦ20.025,8=2.262 or -2.262.
Hypotheses:
H0:μ=66.2
Document Page
7
H1:μ≠66.2
Decision:
The test statistic and p value =0.05 greater than the critical value. Hence
do not reject the null hypothesis.
Conclusion.
There is sufficient evidence to support that the mean height is equal to
66.2.
tabler-icon-diamond-filled.svg

Paraphrase This Document

Need a fresh take? Get an instant paraphrase of this document with our AI Paraphraser
Document Page
8
Reference
Hayes, A. F., & Scharkow, M. (2013). The relative trustworthiness of
inferential tests of the indirect effect in statistical mediation analysis:
Does method really matter?. Psychological science, 24(10), 1918-1927.
Alexopoulos, E. C. (2010). Introduction to multivariate regression
analysis. Hippokratia, 14(Suppl 1), 23.
Preacher, K. J., Curran, P. J., & Bauer, D. J. (2006). Computational tools for
probing interactions in multiple linear regression, multilevel modeling, and
latent curve analysis. Journal of educational and behavioral
statistics, 31(4), 437-448.
Everitt, B. S., & Dunn, G. (2001). Applied multivariate data analysis (Vol.
2). London: Arnold.
Hair, J. F. (2006). Multivariate data analysis. Pearson Education India.
chevron_up_icon
1 out of 8
circle_padding
hide_on_mobile
zoom_out_icon
logo.png

Your All-in-One AI-Powered Toolkit for Academic Success.

Available 24*7 on WhatsApp / Email

[object Object]