Statistical Analysis of Startup Costs (Module Name, Semester 1, 2024)

Verified

Added on  2020/03/23

|10
|339
|43
Report
AI Summary
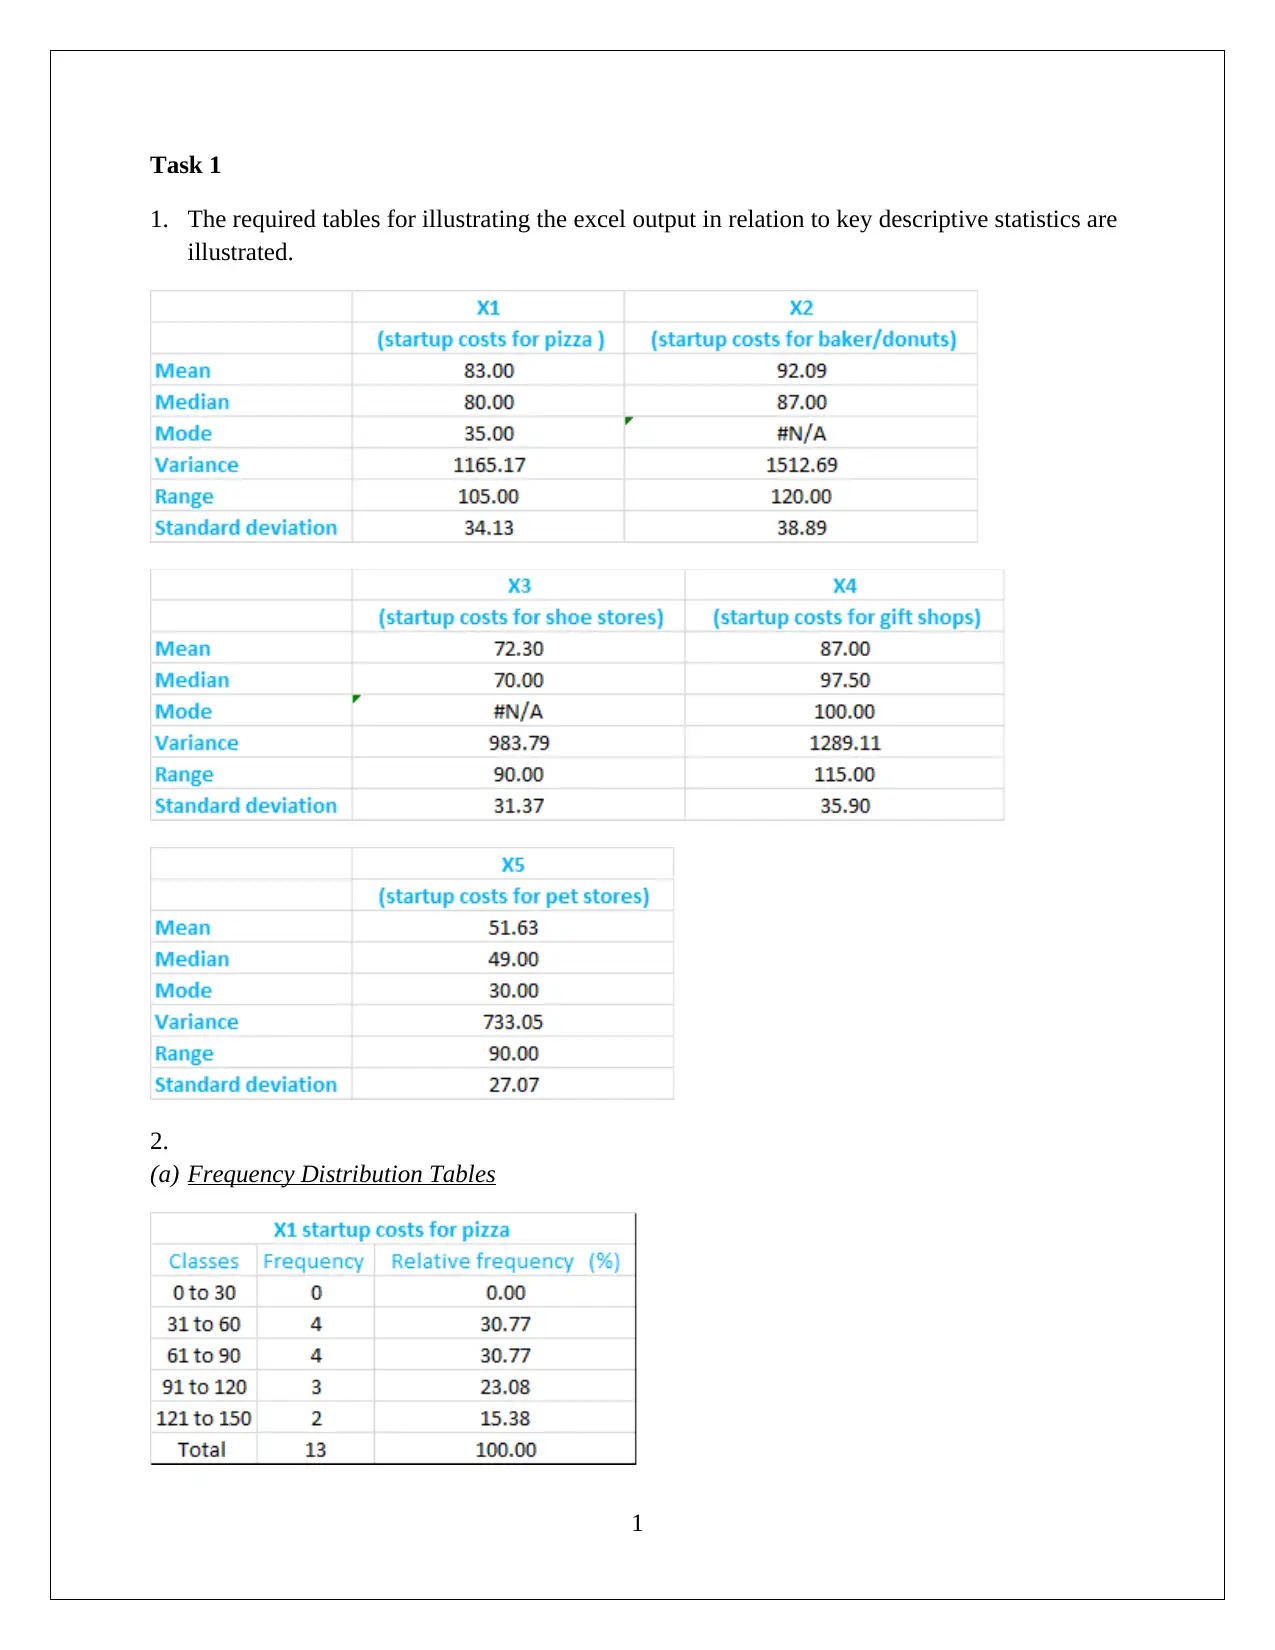
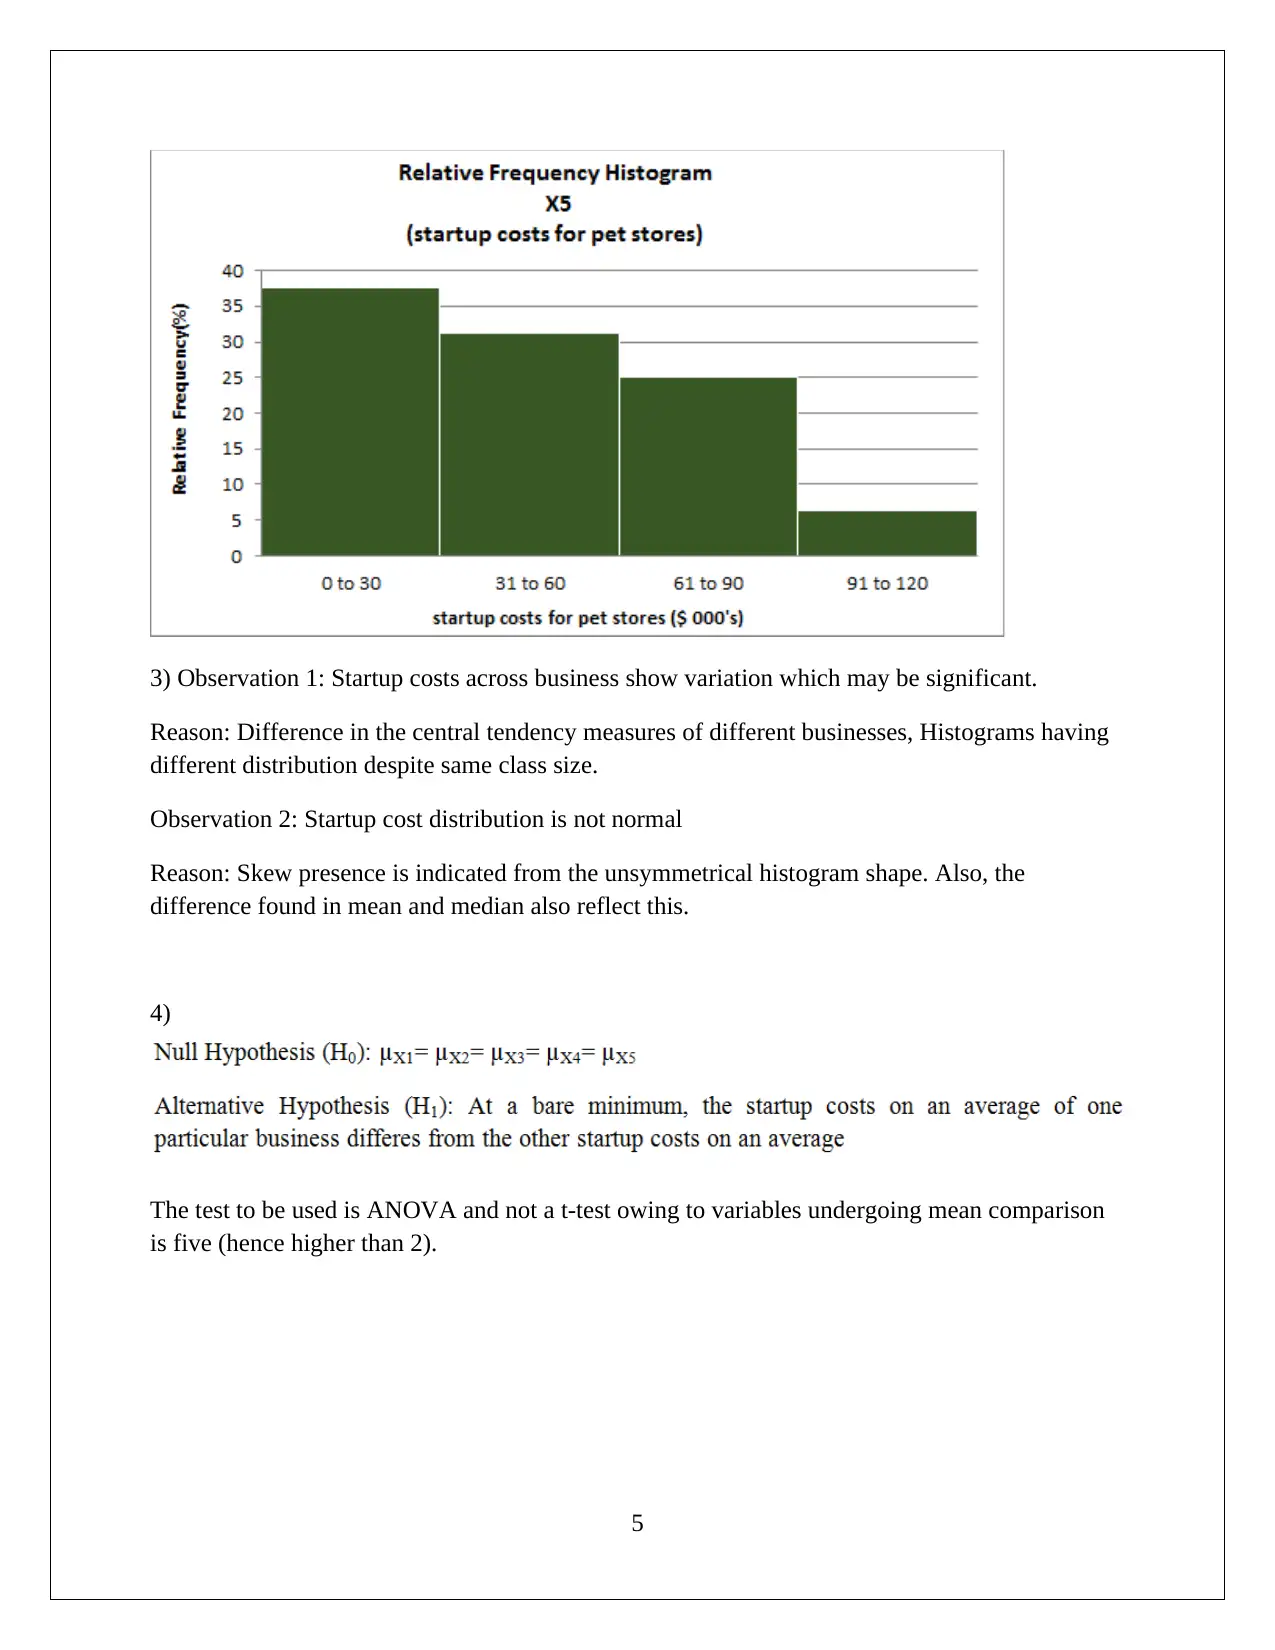
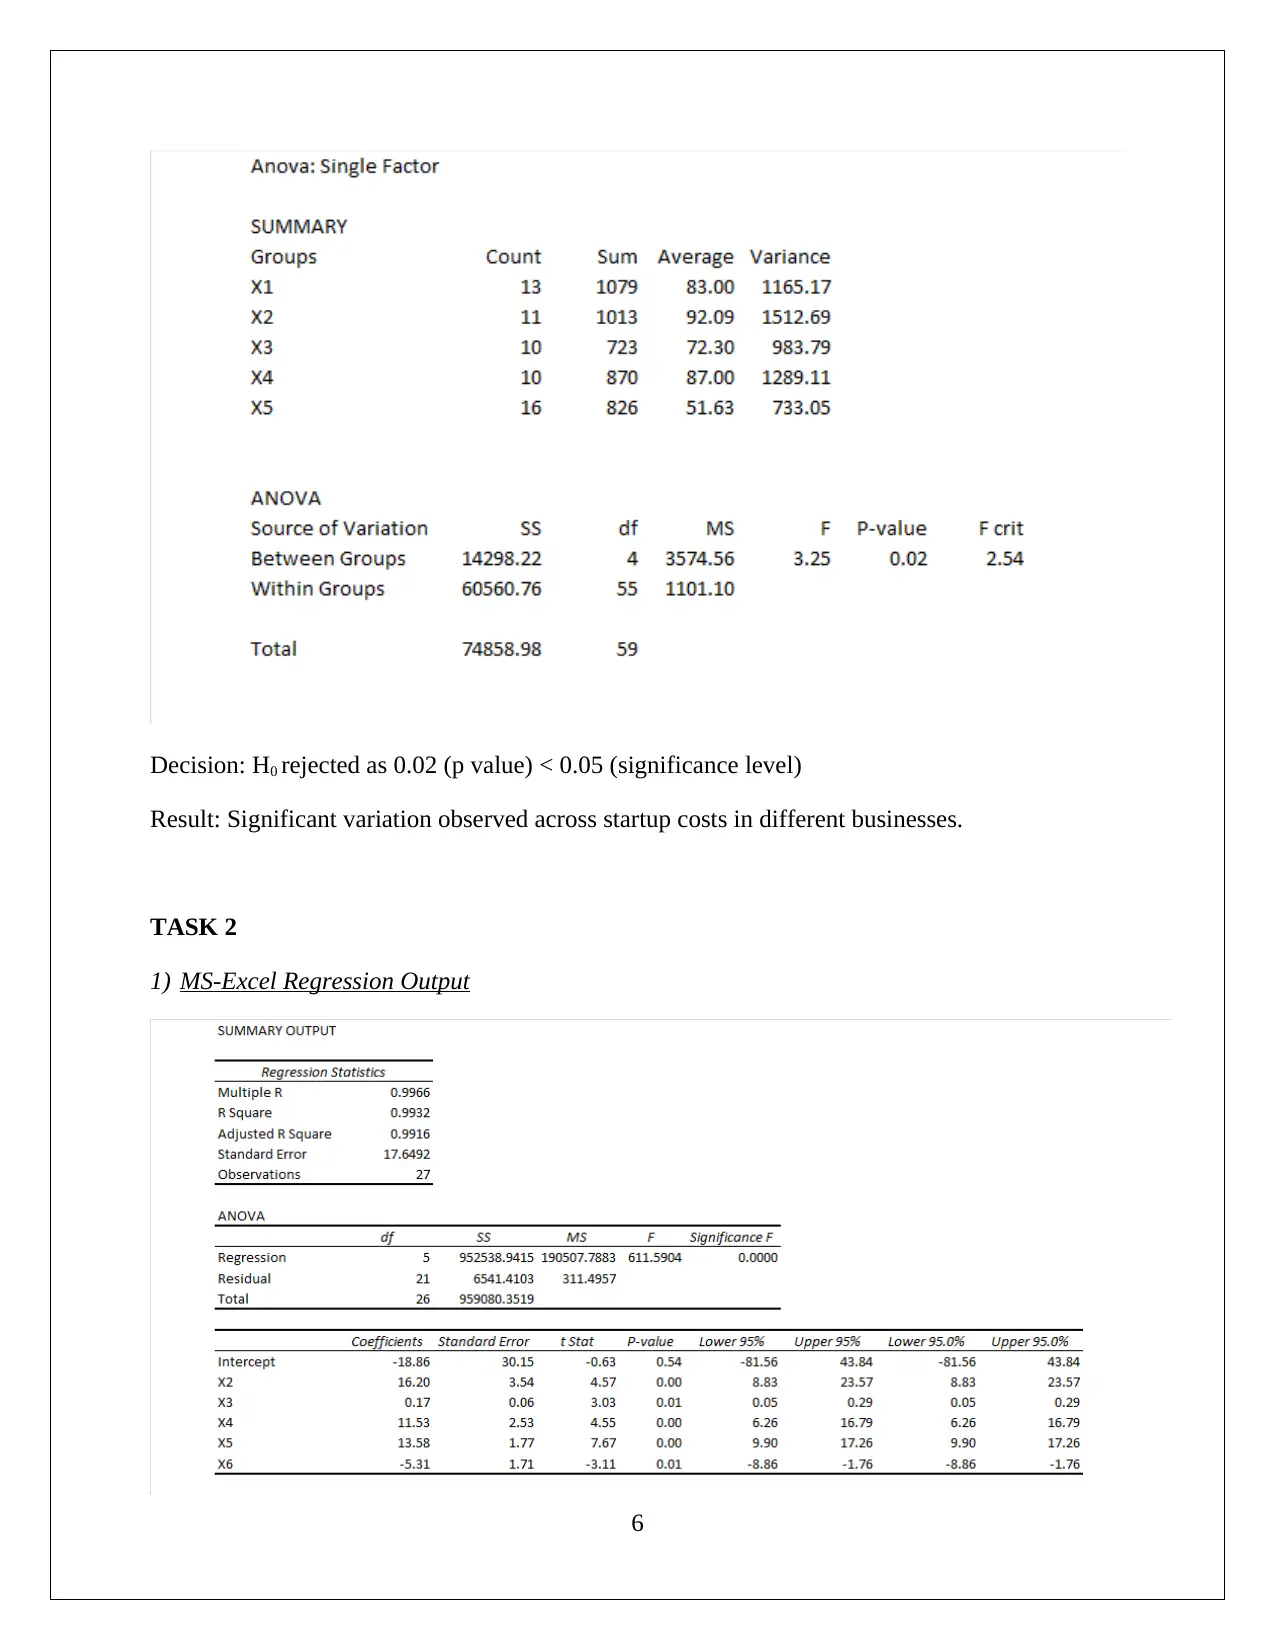
This report presents a statistical analysis of startup costs, including the use of statistical methods such as ANOVA and regression analysis. The report includes the analysis of the data using statistical methods such as ANOVA and regression. This is done by analyzing the data using Microsoft Excel. The report also highlights the significance of different statistical parameters such as the p-values and R-squared value. The report further discusses the interpretation of the statistical results, including the significance of each variable and how the results can be used to make business decisions. It covers the application of statistical techniques to analyze the data and draw conclusions. This report is helpful for students to understand the practical application of statistics and gain insight into how statistical tools can be used to solve business problems. The report includes a discussion of the methods used, the results, and the conclusions. The report uses a variety of statistical methods, including descriptive statistics, regression analysis, and hypothesis testing. The report also includes a discussion of the limitations of the study and suggestions for future research. The report concludes with a summary of the findings and recommendations for future research. The report is designed to assist students in understanding the concepts of statistical analysis and its applications.
Document Page
STATISTICS
HI6007
[Pick the date]
Student id
tabler-icon-diamond-filled.svg

Paraphrase This Document

Need a fresh take? Get an instant paraphrase of this document with our AI Paraphraser
Document Page
Task 1
1. The required tables for illustrating the excel output in relation to key descriptive statistics are
illustrated.
2.
(a) Frequency Distribution Tables
1
Document Page
(b) Histograms (Frequency Distribution Data)
2
Document Page
3
tabler-icon-diamond-filled.svg

Paraphrase This Document

Need a fresh take? Get an instant paraphrase of this document with our AI Paraphraser
Document Page
4
Document Page
3) Observation 1: Startup costs across business show variation which may be significant.
Reason: Difference in the central tendency measures of different businesses, Histograms having
different distribution despite same class size.
Observation 2: Startup cost distribution is not normal
Reason: Skew presence is indicated from the unsymmetrical histogram shape. Also, the
difference found in mean and median also reflect this.
4)
The test to be used is ANOVA and not a t-test owing to variables undergoing mean comparison
is five (hence higher than 2).
5
Document Page
Decision: H0 rejected as 0.02 (p value) < 0.05 (significance level)
Result: Significant variation observed across startup costs in different businesses.
TASK 2
1) MS-Excel Regression Output
6
tabler-icon-diamond-filled.svg

Paraphrase This Document

Need a fresh take? Get an instant paraphrase of this document with our AI Paraphraser
Document Page
Regression Equation
2) Objective : To comment on fit
Indicator to be used: Coefficient of Determination or R2
Observation: R2 = 0.9932
Conclusion: The model is a good fit considering high predictive power of the regression model.
3)
EXCEL OUTPUT
Observation: Significance Level (0.05) > Significance F(0.0000)
Decision: Rejection of H0
Conclusion: Model is significance as there exists a significant slope which is non-zero.
4) Interpretation Table
5) Table for highlighting confidence interval
7
Document Page
6)
The p values for the individual variable slope are estimated from the output highlighted below.
Observation: Significance Level > P value for all predictors
Result: Rejection of H0 for every predictor
Conclusion: The significance of slope of each of the predictor (independent) variables is
established.
7) Owing to significance testing of the various predictors above, no alternation in the model is
recommended considering the fact that all variables have a significant slope.
8) The relevant computations are as follows.
8
Document Page
9
chevron_up_icon
1 out of 10
circle_padding
hide_on_mobile
zoom_out_icon
[object Object]