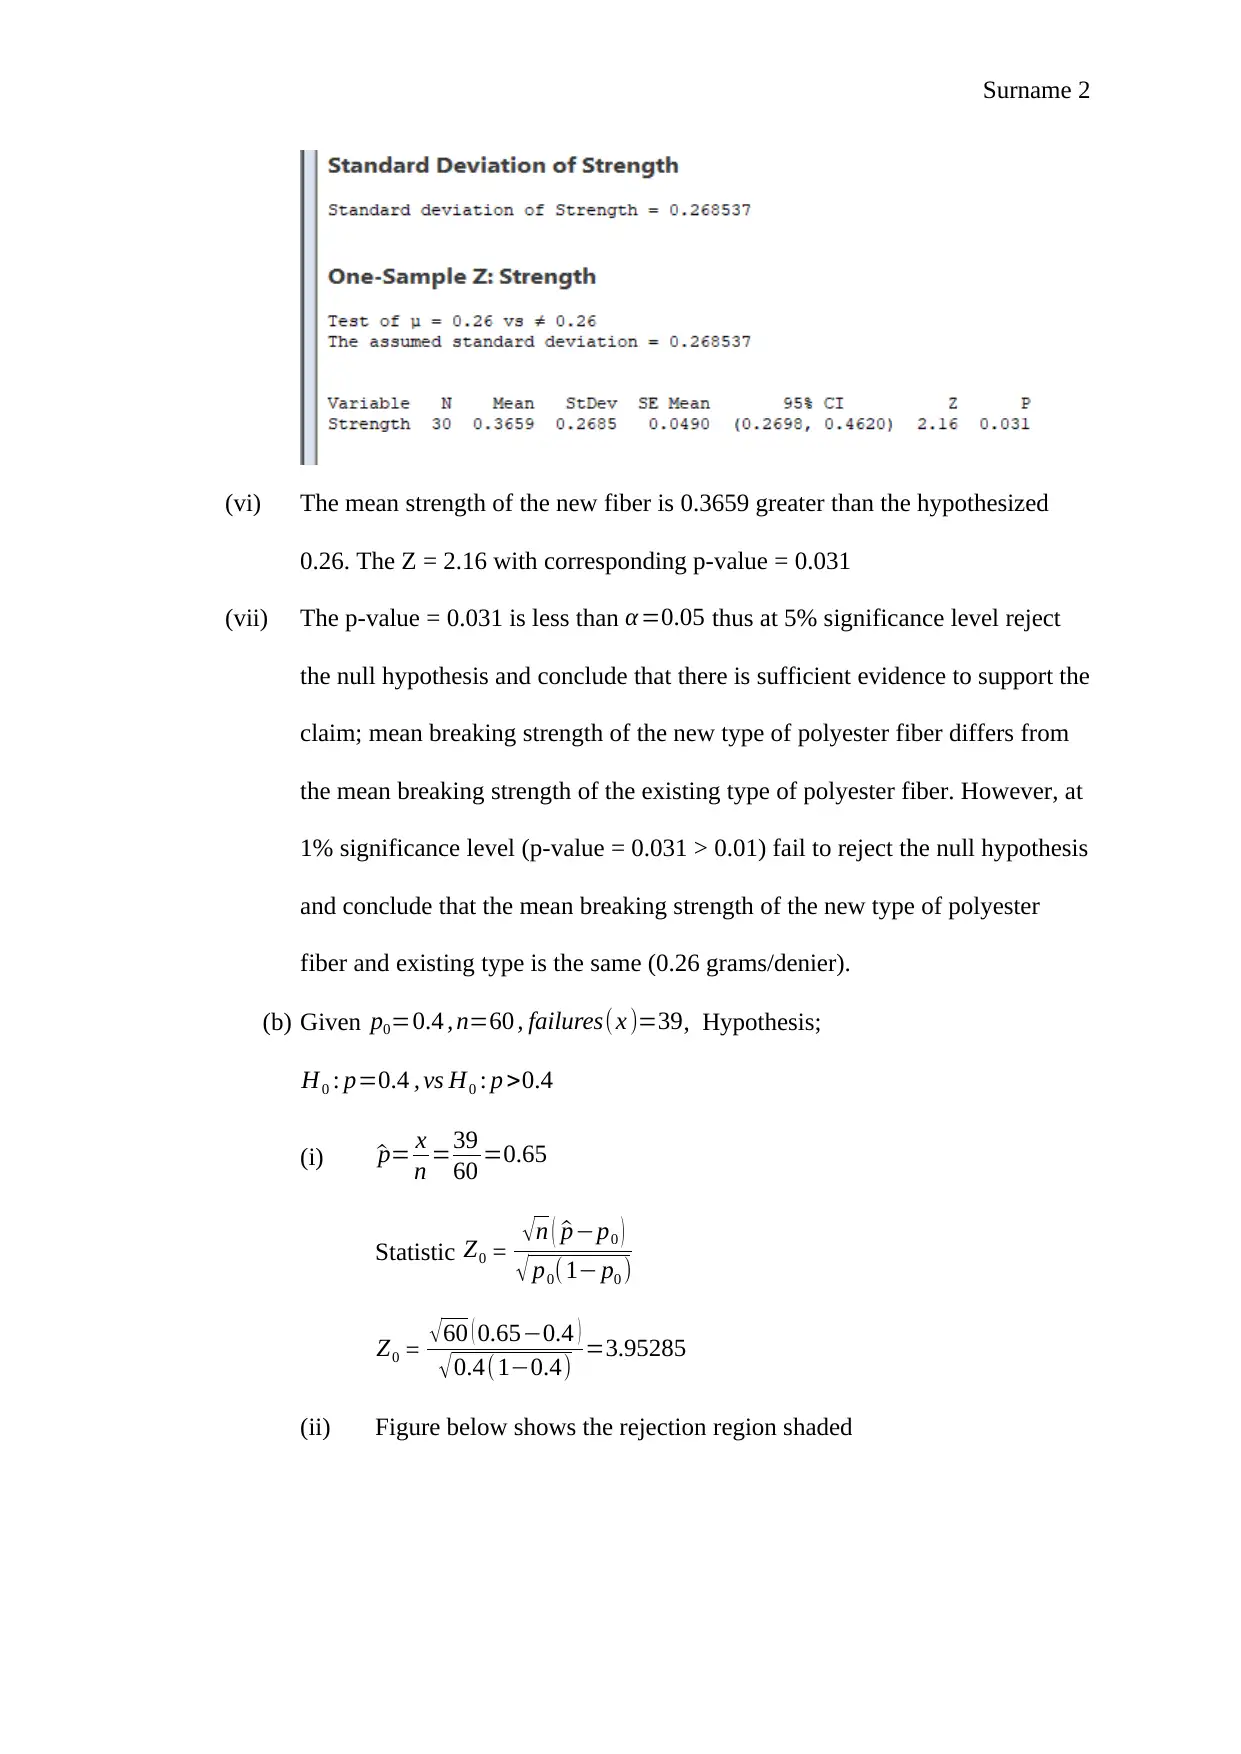
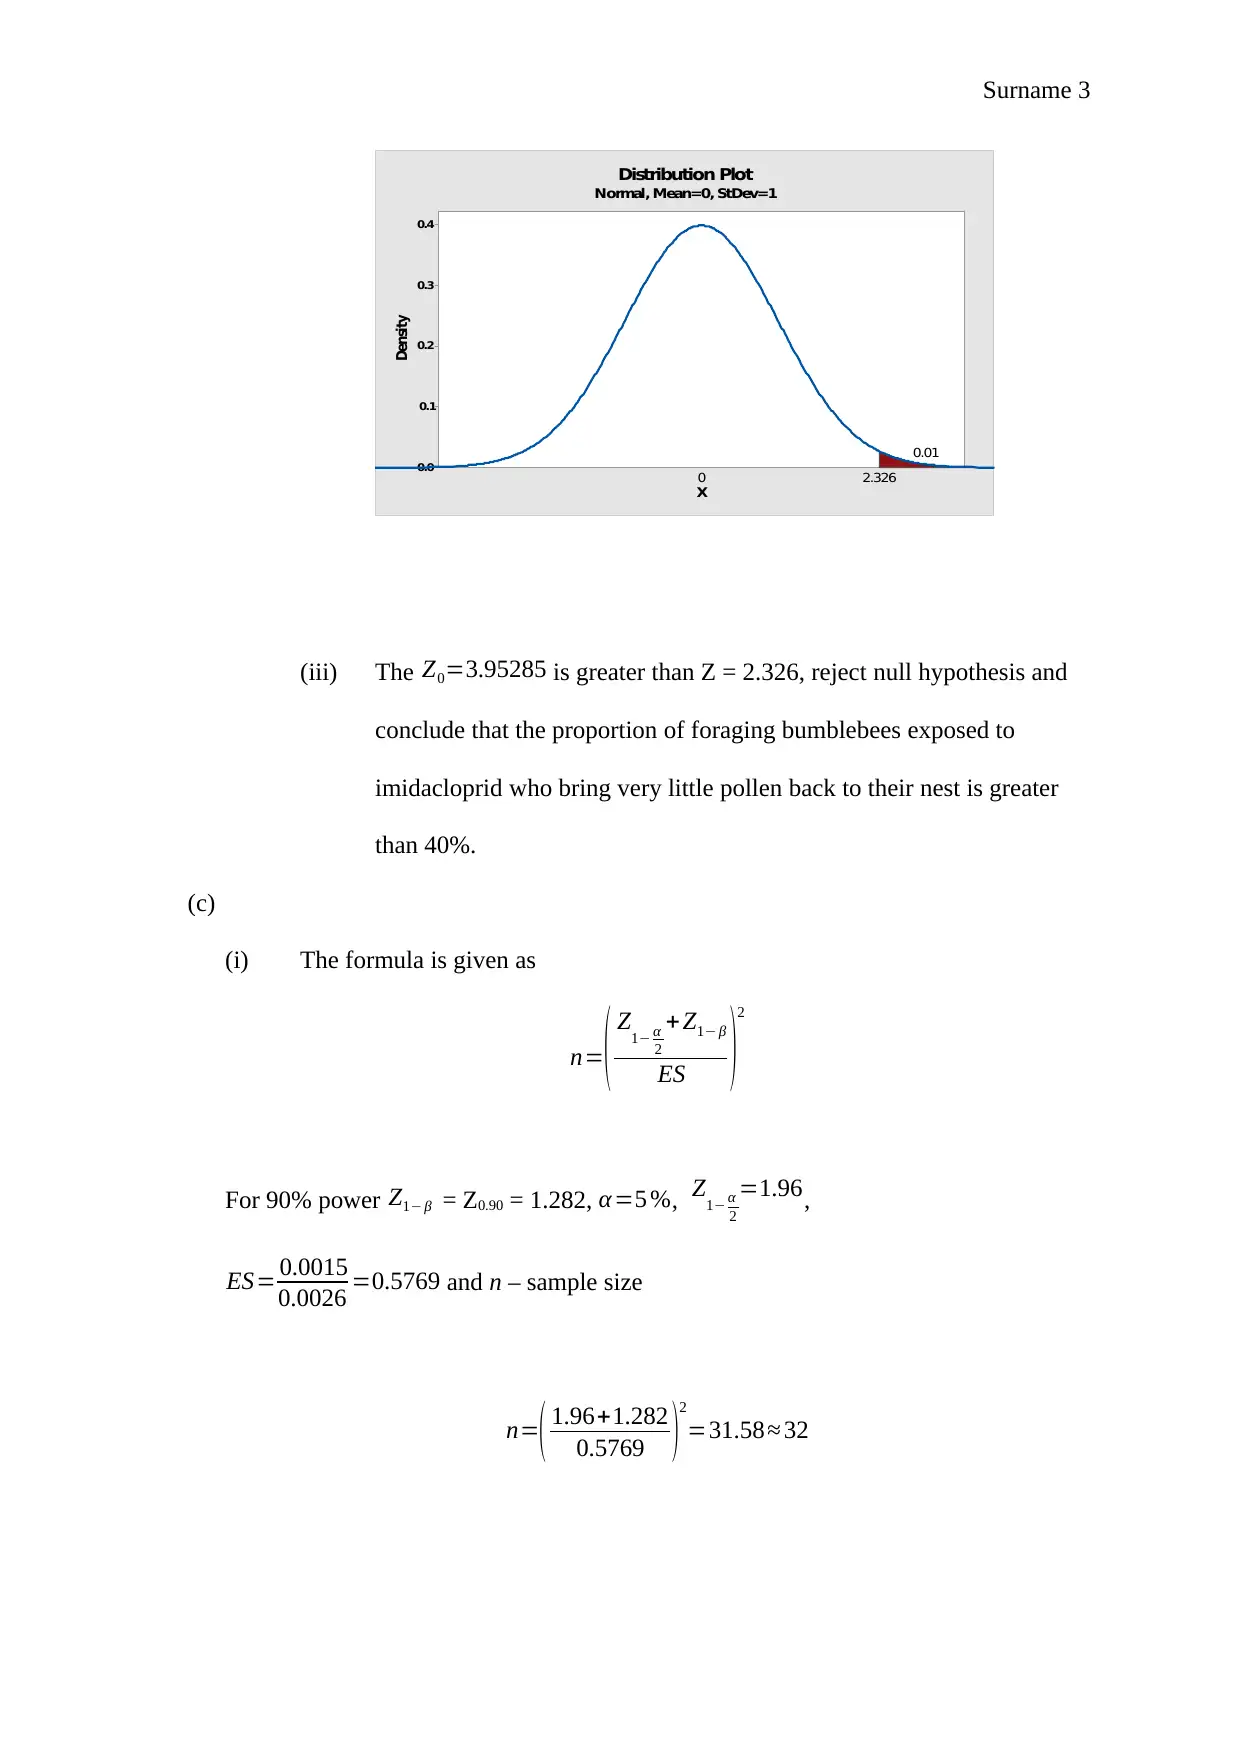
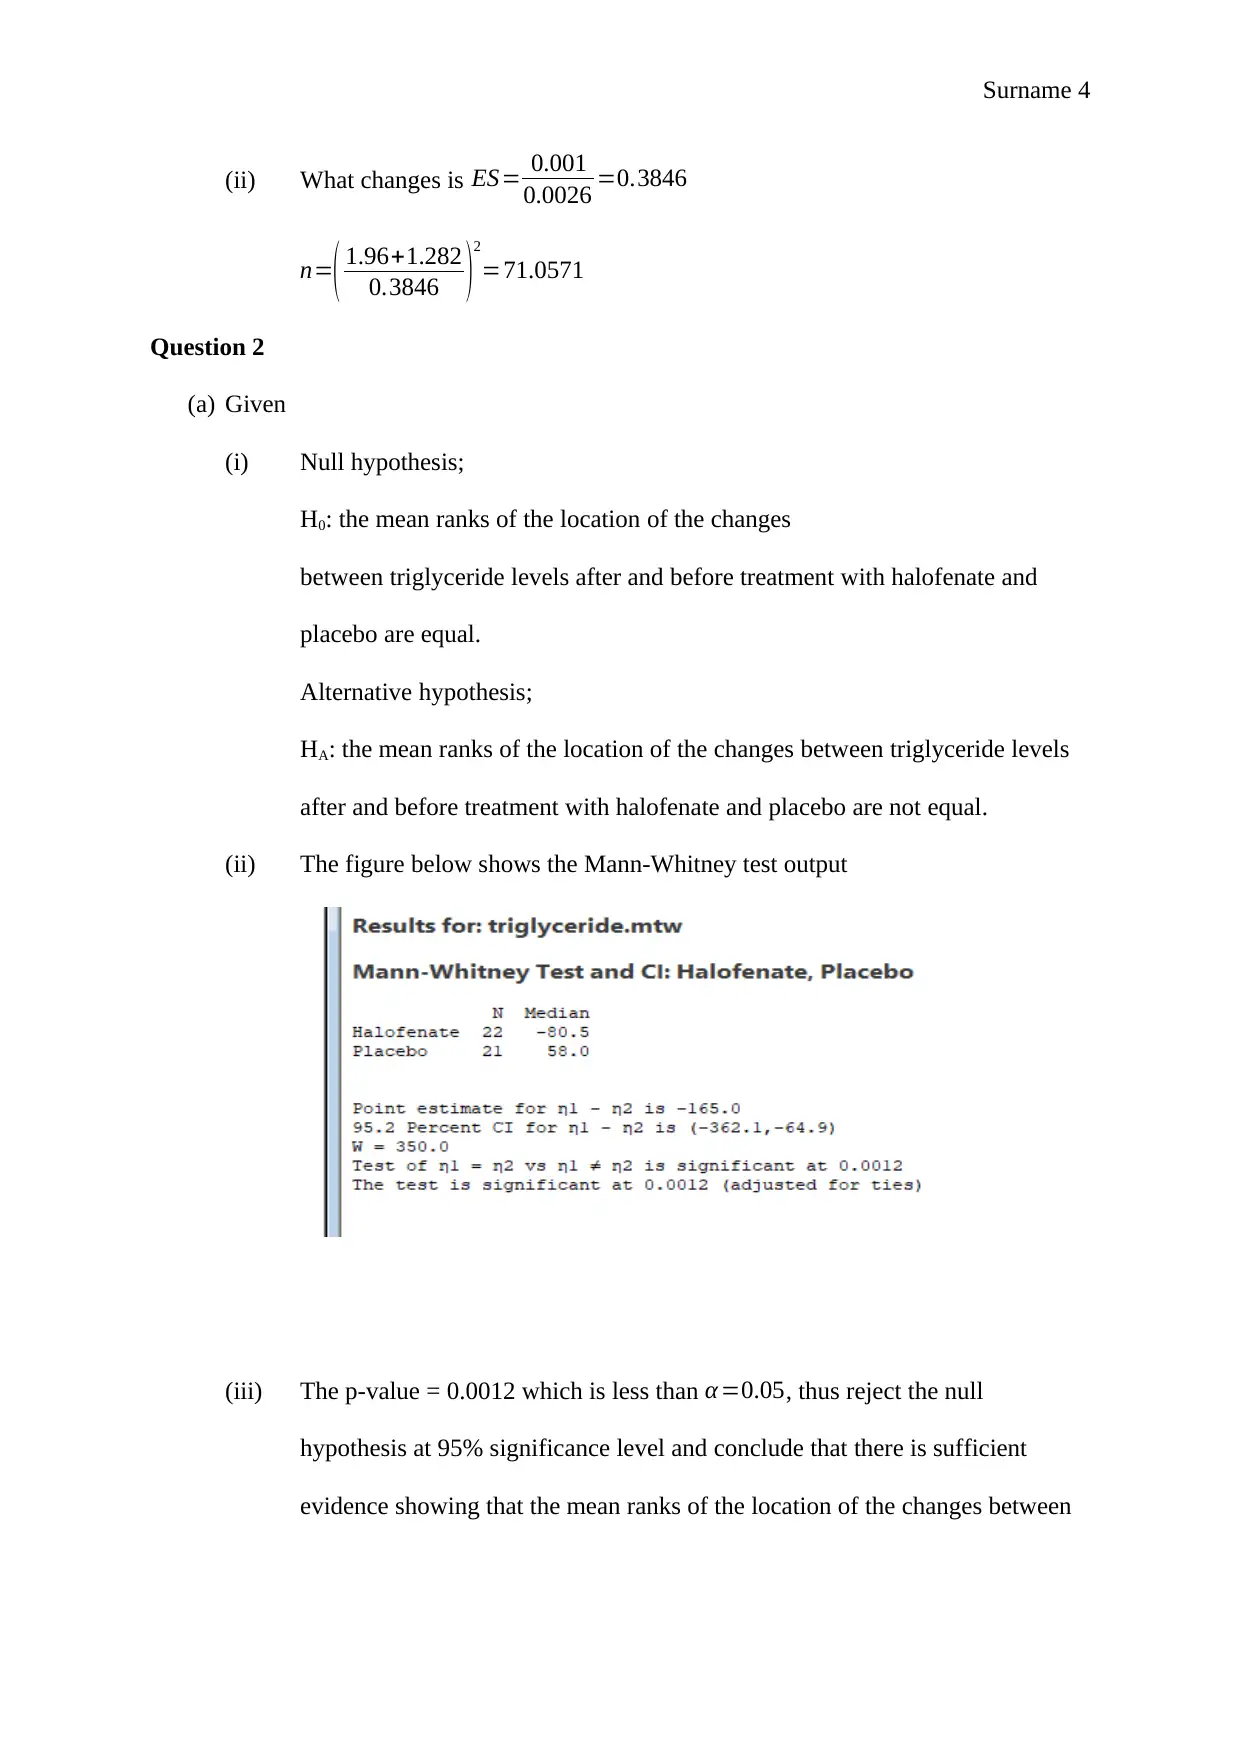
Open University M248 TMA 05: Statistical Analysis and Interpretation

Verified

Added on  2023/04/19

|5
|839
|152
Homework Assignment
AI Summary
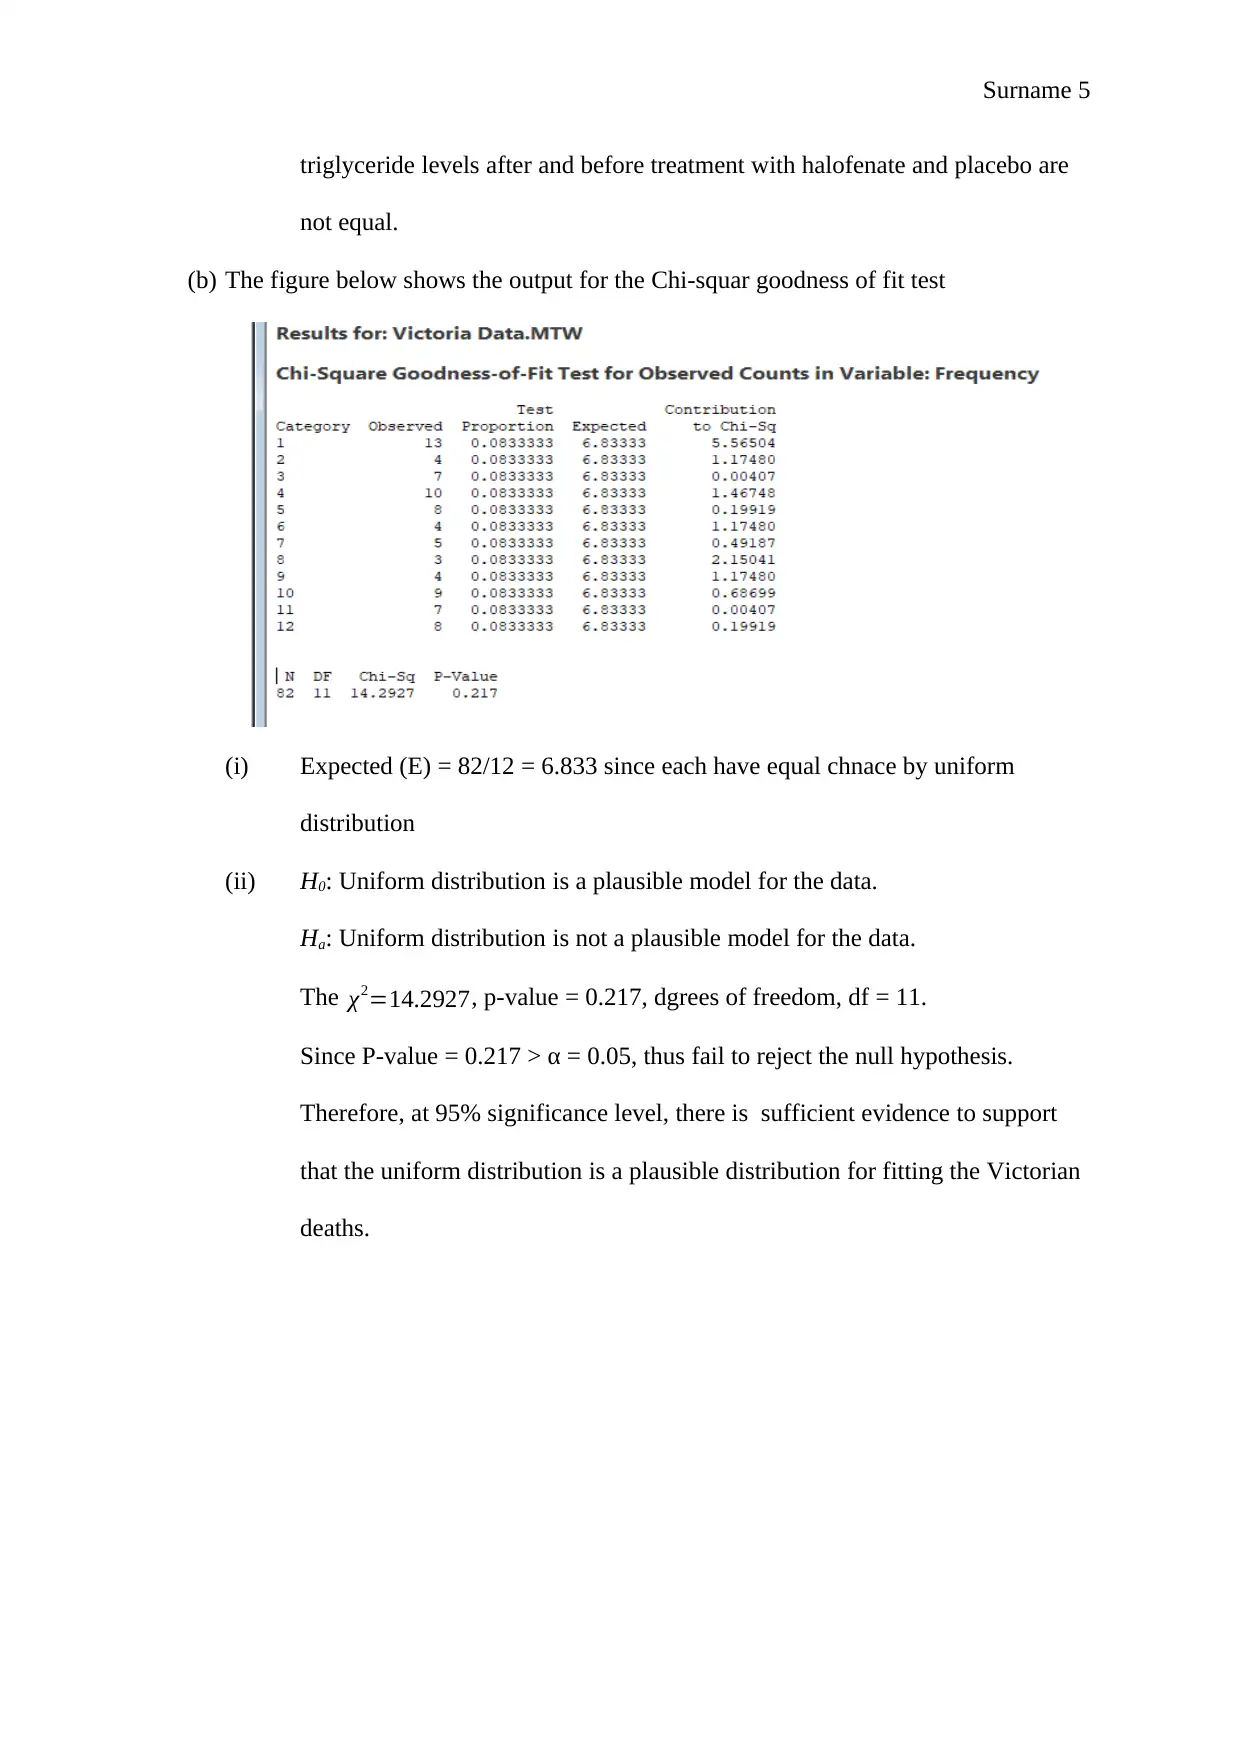
This document presents a comprehensive solution to the M248 TMA 05 assignment, focusing on statistical analysis techniques. The solution addresses two main questions. Question 1 explores hypothesis testing using z-tests, calculating p-values, and interpreting results in the context of fiber strength and bumblebee foraging. It also includes a sample size calculation. Question 2 delves into non-parametric tests, specifically the Mann-Whitney test for comparing triglyceride levels and the Chi-square goodness-of-fit test for analyzing Victorian deaths. The solution provides detailed steps, interpretations of statistical outputs, and conclusions based on significance levels, providing a thorough understanding of the statistical methods applied and the interpretation of the results. The assignment covers hypothesis testing, statistical tests, p-values, and interpretation of the results.
tabler-icon-diamond-filled.svg

Contribute Materials

Your contribution can guide someone’s learning journey. Share your documents today.
Document Page
Surname 1
Student’s Name
Professor’s Name
Course
Date
TMA 05
Question 1
(a)
(i) Null hypothesis (H0 ¿: μ = 0.26 (the mean breaking strength of the new type of
polyester fiber and existing type is the same).
Alternative hypothesis ( Ha ¿: μ ≠ 0.26 (the mean breaking strength of the new
type of polyester fiber differs from the mean breaking strength of the existing
type of polyester fiber.
(ii) The sample size = 30 (sufficiently large sample). Also, the normality
assumption is met since the Shapiro Wilk = 0.972 with p-value > 0.05.
(iii) Hypothesis and significance levels α=0.05
Statistic: z = n ( xμ )
s
Where: x – sample mean, s – sample standard deviation
(iv) Z ~ N (0, 1),
f ( z ) = 1
2 π e
1
2 z2
, R
Null distribution is the probability distribution of the test statistic when
the null hypothesis is true. The term null is used to take care of the fact that
true distribution is often unknown and thus the distribution used is a guess.
(v) The figure below shows the output
tabler-icon-diamond-filled.svg

Secure Best Marks with AI Grader

Need help grading? Try our AI Grader for instant feedback on your assignments.
Document Page
Surname 2
(vi) The mean strength of the new fiber is 0.3659 greater than the hypothesized
0.26. The Z = 2.16 with corresponding p-value = 0.031
(vii) The p-value = 0.031 is less than α=0.05 thus at 5% significance level reject
the null hypothesis and conclude that there is sufficient evidence to support the
claim; mean breaking strength of the new type of polyester fiber differs from
the mean breaking strength of the existing type of polyester fiber. However, at
1% significance level (p-value = 0.031 > 0.01) fail to reject the null hypothesis
and conclude that the mean breaking strength of the new type of polyester
fiber and existing type is the same (0.26 grams/denier).
(b) Given p0=0.4 , n=60 , failures( x )=39, Hypothesis;
H0 : p=0.4 , vs H0 : p >0.4
(i) ^p= x
n =39
60 =0.65
Statistic Z0 = n ( ^pp0 )
p0( 1 p0 )
Z0 = 60 ( 0.650.4 )
0.4(10.4) =3.95285
(ii) Figure below shows the rejection region shaded
Document Page
Surname 3
0.4
0.3
0.2
0.1
0.0
X
Density
2.326
0.01
0
Distribution Plot
Normal, Mean=0, StDev=1
(iii) The Z0=3.95285 is greater than Z = 2.326, reject null hypothesis and
conclude that the proportion of foraging bumblebees exposed to
imidacloprid who bring very little pollen back to their nest is greater
than 40%.
(c)
(i) The formula is given as
n=( Z1 α
2
+ Z1 β
ES )2
For 90% power Z1 β = Z0.90 = 1.282, α =5 %, Z1 α
2
=1.96,
ES= 0.0015
0.0026 =0.5769 and n – sample size
n=( 1.96+1.282
0.5769 )
2
=31.58 32
Document Page
Surname 4
(ii) What changes is ES= 0.001
0.0026 =0.3846
n=( 1.96+1.282
0.3846 )
2
=71.0571
Question 2
(a) Given
(i) Null hypothesis;
H0: the mean ranks of the location of the changes
between triglyceride levels after and before treatment with halofenate and
placebo are equal.
Alternative hypothesis;
HA: the mean ranks of the location of the changes between triglyceride levels
after and before treatment with halofenate and placebo are not equal.
(ii) The figure below shows the Mann-Whitney test output
(iii) The p-value = 0.0012 which is less than α=0.05, thus reject the null
hypothesis at 95% significance level and conclude that there is sufficient
evidence showing that the mean ranks of the location of the changes between
tabler-icon-diamond-filled.svg

Secure Best Marks with AI Grader

Need help grading? Try our AI Grader for instant feedback on your assignments.
Document Page
Surname 5
triglyceride levels after and before treatment with halofenate and placebo are
not equal.
(b) The figure below shows the output for the Chi-squar goodness of fit test
(i) Expected (E) = 82/12 = 6.833 since each have equal chnace by uniform
distribution
(ii) H0: Uniform distribution is a plausible model for the data.
Ha: Uniform distribution is not a plausible model for the data.
The χ2=14.2927, p-value = 0.217, dgrees of freedom, df = 11.
Since P-value = 0.217 > α = 0.05, thus fail to reject the null hypothesis.
Therefore, at 95% significance level, there is sufficient evidence to support
that the uniform distribution is a plausible distribution for fitting the Victorian
deaths.
chevron_up_icon
1 out of 5
circle_padding
hide_on_mobile
zoom_out_icon
logo.png

Your All-in-One AI-Powered Toolkit for Academic Success.

Available 24*7 on WhatsApp / Email

[object Object]