W2 Assignment: Analysis of Student Data - Statistical Project

Verified

Added on  2022/12/26

|6
|326
|95
Project
AI Summary
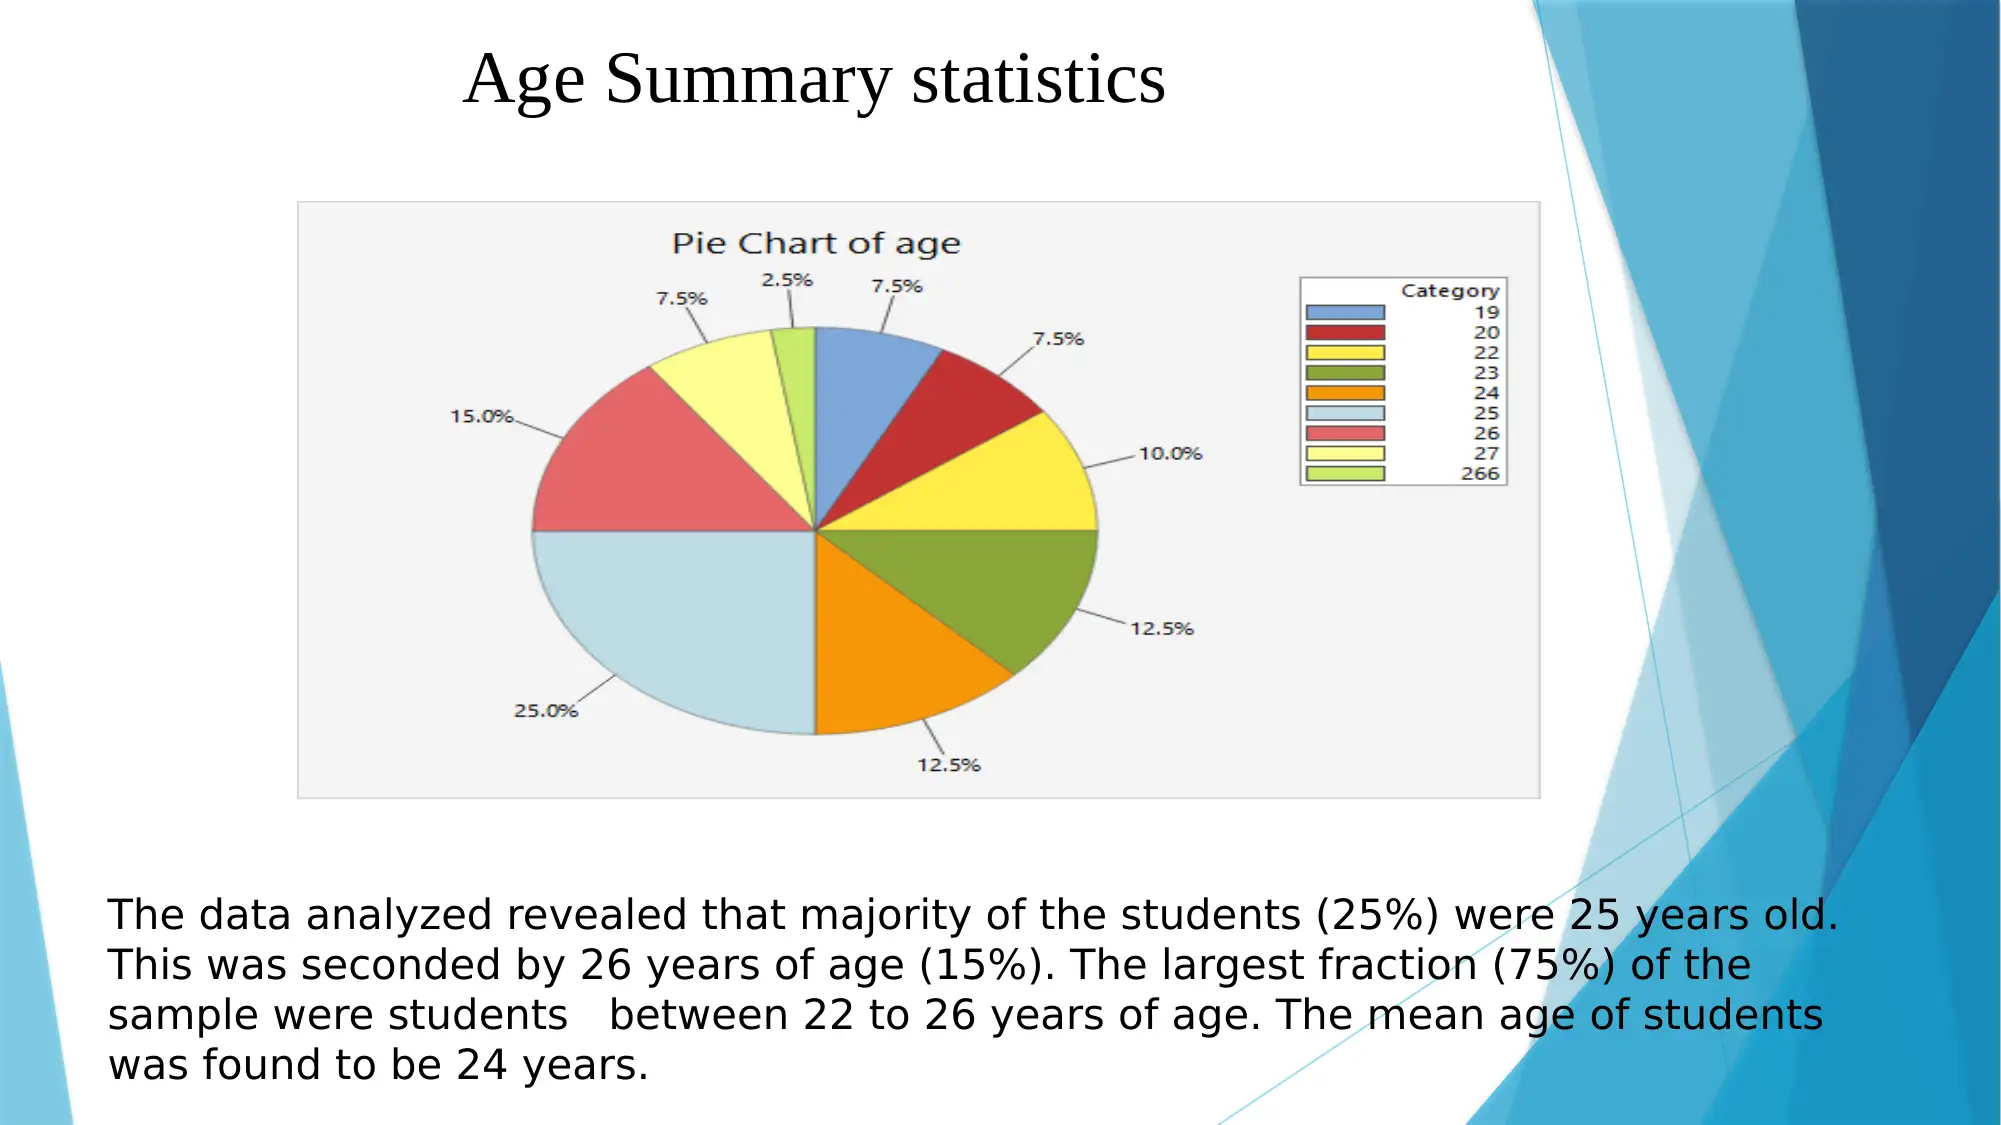
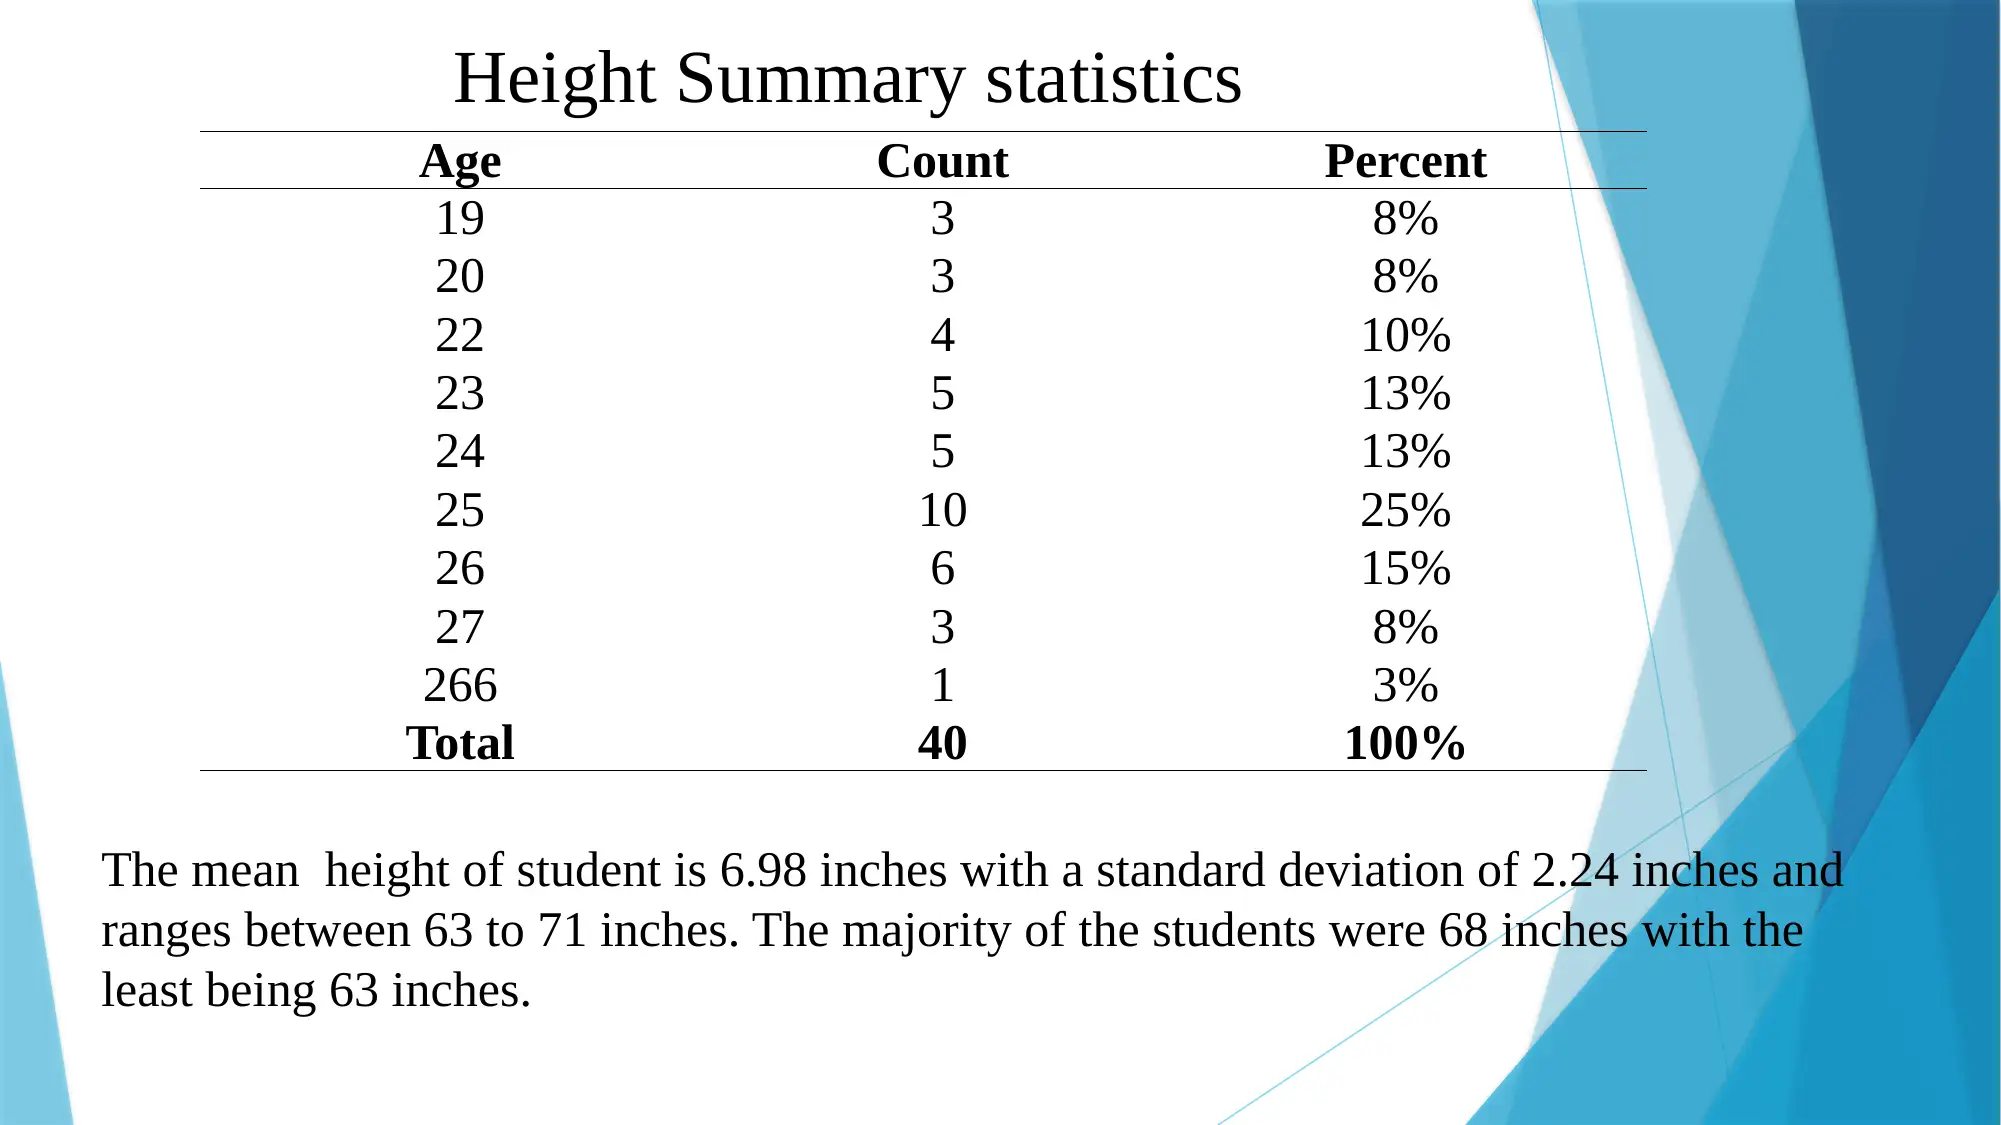
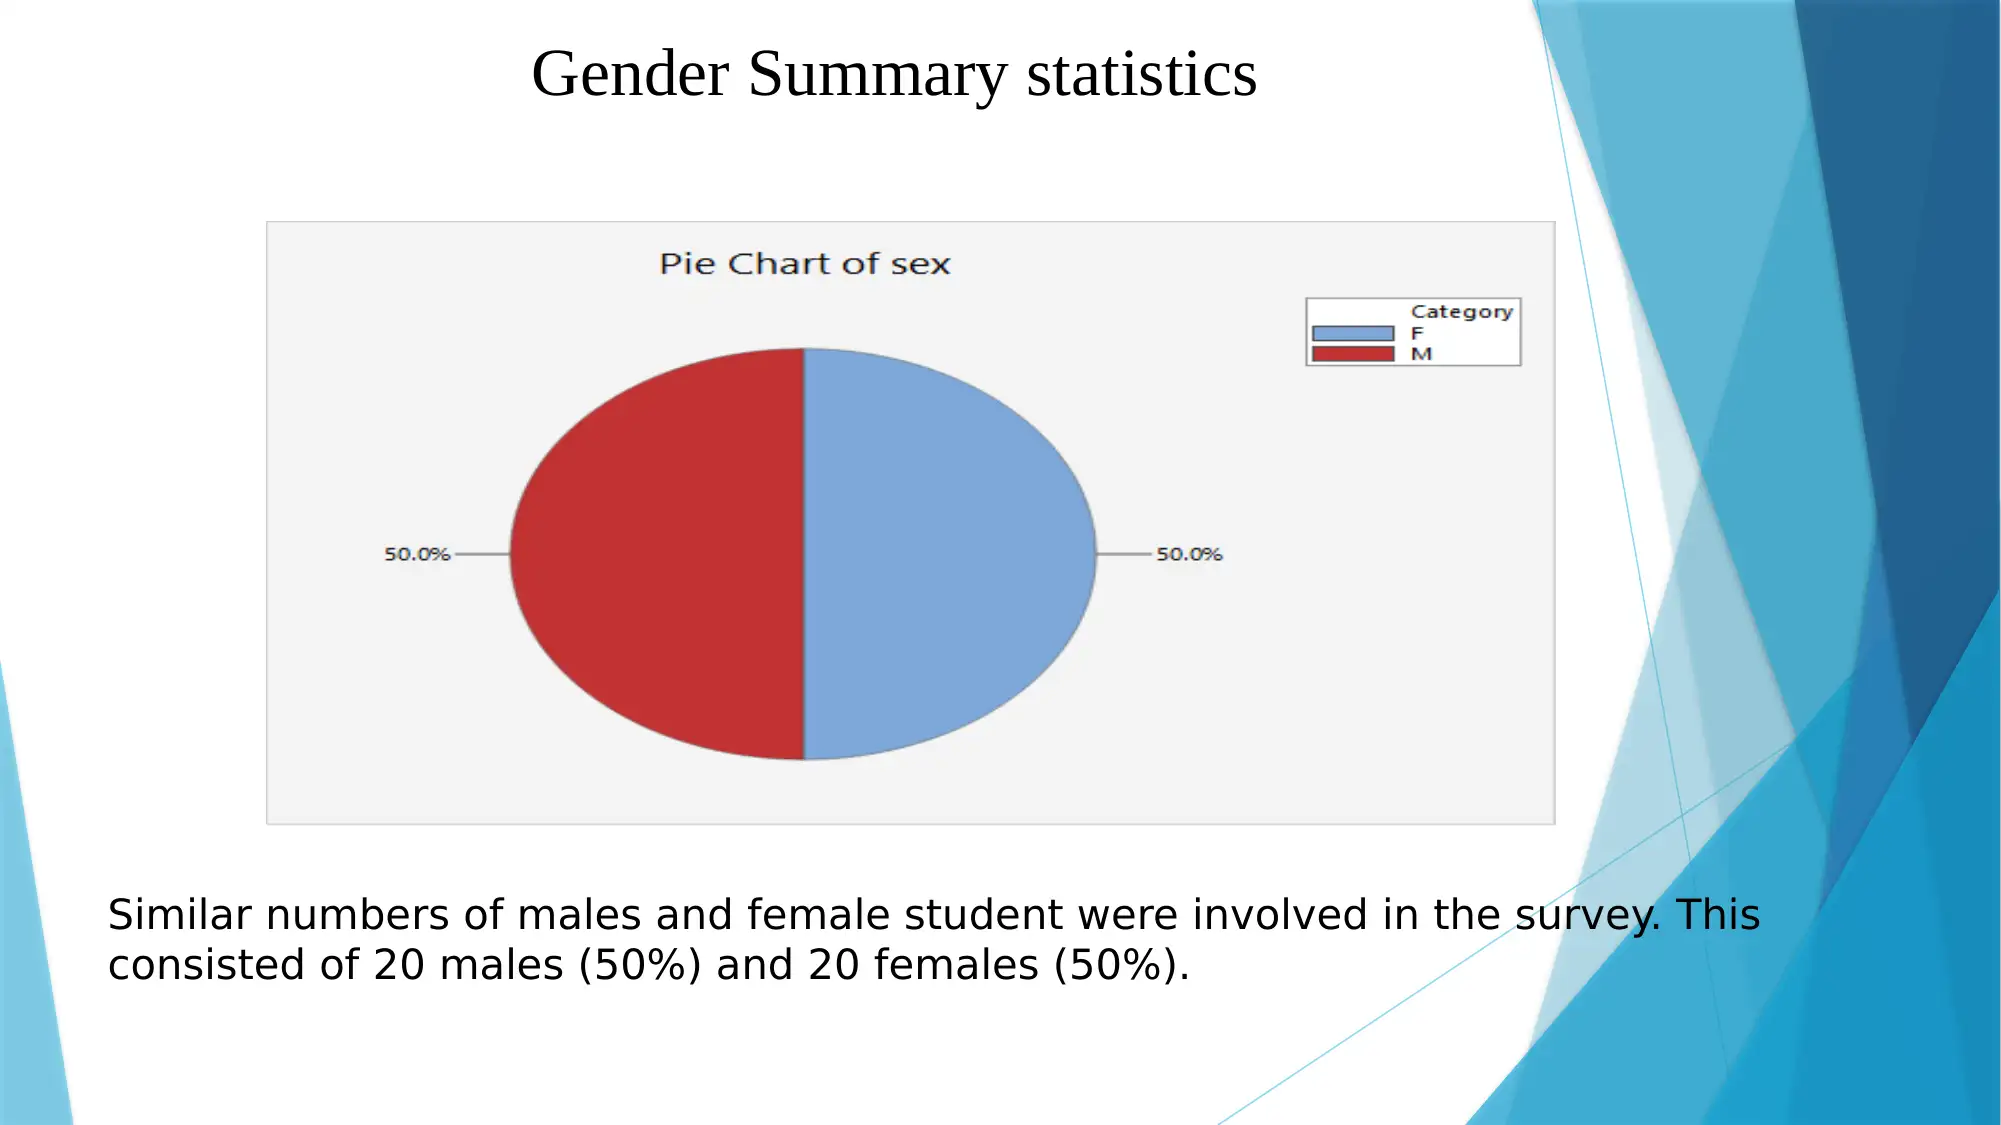
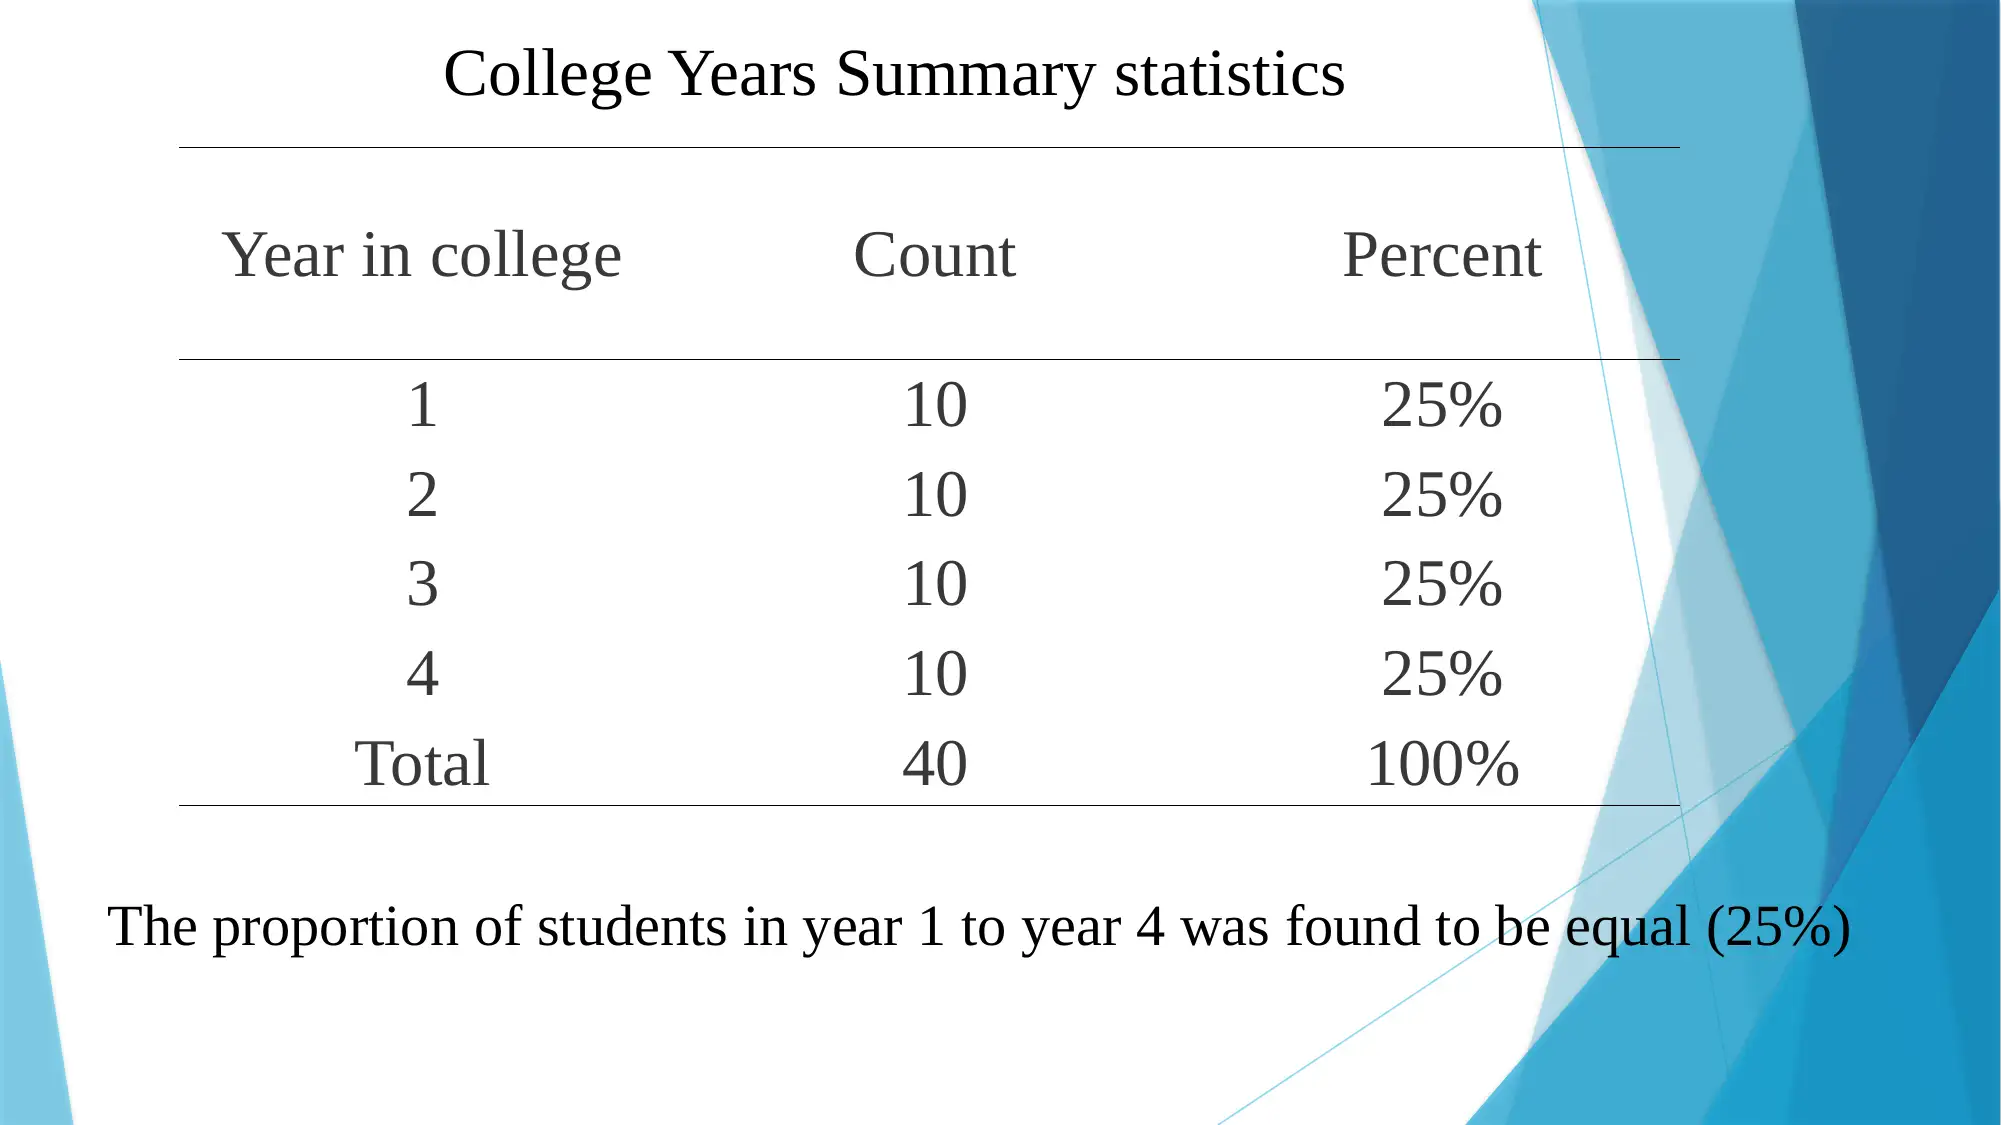
This PowerPoint presentation analyzes a dataset of 40 students, focusing on their age, height, gender, and years in college. The analysis includes summary statistics for each variable. The age data reveals that most students are between 22 and 26 years old, with an average age of 24. Height data shows a mean of 6.98 inches with a standard deviation of 2.24 inches, with the majority of students being 68 inches tall. The gender distribution is equal, with 20 males and 20 females. The proportion of students in each year of college (1 to 4) is also equal. References from Gupta & Kapoor (2019) and King'oriah (2004) are provided. This assignment is a statistical project designed to provide a descriptive analysis of the student sample.
Document Page
Student’s Name
Professor’s Name
Course
Date
TOPIC: W2 Assignment PowerPoint Presentation
Background
This study was conducted through a sample of 40 students. Details of their age, height
(in inches) and years in college were captured and inference drawn from them.
tabler-icon-diamond-filled.svg

Secure Best Marks with AI Grader

Need help grading? Try our AI Grader for instant feedback on your assignments.
Document Page
Age Summary statistics
The data analyzed revealed that majority of the students (25%) were 25 years old.
This was seconded by 26 years of age (15%). The largest fraction (75%) of the
sample were students between 22 to 26 years of age. The mean age of students
was found to be 24 years.
Document Page
Height Summary statistics
Age Count Percent
19 3 8%
20 3 8%
22 4 10%
23 5 13%
24 5 13%
25 10 25%
26 6 15%
27 3 8%
266 1 3%
Total 40 100%
The mean height of student is 6.98 inches with a standard deviation of 2.24 inches and
ranges between 63 to 71 inches. The majority of the students were 68 inches with the
least being 63 inches.
Document Page
Gender Summary statistics
Similar numbers of males and female student were involved in the survey. This
consisted of 20 males (50%) and 20 females (50%).
tabler-icon-diamond-filled.svg

Secure Best Marks with AI Grader

Need help grading? Try our AI Grader for instant feedback on your assignments.
Document Page
College Years Summary statistics
Year in college Count Percent
1 10 25%
2 10 25%
3 10 25%
4 10 25%
Total 40 100%
The proportion of students in year 1 to year 4 was found to be equal (25%)
Document Page
References
Gupta, S. C., & Kapoor, V. K. (2019). Fundamentals of applied statistics.
Sulthan Chand & Sons.
King'oriah, G. K. (2004). Fundamentals of applied statistics. Nairobi: The Jomo
Kenyatta Foundation.
chevron_up_icon
1 out of 6
circle_padding
hide_on_mobile
zoom_out_icon
[object Object]