Z-Score Calculation and Analysis of Age and Height Data
VerifiedAdded on 2022/12/28
|5
|1235
|42
Homework Assignment
AI Summary
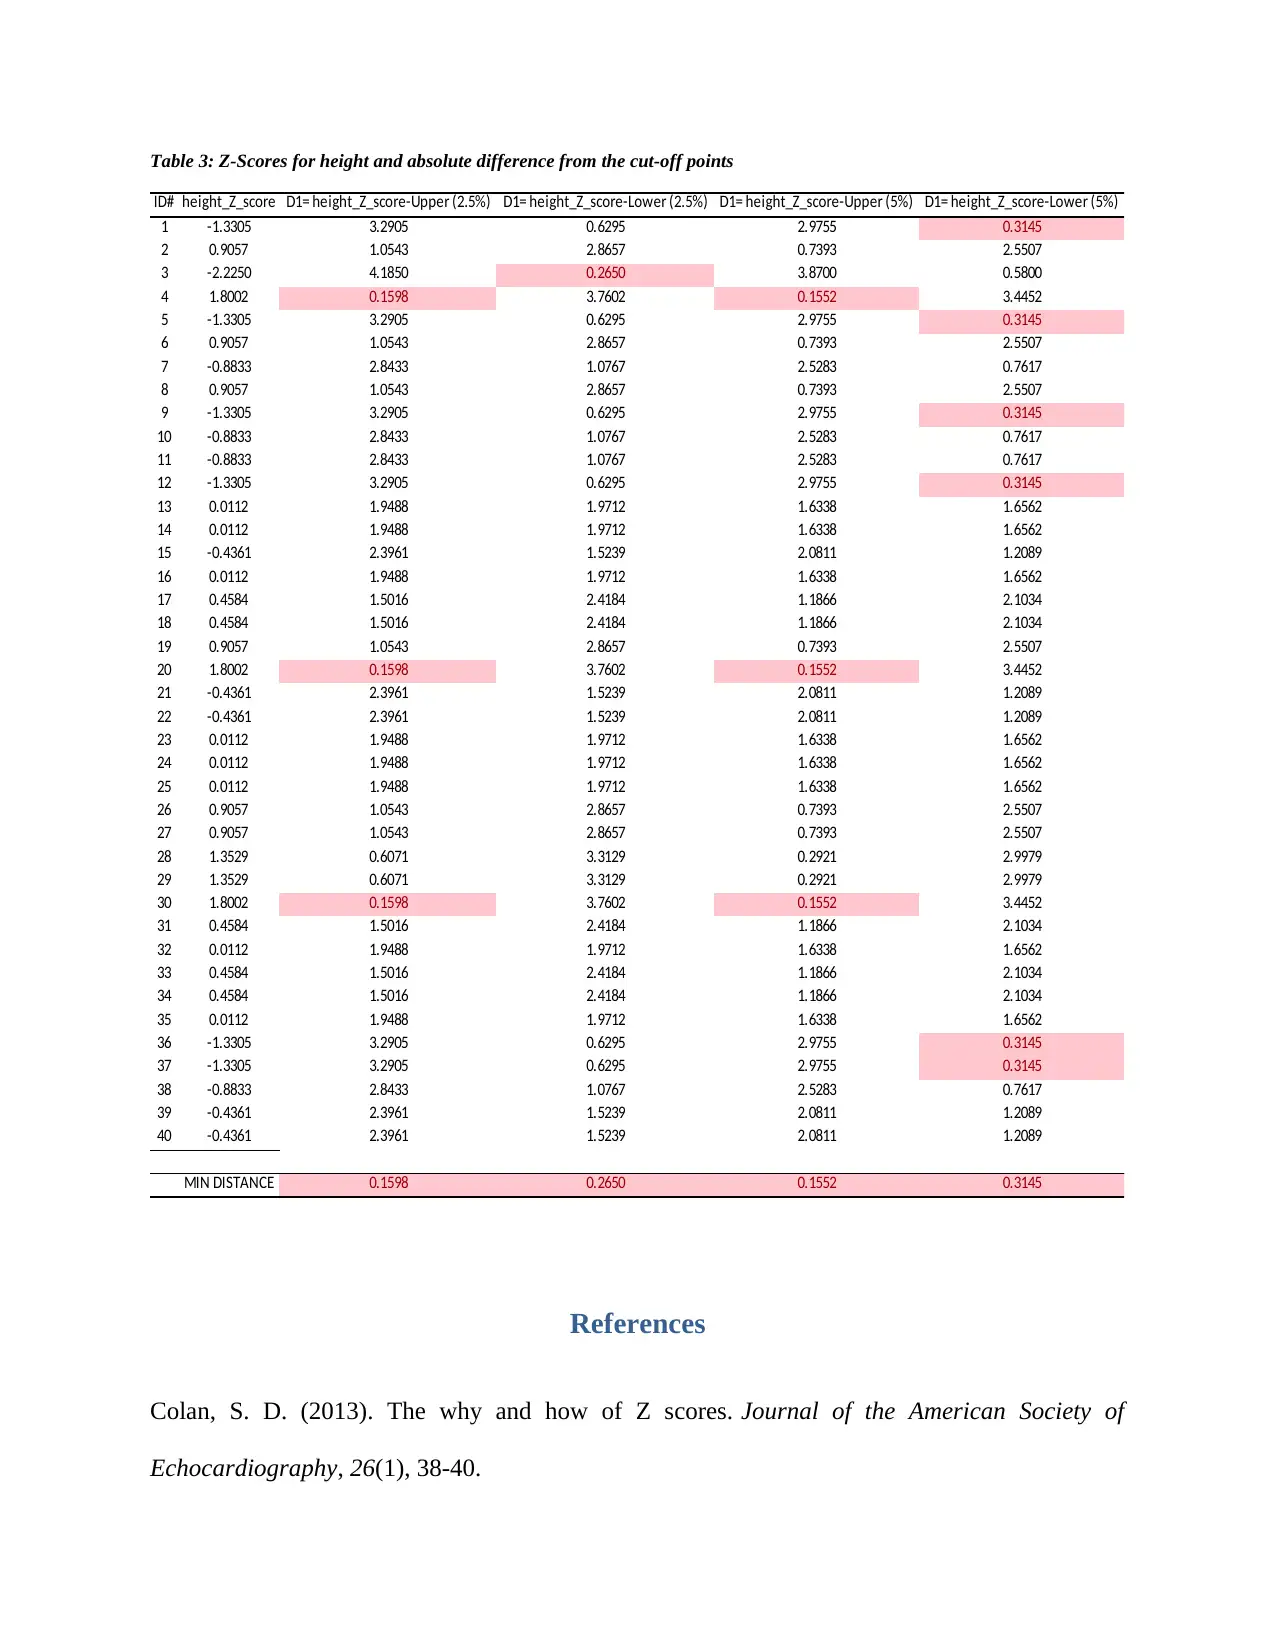
This assignment involves a statistical analysis of age and height data using Z-scores to normalize the data. The analysis includes calculating Z-scores for age and height, determining the mean and standard deviation for each variable, and establishing acceptance regions based on 2.5% and 5% cut-off points. The student identifies individuals whose Z-scores fall outside the acceptance regions, indicating potential outliers. The document presents the calculated Z-scores, the distances from the cut-off points, and the identification of individuals whose values are the minimum distance from the cut-off points, providing a comprehensive understanding of the data's distribution and identifying extreme values. The analysis also includes the sex and year in college of the participants.
1 out of 5
Related Documents


Your All-in-One AI-Powered Toolkit for Academic Success.
+13062052269
info@desklib.com
Available 24*7 on WhatsApp / Email
![[object Object]](/_next/static/media/star-bottom.7253800d.svg)
Copyright © 2020–2026 A2Z Services. All Rights Reserved. Developed and managed by ZUCOL.