Business Decision Making: Statistical Analysis of Apartment Rents

Verified

Added on  2020/02/19

|6
|849
|467
Homework Assignment
AI Summary
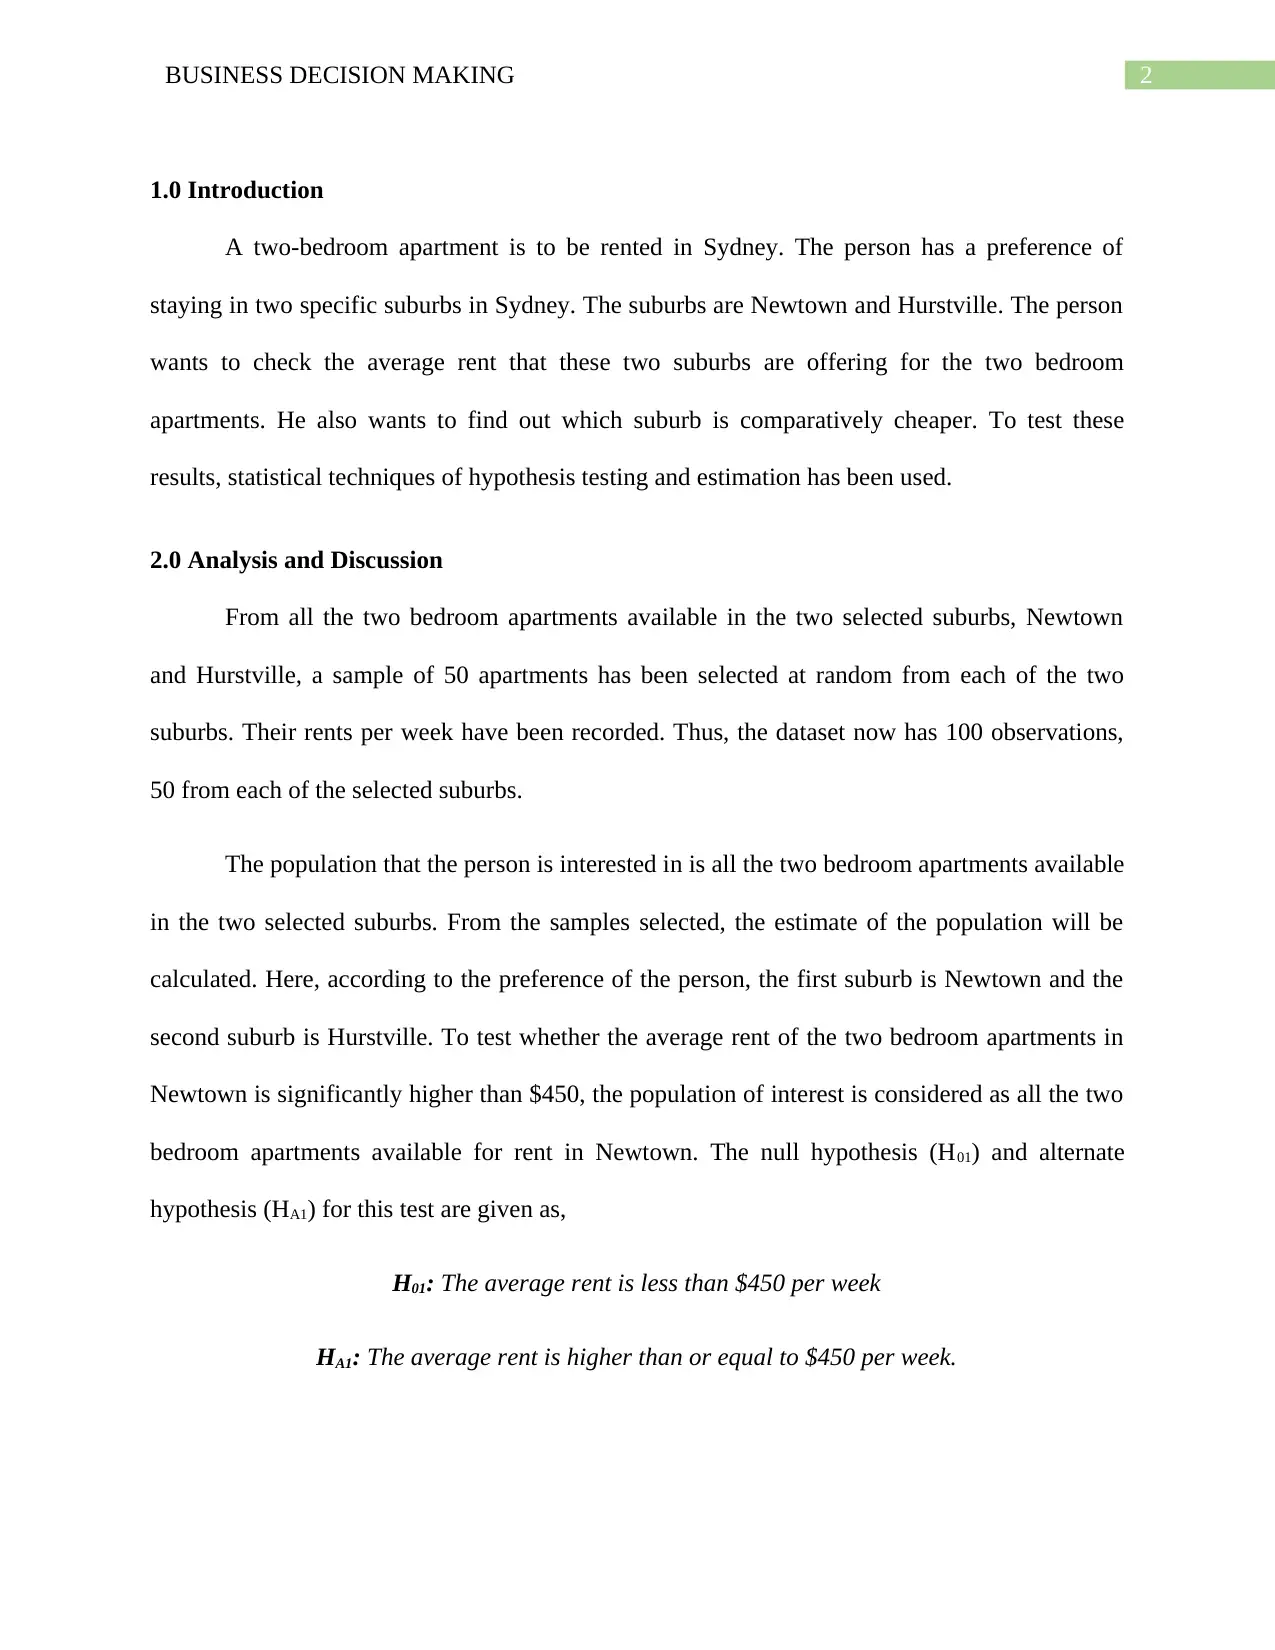
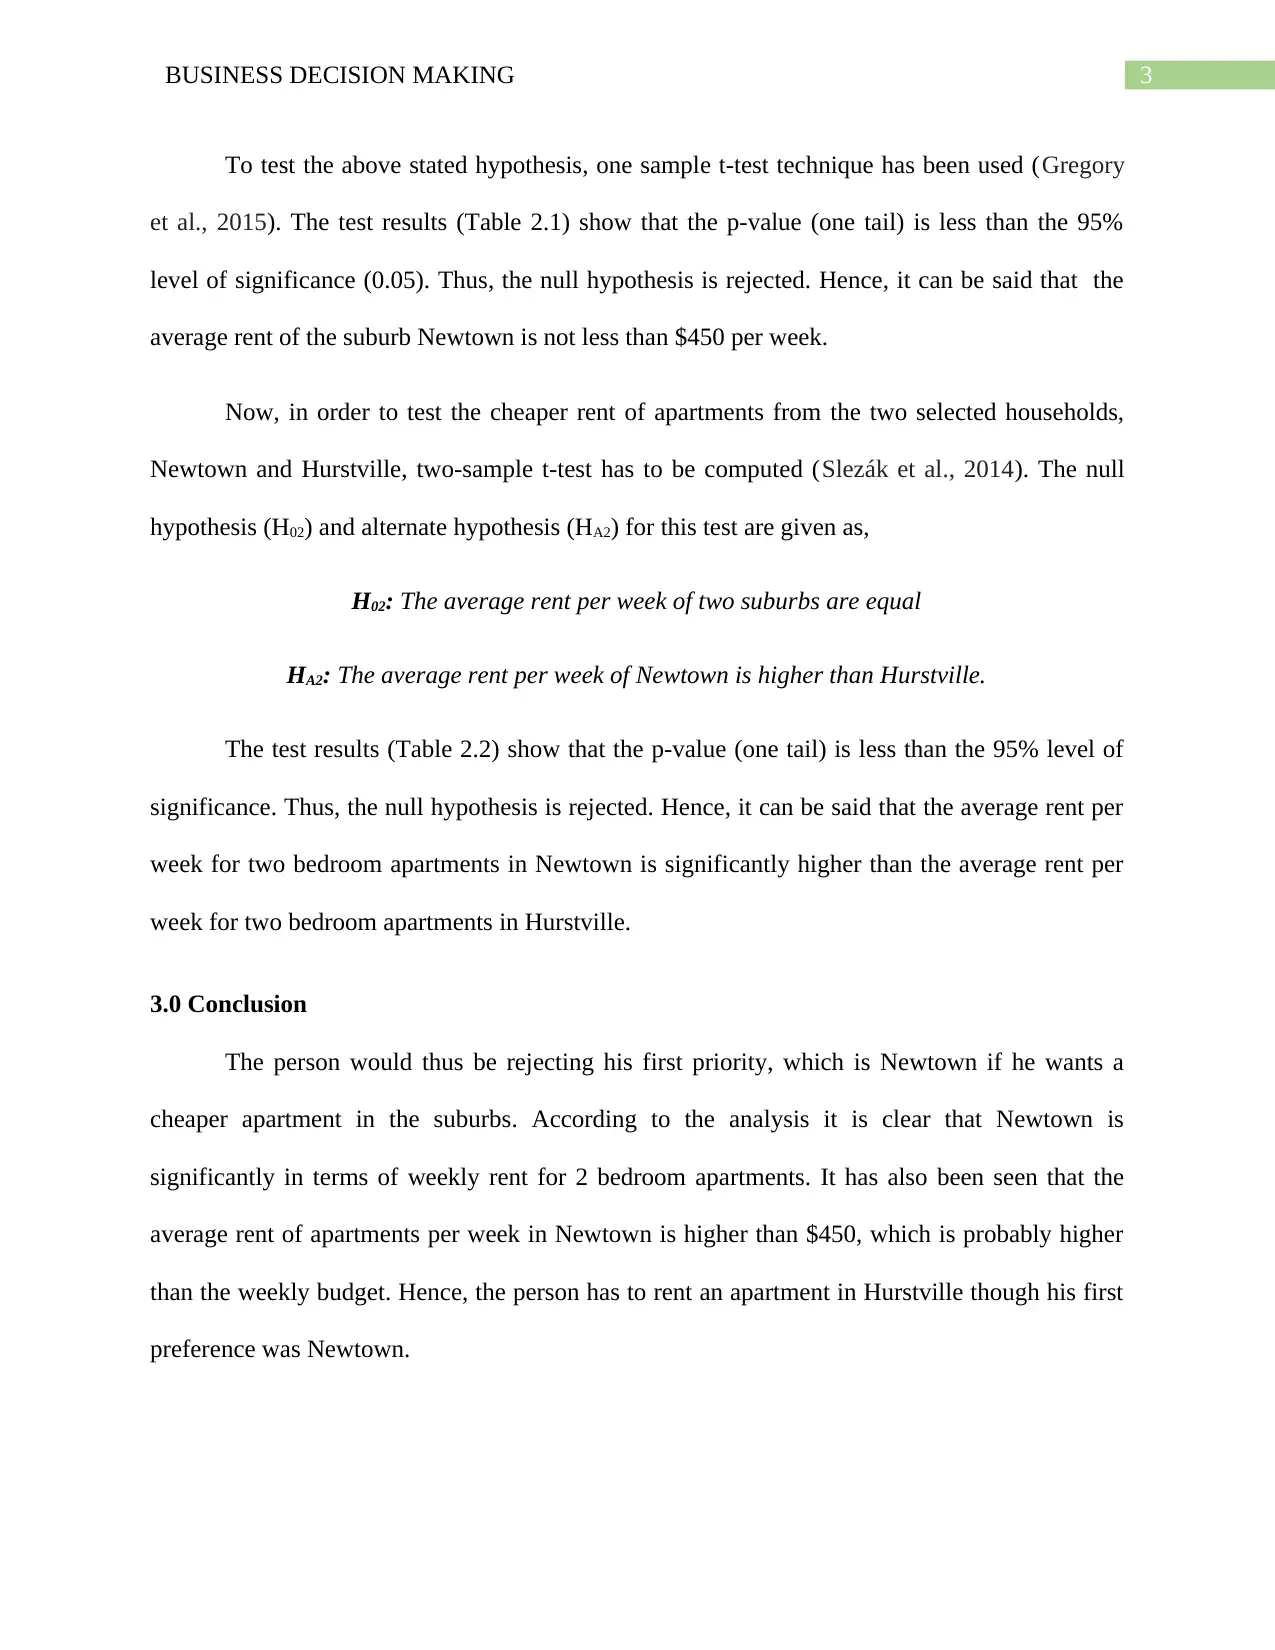
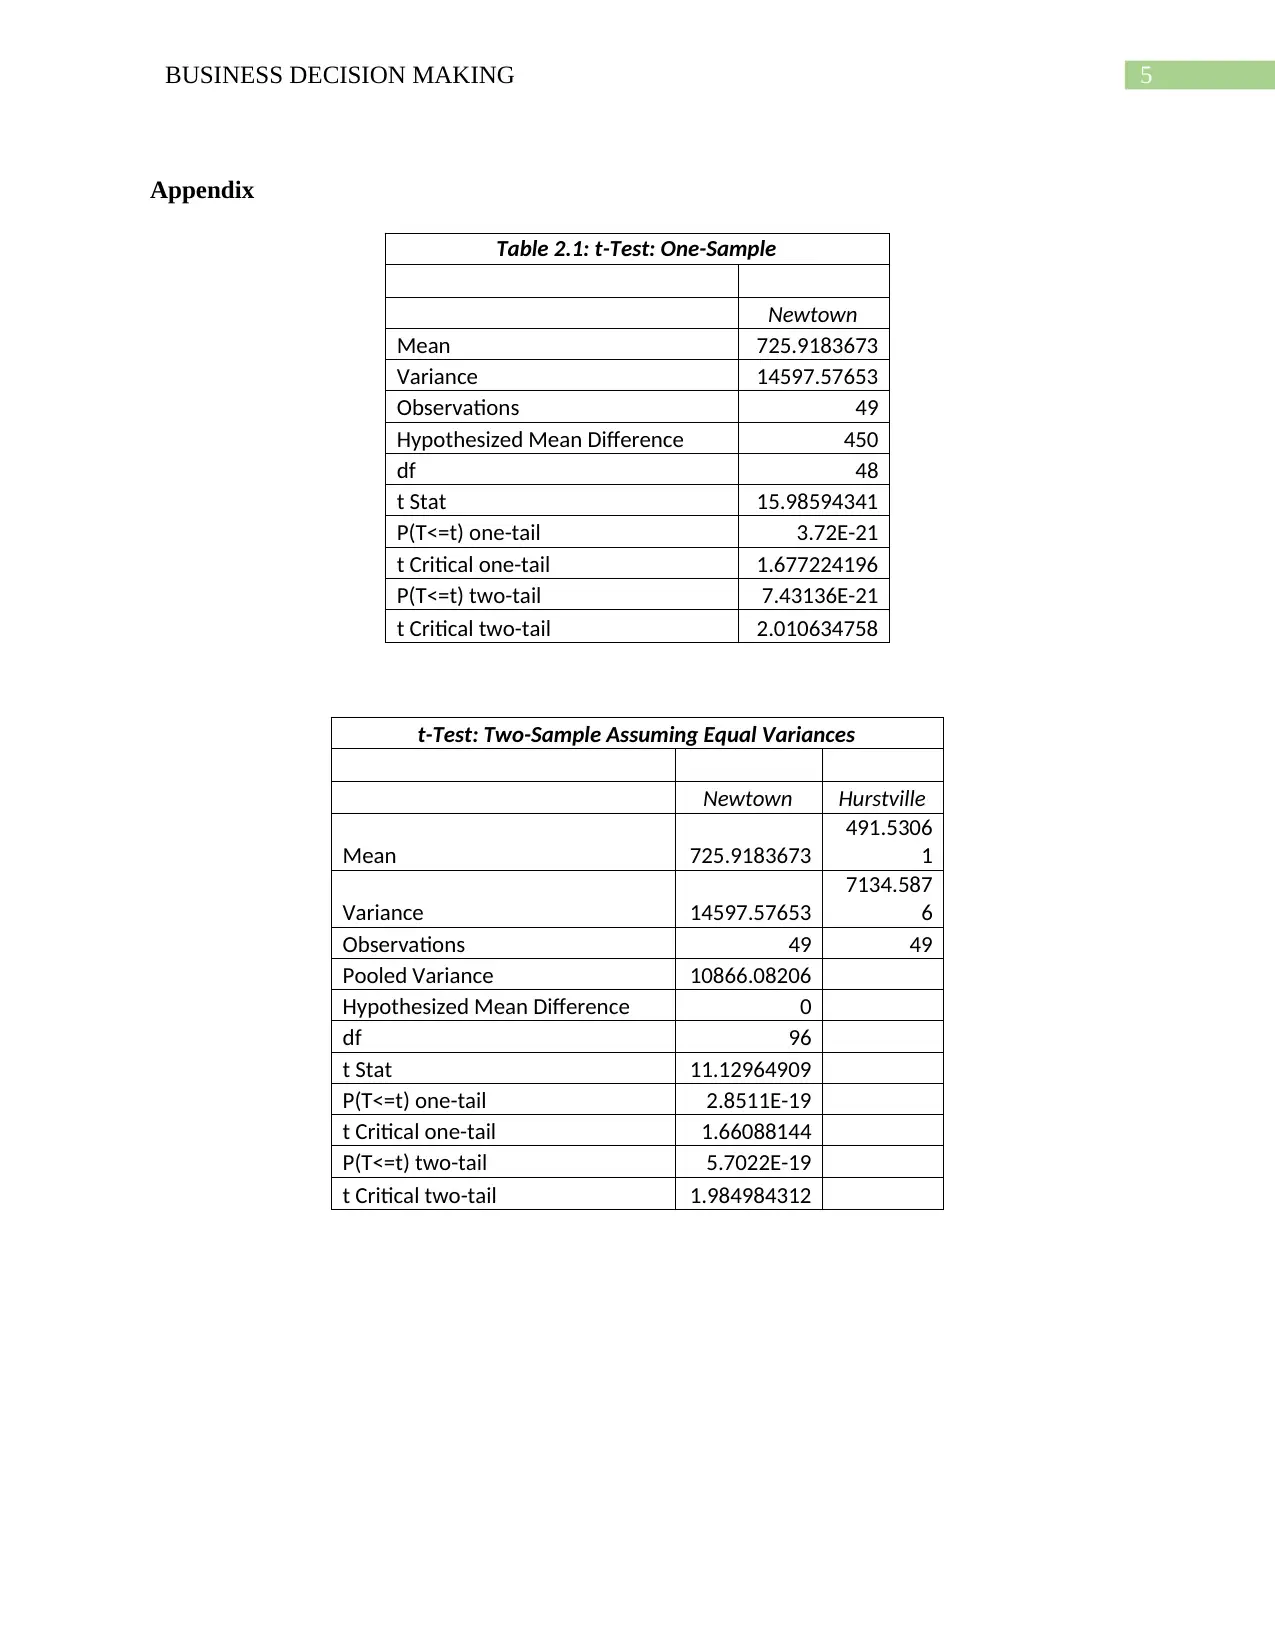
This assignment presents a business decision-making analysis focused on comparing apartment rents in two suburbs of Sydney: Newtown and Hurstville. The student employs statistical techniques, specifically hypothesis testing and estimation, to determine which suburb offers cheaper two-bedroom apartments. A sample of 50 apartments from each suburb is analyzed, and t-tests are conducted to compare the average rents and test the hypothesis that the average rent in Newtown is significantly higher than a specified amount and also higher than Hurstville. The analysis concludes that Hurstville offers significantly cheaper apartments compared to Newtown, leading to the rejection of Newtown as the preferred option for the individual seeking an apartment based on budget constraints. The assignment includes the methodology used, results from the t-tests, and a final conclusion based on the statistical findings.
Document Page
Running Head: BUSINESS DECISION MAKING
Business Decision Making
Name of the Student
Name of the University
Author Note
tabler-icon-diamond-filled.svg

Paraphrase This Document

Need a fresh take? Get an instant paraphrase of this document with our AI Paraphraser
Document Page
1BUSINESS DECISION MAKING
Table of Contents
1.0 Introduction................................................................................................................................2
2.0 Analysis and Discussion............................................................................................................2
3.0 Conclusion.................................................................................................................................3
References........................................................................................................................................4
Appendix..........................................................................................................................................5
Document Page
2BUSINESS DECISION MAKING
1.0 Introduction
A two-bedroom apartment is to be rented in Sydney. The person has a preference of
staying in two specific suburbs in Sydney. The suburbs are Newtown and Hurstville. The person
wants to check the average rent that these two suburbs are offering for the two bedroom
apartments. He also wants to find out which suburb is comparatively cheaper. To test these
results, statistical techniques of hypothesis testing and estimation has been used.
2.0 Analysis and Discussion
From all the two bedroom apartments available in the two selected suburbs, Newtown
and Hurstville, a sample of 50 apartments has been selected at random from each of the two
suburbs. Their rents per week have been recorded. Thus, the dataset now has 100 observations,
50 from each of the selected suburbs.
The population that the person is interested in is all the two bedroom apartments available
in the two selected suburbs. From the samples selected, the estimate of the population will be
calculated. Here, according to the preference of the person, the first suburb is Newtown and the
second suburb is Hurstville. To test whether the average rent of the two bedroom apartments in
Newtown is significantly higher than $450, the population of interest is considered as all the two
bedroom apartments available for rent in Newtown. The null hypothesis (H01) and alternate
hypothesis (HA1) for this test are given as,
H01: The average rent is less than $450 per week
HA1: The average rent is higher than or equal to $450 per week.
Document Page
3BUSINESS DECISION MAKING
To test the above stated hypothesis, one sample t-test technique has been used (Gregory
et al., 2015). The test results (Table 2.1) show that the p-value (one tail) is less than the 95%
level of significance (0.05). Thus, the null hypothesis is rejected. Hence, it can be said that the
average rent of the suburb Newtown is not less than $450 per week.
Now, in order to test the cheaper rent of apartments from the two selected households,
Newtown and Hurstville, two-sample t-test has to be computed (Slezák et al., 2014). The null
hypothesis (H02) and alternate hypothesis (HA2) for this test are given as,
H02: The average rent per week of two suburbs are equal
HA2: The average rent per week of Newtown is higher than Hurstville.
The test results (Table 2.2) show that the p-value (one tail) is less than the 95% level of
significance. Thus, the null hypothesis is rejected. Hence, it can be said that the average rent per
week for two bedroom apartments in Newtown is significantly higher than the average rent per
week for two bedroom apartments in Hurstville.
3.0 Conclusion
The person would thus be rejecting his first priority, which is Newtown if he wants a
cheaper apartment in the suburbs. According to the analysis it is clear that Newtown is
significantly in terms of weekly rent for 2 bedroom apartments. It has also been seen that the
average rent of apartments per week in Newtown is higher than $450, which is probably higher
than the weekly budget. Hence, the person has to rent an apartment in Hurstville though his first
preference was Newtown.
tabler-icon-diamond-filled.svg

Paraphrase This Document

Need a fresh take? Get an instant paraphrase of this document with our AI Paraphraser
Document Page
4BUSINESS DECISION MAKING
References
Gregory, K. B., Carroll, R. J., Baladandayuthapani, V., & Lahiri, S. N. (2015). A two-sample test
for equality of means in high dimension. Journal of the American Statistical
Association, 110(510), 837-849.
Slezák, P., Bokes, P., Námer, P., & Waczulíková, I. (2014). Microsoft Excel add-in for the
statistical analysis of contingency tables. International Journal for Innovation Education
and Research, 2(5), 90-100.
Document Page
5BUSINESS DECISION MAKING
Appendix
Table 2.1: t-Test: One-Sample
Newtown
Mean 725.9183673
Variance 14597.57653
Observations 49
Hypothesized Mean Difference 450
df 48
t Stat 15.98594341
P(T<=t) one-tail 3.72E-21
t Critical one-tail 1.677224196
P(T<=t) two-tail 7.43136E-21
t Critical two-tail 2.010634758
t-Test: Two-Sample Assuming Equal Variances
Newtown Hurstville
Mean 725.9183673
491.5306
1
Variance 14597.57653
7134.587
6
Observations 49 49
Pooled Variance 10866.08206
Hypothesized Mean Difference 0
df 96
t Stat 11.12964909
P(T<=t) one-tail 2.8511E-19
t Critical one-tail 1.66088144
P(T<=t) two-tail 5.7022E-19
t Critical two-tail 1.984984312
chevron_up_icon
1 out of 6
circle_padding
hide_on_mobile
zoom_out_icon
[object Object]