Statistical Analysis of ARIMA Models: Homework Assignment
VerifiedAdded on 2023/03/31
|6
|773
|114
Homework Assignment
AI Summary
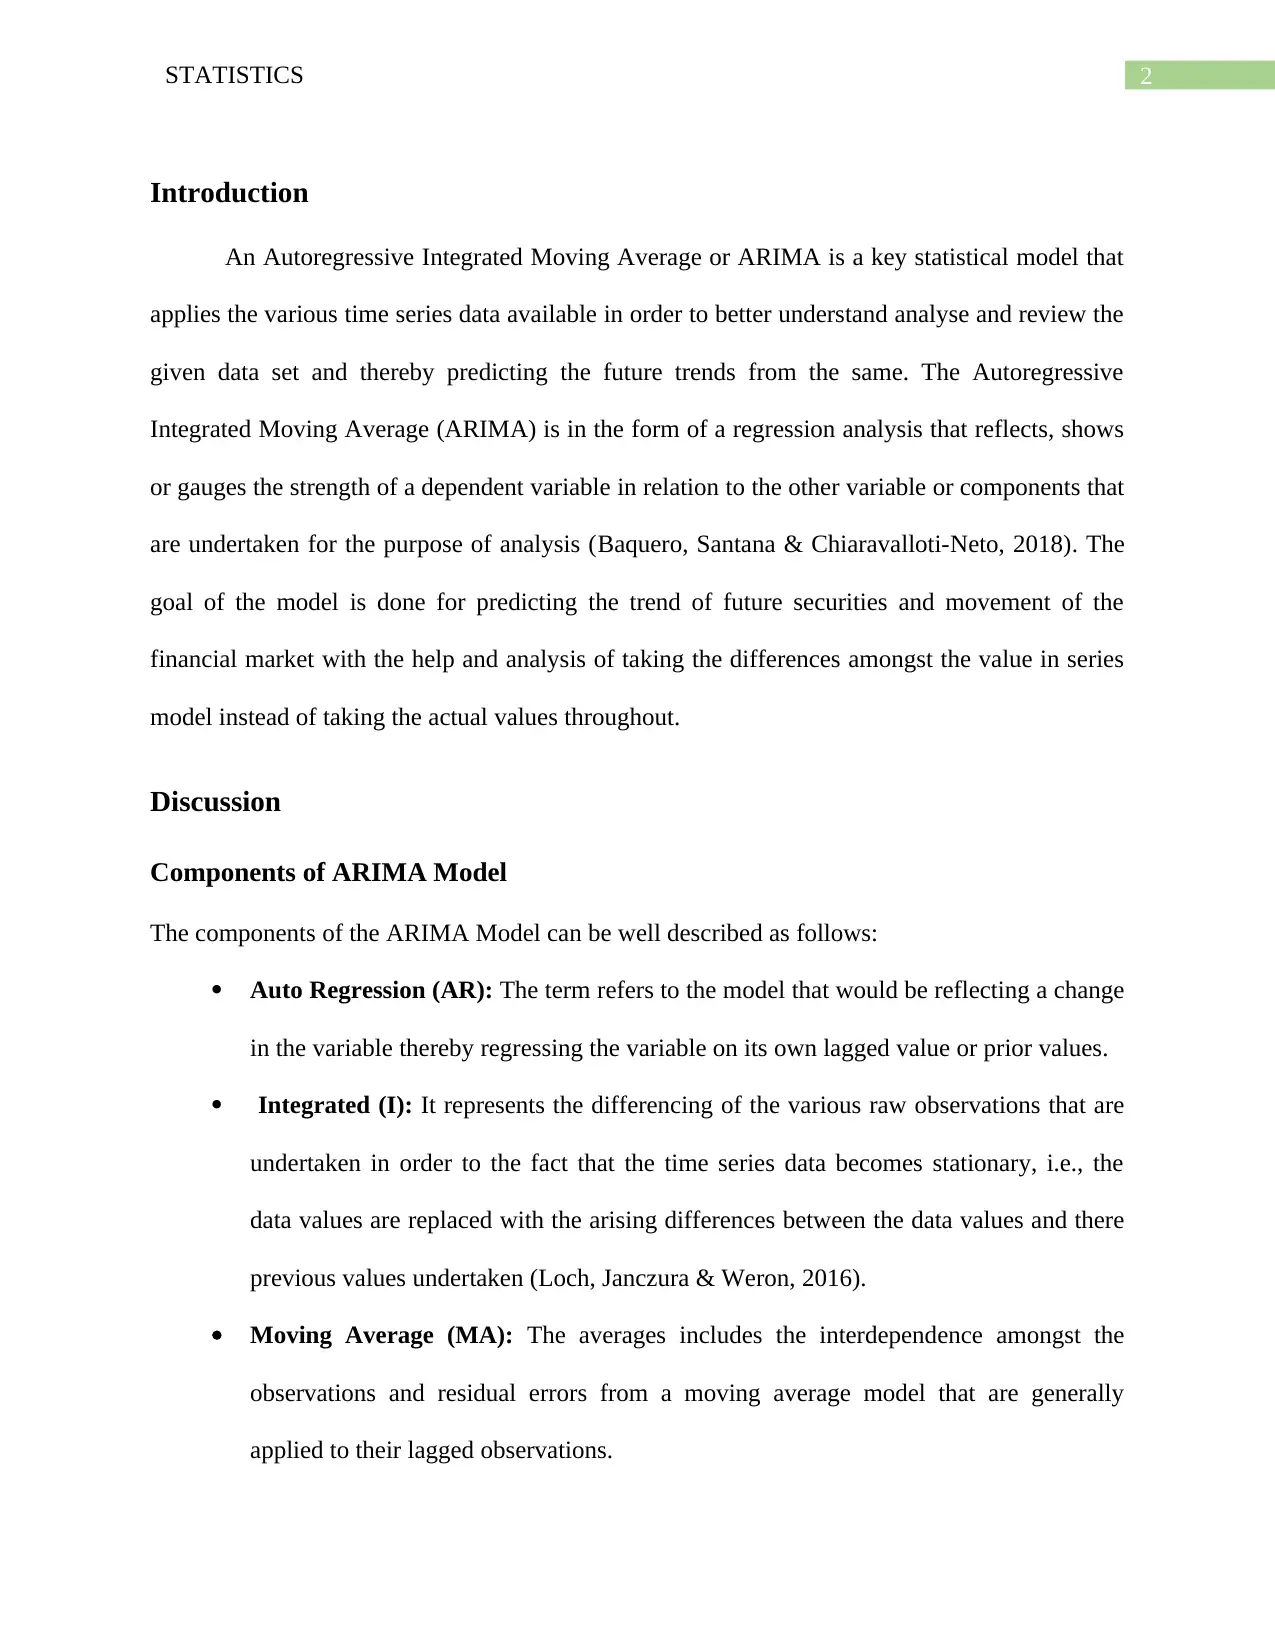
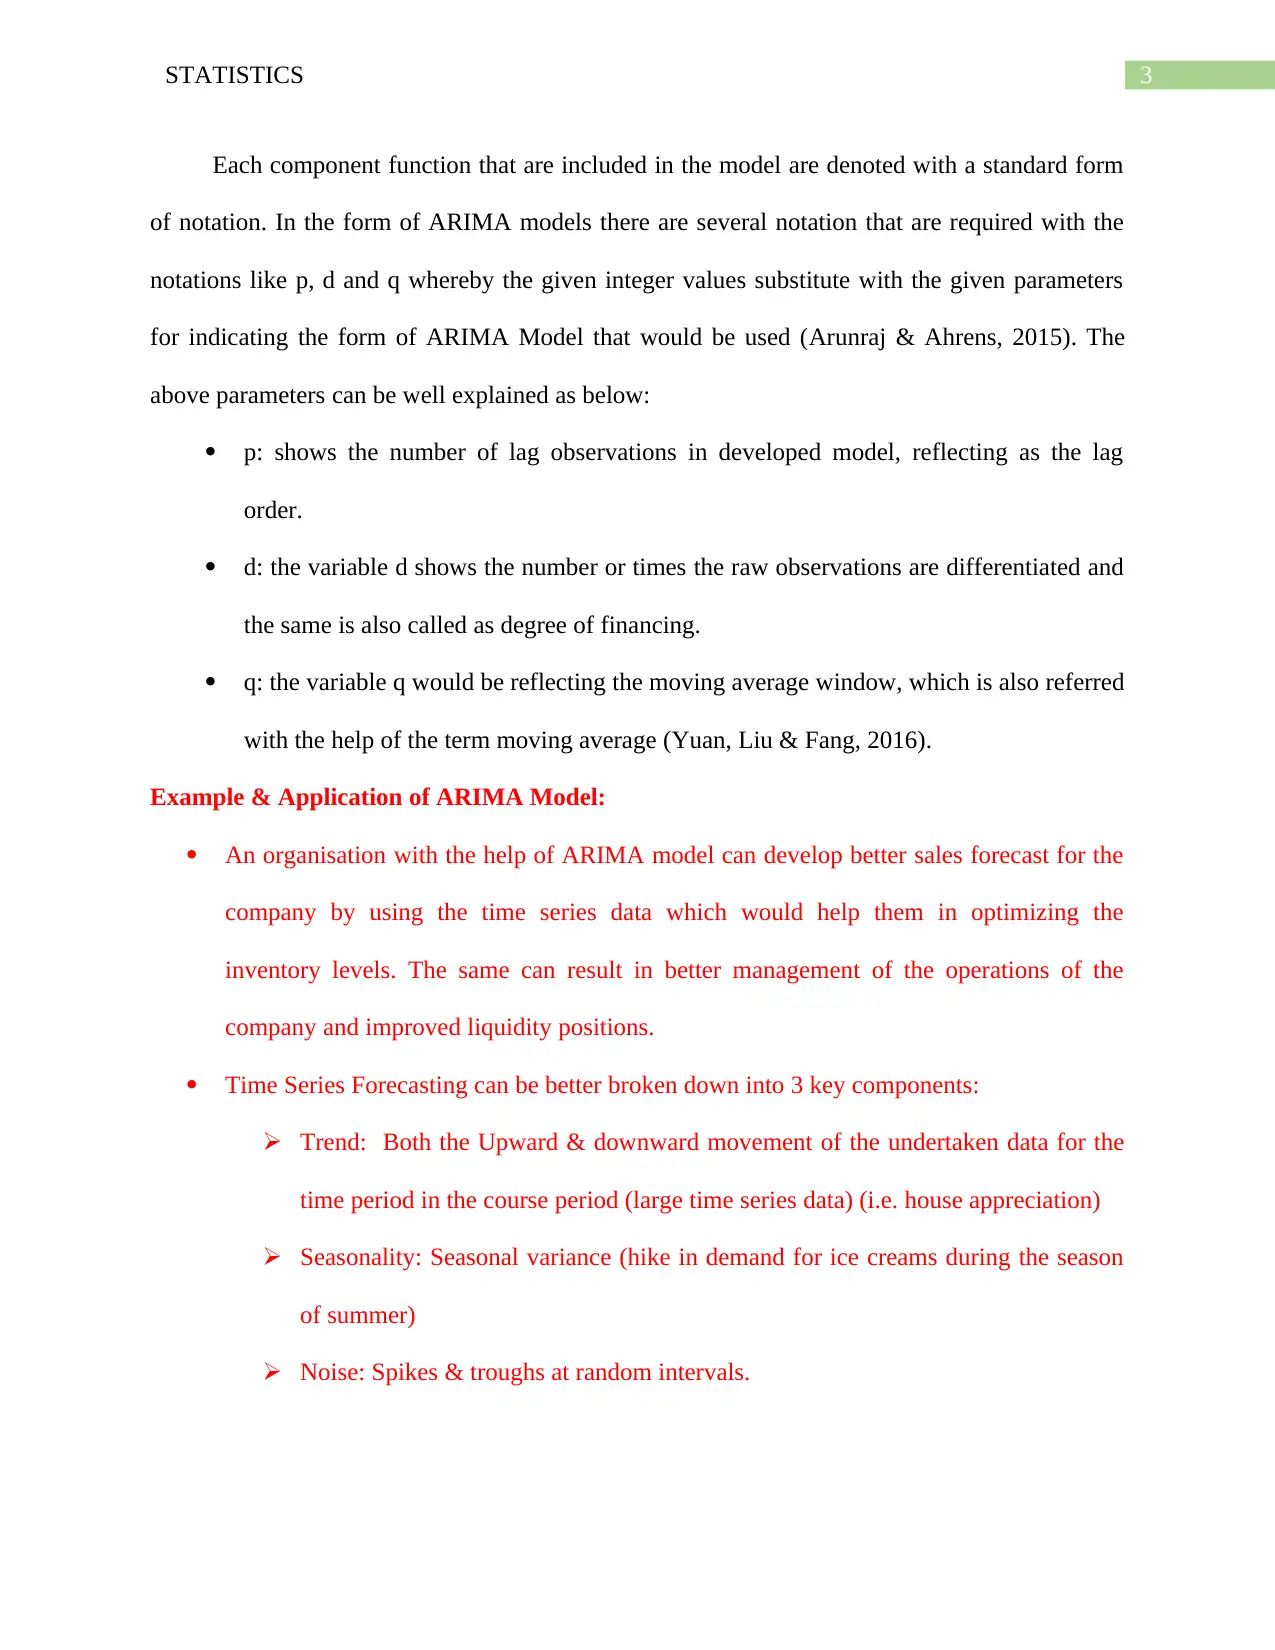
This assignment delves into the Autoregressive Integrated Moving Average (ARIMA) model, a key statistical tool for analyzing time series data and predicting future trends. The assignment explains ARIMA's function as a regression analysis, focusing on the relationship between a dependent variable and other components. It explores the three main components of the ARIMA model: Autoregression (AR), Integration (I), and Moving Average (MA), detailing how each component contributes to the model's predictive capabilities. The assignment provides real-world examples and applications of the ARIMA model, such as sales forecasting and time series forecasting, and concludes with a summary of its applications.

Running head: STATISTICS
Statistics
Name of the Student:
Name of the University:
Author’s Note:
Statistics
Name of the Student:
Name of the University:
Author’s Note:
Paraphrase This Document
Need a fresh take? Get an instant paraphrase of this document with our AI Paraphraser

1STATISTICS
Table of Contents
Introduction......................................................................................................................................2
Discussion........................................................................................................................................2
Components of ARIMA Model...................................................................................................2
Conclusion.......................................................................................................................................3
References........................................................................................................................................4

2STATISTICS
Introduction
An Autoregressive Integrated Moving Average or ARIMA is a key statistical model that
applies the various time series data available in order to better understand analyse and review the
given data set and thereby predicting the future trends from the same. The Autoregressive
Integrated Moving Average (ARIMA) is in the form of a regression analysis that reflects, shows
or gauges the strength of a dependent variable in relation to the other variable or components that
are undertaken for the purpose of analysis (Baquero, Santana & Chiaravalloti-Neto, 2018). The
goal of the model is done for predicting the trend of future securities and movement of the
financial market with the help and analysis of taking the differences amongst the value in series
model instead of taking the actual values throughout.
Discussion
Components of ARIMA Model
The components of the ARIMA Model can be well described as follows:
Auto Regression (AR): The term refers to the model that would be reflecting a change
in the variable thereby regressing the variable on its own lagged value or prior values.
Integrated (I): It represents the differencing of the various raw observations that are
undertaken in order to the fact that the time series data becomes stationary, i.e., the
data values are replaced with the arising differences between the data values and there
previous values undertaken (Loch, Janczura & Weron, 2016).
Moving Average (MA): The averages includes the interdependence amongst the
observations and residual errors from a moving average model that are generally
applied to their lagged observations.
⊘ This is a preview!⊘
Do you want full access?
Subscribe today to unlock all pages.

Trusted by 1+ million students worldwide

3STATISTICS
Each component function that are included in the model are denoted with a standard form
of notation. In the form of ARIMA models there are several notation that are required with the
notations like p, d and q whereby the given integer values substitute with the given parameters
for indicating the form of ARIMA Model that would be used (Arunraj & Ahrens, 2015). The
above parameters can be well explained as below:
p: shows the number of lag observations in developed model, reflecting as the lag
order.
d: the variable d shows the number or times the raw observations are differentiated and
the same is also called as degree of financing.
q: the variable q would be reflecting the moving average window, which is also referred
with the help of the term moving average (Yuan, Liu & Fang, 2016).
Example & Application of ARIMA Model:
An organisation with the help of ARIMA model can develop better sales forecast for the
company by using the time series data which would help them in optimizing the
inventory levels. The same can result in better management of the operations of the
company and improved liquidity positions.
Time Series Forecasting can be better broken down into 3 key components:
Trend: Both the Upward & downward movement of the undertaken data for the
time period in the course period (large time series data) (i.e. house appreciation)
Seasonality: Seasonal variance (hike in demand for ice creams during the season
of summer)
Noise: Spikes & troughs at random intervals.
Paraphrase This Document
Need a fresh take? Get an instant paraphrase of this document with our AI Paraphraser

4STATISTICS
Conclusion
From the above case it was analysed that in the case of a linear regressive model, the types
of terms and the number of terms are all included within the model. A value with 0, can be well
defined as a parameter explaining that the same or particular component be not included in the
model. In the same way or similar way the construction of the ARIMA Model can be well used
in order to perform the function of an ARMA model, oven as a simple AR, I or Moving Average
Models.

5STATISTICS
References
Arunraj, N. S., & Ahrens, D. (2015). A hybrid seasonal autoregressive integrated moving
average and quantile regression for daily food sales forecasting. International Journal of
Production Economics, 170, 321-335.
Baquero, O. S., Santana, L. M. R., & Chiaravalloti-Neto, F. (2018). Dengue forecasting in São
Paulo city with generalized additive models, artificial neural networks and seasonal
autoregressive integrated moving average models. PloS one, 13(4), e0195065.
Loch, H., Janczura, J., & Weron, A. (2016). Ergodicity testing using an analytical formula for a
dynamical functional of alpha-stable autoregressive fractionally integrated moving
average processes. Physical Review E, 93(4), 043317.
Yuan, C., Liu, S., & Fang, Z. (2016). Comparison of China's primary energy consumption
forecasting by using ARIMA (the autoregressive integrated moving average) model and
GM (1, 1) model. Energy, 100, 384-390.
⊘ This is a preview!⊘
Do you want full access?
Subscribe today to unlock all pages.

Trusted by 1+ million students worldwide
1 out of 6
Related Documents

Your All-in-One AI-Powered Toolkit for Academic Success.
+13062052269
info@desklib.com
Available 24*7 on WhatsApp / Email
Unlock your academic potential
Copyright © 2020–2025 A2Z Services. All Rights Reserved. Developed and managed by ZUCOL.