Homework Assignment: Statistical Analysis of Omega-3 and Mother's Age

Verified

Added on  2022/08/10

|5
|541
|425
Homework Assignment
AI Summary
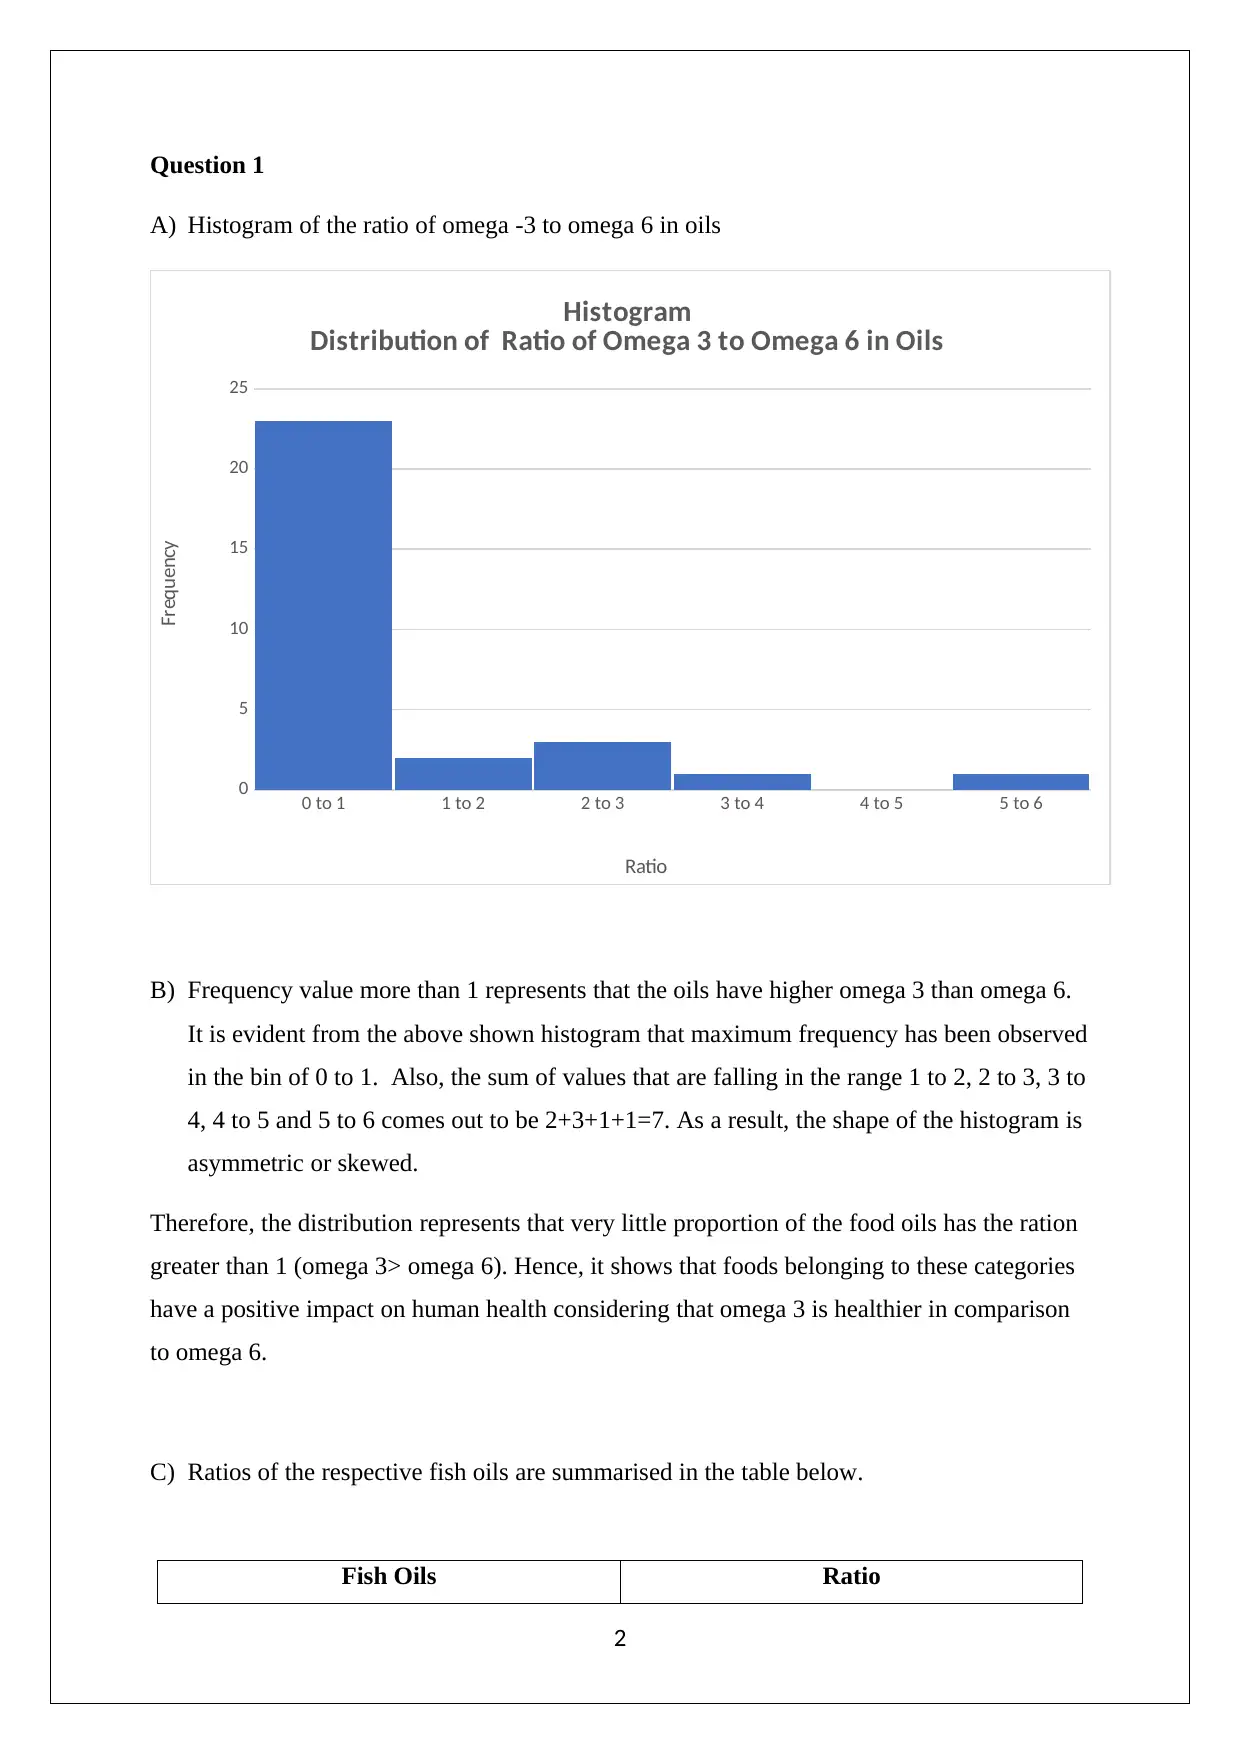
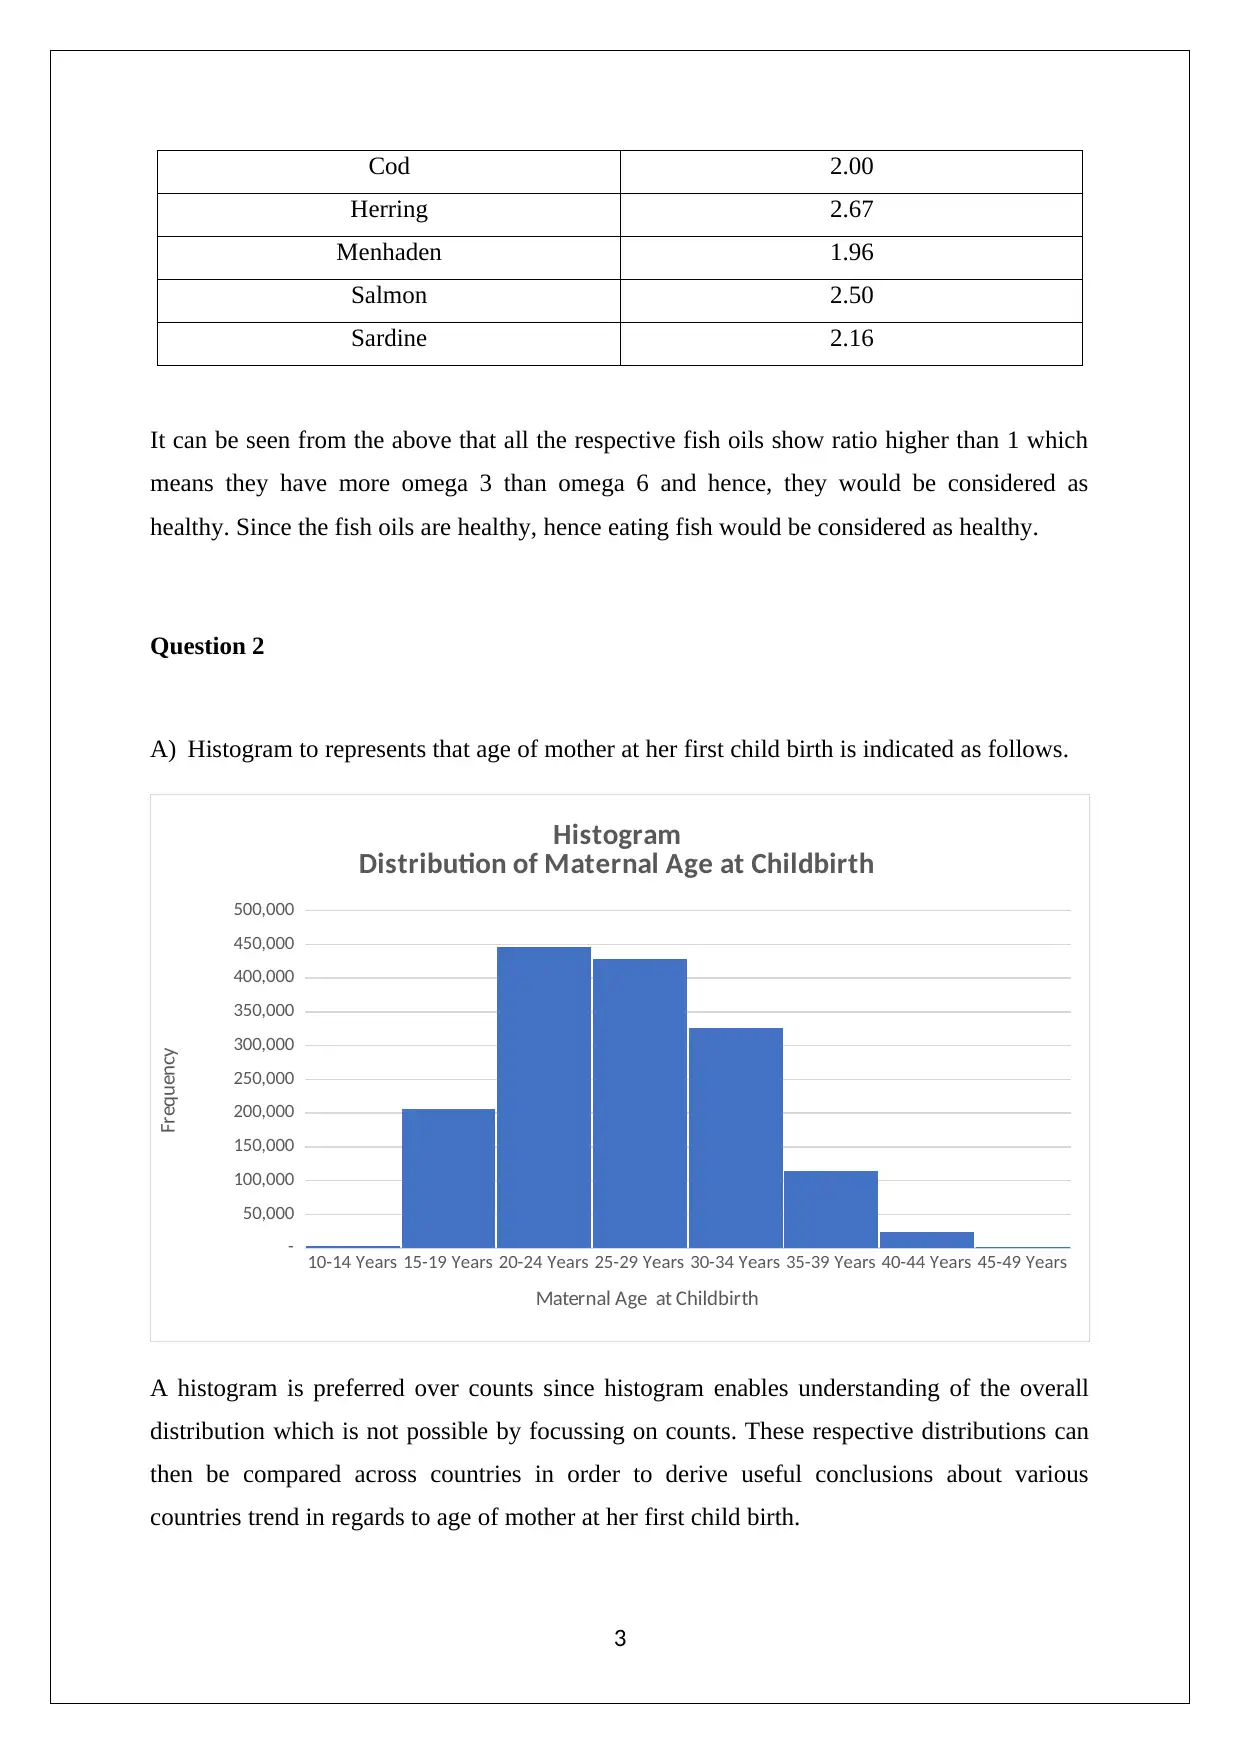
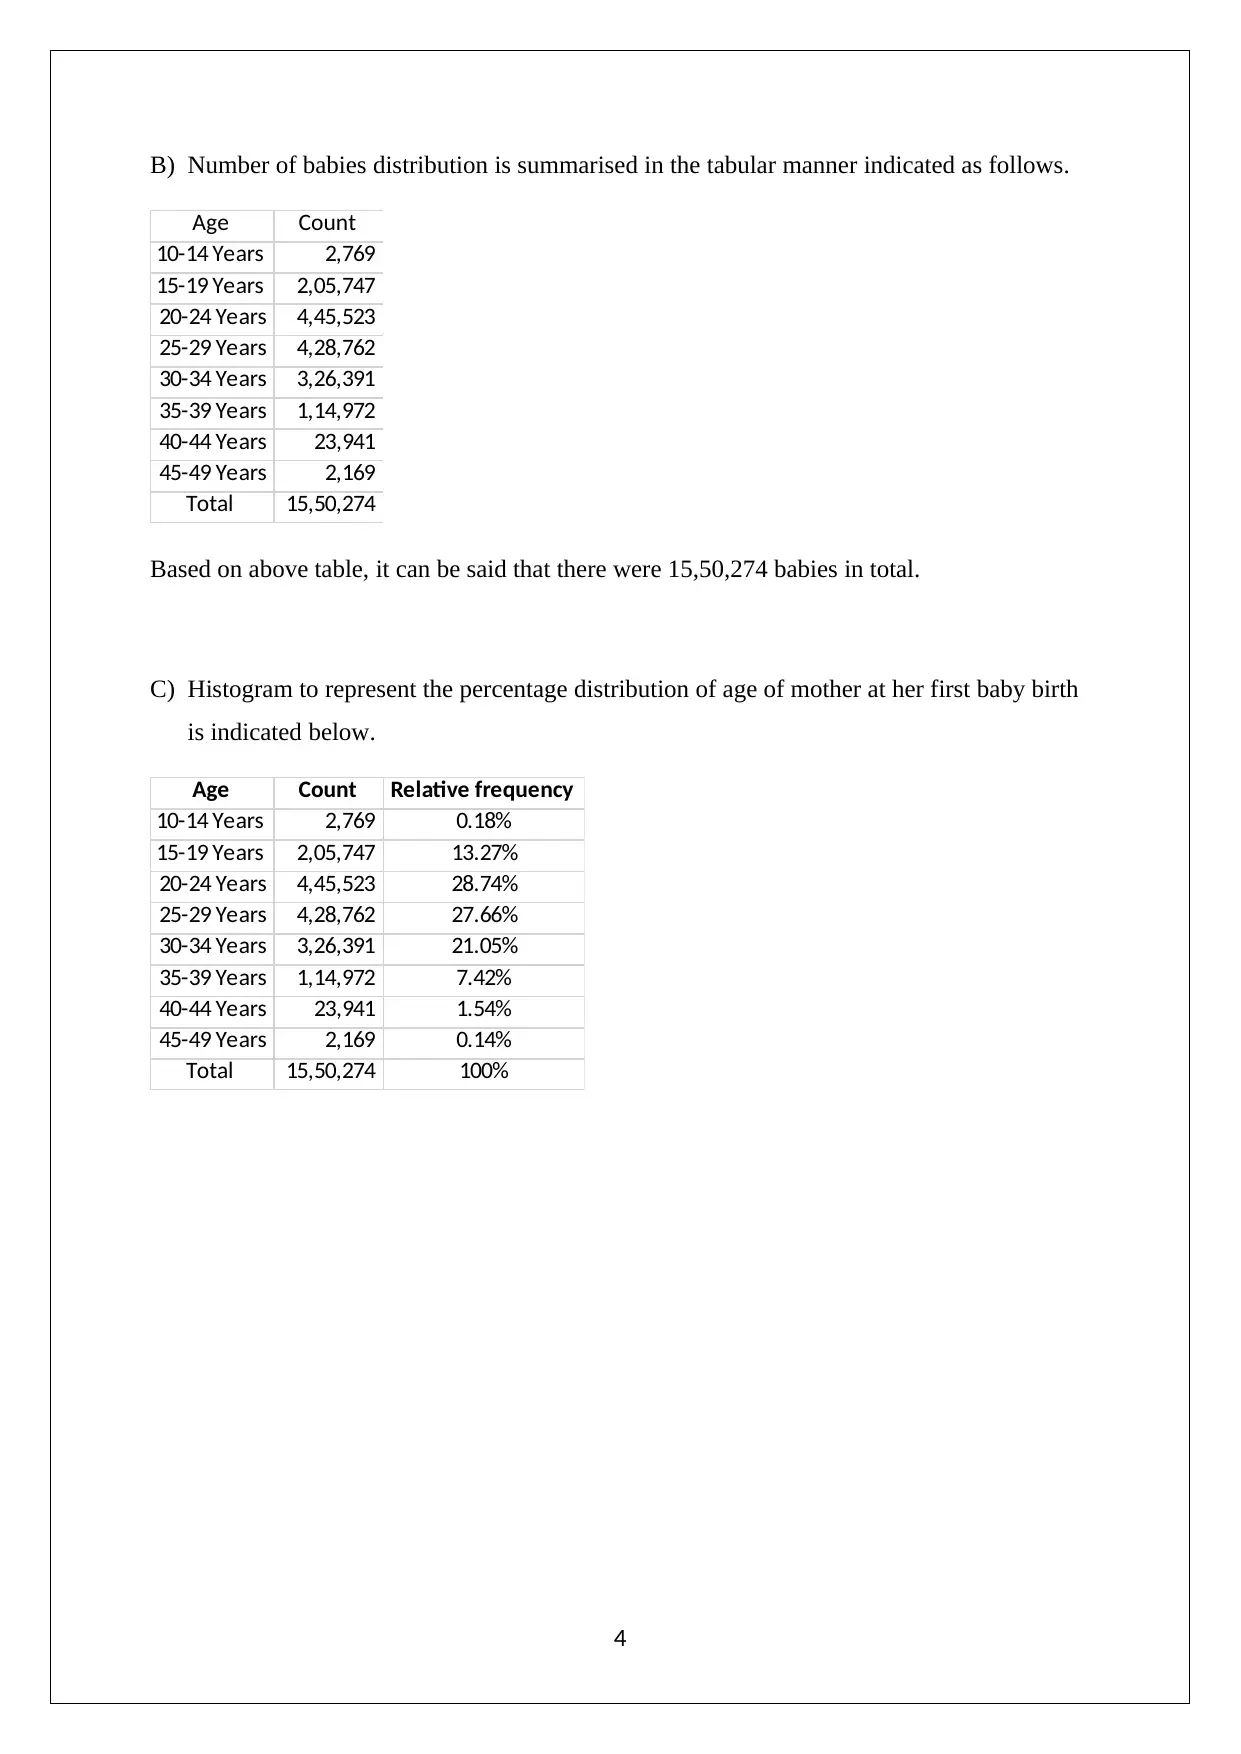
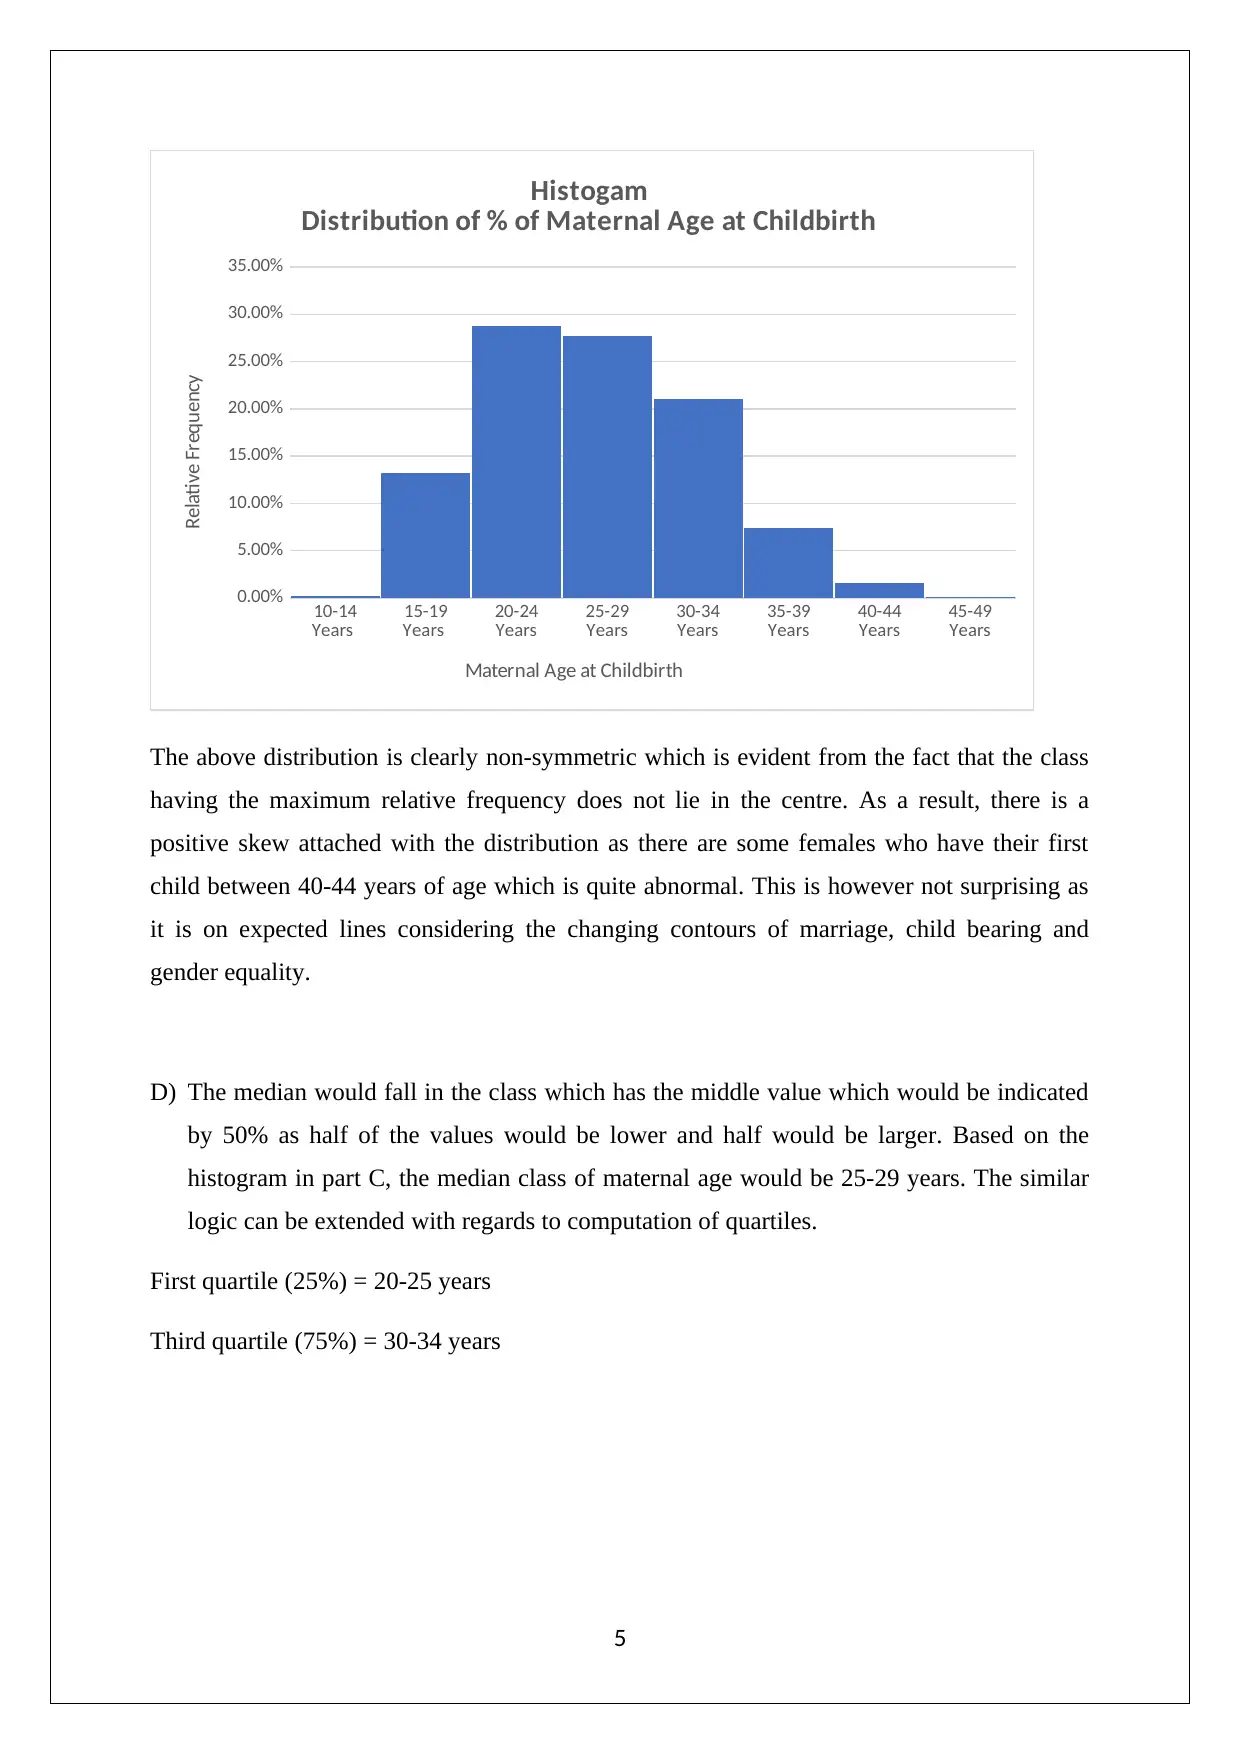
This statistics assignment delves into the analysis of histograms, focusing on two primary datasets: the ratio of omega-3 to omega-6 fatty acids in various oils and the age of mothers at their first childbirth. The assignment begins by analyzing the histogram of omega-3 to omega-6 ratios, determining the distribution's skewness and interpreting the health implications based on the data. It then examines the ratio of different fish oils. The second part of the assignment investigates maternal age at first childbirth, comparing histograms and count data, and analyzing the skewness of the distribution. It identifies the median and quartiles of the maternal age data, providing insights into the distribution's characteristics and trends. This assignment emphasizes the importance of histograms in understanding data distributions and drawing meaningful conclusions.
Document Page
APPIED STATISTICS
STUDENT ID:
[Pick the date]
tabler-icon-diamond-filled.svg

Paraphrase This Document

Need a fresh take? Get an instant paraphrase of this document with our AI Paraphraser
Document Page
Question 1
A) Histogram of the ratio of omega -3 to omega 6 in oils
0 to 1 1 to 2 2 to 3 3 to 4 4 to 5 5 to 6
0
5
10
15
20
25
Histogram
Distribution of Ratio of Omega 3 to Omega 6 in Oils
Ratio
Frequency
B) Frequency value more than 1 represents that the oils have higher omega 3 than omega 6.
It is evident from the above shown histogram that maximum frequency has been observed
in the bin of 0 to 1. Also, the sum of values that are falling in the range 1 to 2, 2 to 3, 3 to
4, 4 to 5 and 5 to 6 comes out to be 2+3+1+1=7. As a result, the shape of the histogram is
asymmetric or skewed.
Therefore, the distribution represents that very little proportion of the food oils has the ration
greater than 1 (omega 3> omega 6). Hence, it shows that foods belonging to these categories
have a positive impact on human health considering that omega 3 is healthier in comparison
to omega 6.
C) Ratios of the respective fish oils are summarised in the table below.
Fish Oils Ratio
2
Document Page
Cod 2.00
Herring 2.67
Menhaden 1.96
Salmon 2.50
Sardine 2.16
It can be seen from the above that all the respective fish oils show ratio higher than 1 which
means they have more omega 3 than omega 6 and hence, they would be considered as
healthy. Since the fish oils are healthy, hence eating fish would be considered as healthy.
Question 2
A) Histogram to represents that age of mother at her first child birth is indicated as follows.
10-14 Years 15-19 Years 20-24 Years 25-29 Years 30-34 Years 35-39 Years 40-44 Years 45-49 Years
-
50,000
100,000
150,000
200,000
250,000
300,000
350,000
400,000
450,000
500,000
Histogram
Distribution of Maternal Age at Childbirth
Maternal Age at Childbirth
Frequency
A histogram is preferred over counts since histogram enables understanding of the overall
distribution which is not possible by focussing on counts. These respective distributions can
then be compared across countries in order to derive useful conclusions about various
countries trend in regards to age of mother at her first child birth.
3
Document Page
B) Number of babies distribution is summarised in the tabular manner indicated as follows.
Age Count
10-14 Years 2,769
15-19 Years 2,05,747
20-24 Years 4,45,523
25-29 Years 4,28,762
30-34 Years 3,26,391
35-39 Years 1,14,972
40-44 Years 23,941
45-49 Years 2,169
Total 15,50,274
Based on above table, it can be said that there were 15,50,274 babies in total.
C) Histogram to represent the percentage distribution of age of mother at her first baby birth
is indicated below.
Age Count Relative frequency
10-14 Years 2,769 0.18%
15-19 Years 2,05,747 13.27%
20-24 Years 4,45,523 28.74%
25-29 Years 4,28,762 27.66%
30-34 Years 3,26,391 21.05%
35-39 Years 1,14,972 7.42%
40-44 Years 23,941 1.54%
45-49 Years 2,169 0.14%
Total 15,50,274 100%
4
tabler-icon-diamond-filled.svg

Paraphrase This Document

Need a fresh take? Get an instant paraphrase of this document with our AI Paraphraser
Document Page
10-14
Years 15-19
Years 20-24
Years 25-29
Years 30-34
Years 35-39
Years 40-44
Years 45-49
Years
0.00%
5.00%
10.00%
15.00%
20.00%
25.00%
30.00%
35.00%
Histogam
Distribution of % of Maternal Age at Childbirth
Maternal Age at Childbirth
Relative Frequency
The above distribution is clearly non-symmetric which is evident from the fact that the class
having the maximum relative frequency does not lie in the centre. As a result, there is a
positive skew attached with the distribution as there are some females who have their first
child between 40-44 years of age which is quite abnormal. This is however not surprising as
it is on expected lines considering the changing contours of marriage, child bearing and
gender equality.
D) The median would fall in the class which has the middle value which would be indicated
by 50% as half of the values would be lower and half would be larger. Based on the
histogram in part C, the median class of maternal age would be 25-29 years. The similar
logic can be extended with regards to computation of quartiles.
First quartile (25%) = 20-25 years
Third quartile (75%) = 30-34 years
5
chevron_up_icon
1 out of 5
circle_padding
hide_on_mobile
zoom_out_icon
[object Object]